| Param | Original file | Final file |
|---|---|---|
| Filename | modeM0/AS1G07_029T02_9000001256_09022cztM0_level2.evt | modeM0/AS1G07_029T02_9000001256_09022cztM0_level2_quad_clean.evt |
| Size (bytes) | 595,992,960 | 94,602,240 |
| Size | 568.4 MB | 90.2 MB |
| Events in quadrant A | 6,611,554 | 580,207 |
| Events in quadrant B | 3,641,349 | 606,760 |
| Events in quadrant C | 3,221,608 | 599,969 |
| Events in quadrant D | 4,088,617 | 577,599 |
| Mode SS | |||
|---|---|---|---|
| Quadrant | BADHDUFLAG | Total packets | Discarded packets |
| A | 0 | 146 | 0 |
| B | 0 | 146 | 0 |
| C | 0 | 146 | 0 |
| D | 0 | 146 | 0 |
| Mode M9 | |||
|---|---|---|---|
| Quadrant | BADHDUFLAG | Total packets | Discarded packets |
| A | 0 | 2 | 0 |
| B | 0 | 2 | 0 |
| C | 0 | 2 | 0 |
| D | 0 | 2 | 0 |
| Mode M0 | |||
|---|---|---|---|
| Quadrant | BADHDUFLAG | Total packets | Discarded packets |
| A | 0 | 24403 | 2 |
| B | 0 | 15556 | 1 |
| C | 0 | 14749 | 1 |
| D | 0 | 17074 | 1 |
| Quadrant | Total seconds | Saturated seconds | Saturation percentage |
|---|---|---|---|
| A | 7180 | 512 | 7.130919% |
| B | 7180 | 128 | 1.782730% |
| C | 7180 | 46 | 0.640669% |
| D | 7180 | 127 | 1.768802% |
Noise dominated data is calculated using 1-second bins in cleaned event files. If a bin has >2000 counts, and if more than 50% of those come from <1% of pixels, then it is considered to be noise-dominated and hence unusable.
| Quadrant | # 1 sec bins | Bins with >0 counts | Bins with >2000 counts | High rate bins dominated by noise | Noise dominated (total time) | Noise dominated (detector-on time) | Marked lightcurve |
|---|---|---|---|---|---|---|---|
| A | 7360 | 7183 | 474 | 474 | 6.44% | 6.60% |  |
| B | 7360 | 7183 | 17 | 17 | 0.23% | 0.24% | 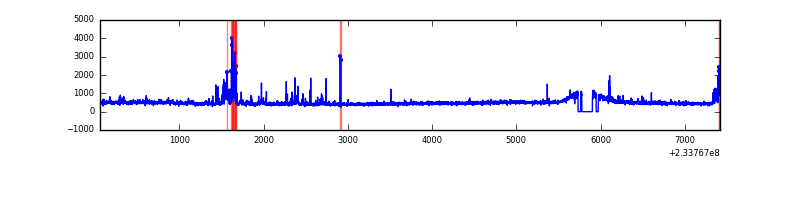 |
| C | 7360 | 7183 | 0 | 0 | 0.00% | 0.00% | 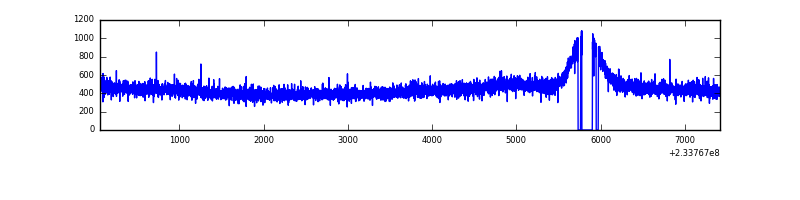 |
| D | 7360 | 7183 | 34 | 34 | 0.46% | 0.47% | 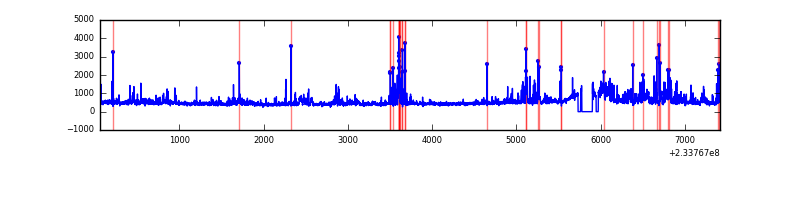 |
Top three noisy pixels from each quadrant. If the there are fewer than three noisy pixels in the level2.evt file, extra rows are filled as -1
| Pixel properties | Quadrant properties | ||||||
|---|---|---|---|---|---|---|---|
| Quadrant | DetID | PixID | Counts | Sigma | Mean | Median | Sigma |
| A | 8 | 5 | 3098877 | 18074.2 | 837 | 817 | 171.4 |
| A | 13 | 251 | 111728 | 647.06 | 837 | 817 | 171.4 |
| A | 1 | 162 | 99735 | 577.09 | 837 | 817 | 171.4 |
| B | 4 | 48 | 199817 | 1215.4 | 849 | 826 | 163.7 |
| B | 0 | 214 | 34441 | 205.31 | 849 | 826 | 163.7 |
| B | 10 | 245 | 30638 | 182.09 | 849 | 826 | 163.7 |
| C | 13 | 61 | 6380 | 28.78 | 824 | 827 | 192.9 |
| C | 8 | 128 | 3868 | 15.76 | 824 | 827 | 192.9 |
| C | 8 | 112 | 2478 | 8.56 | 824 | 827 | 192.9 |
| D | 6 | 225 | 388687 | 1779.2 | 822 | 801 | 218.0 |
| D | 4 | 95 | 159912 | 729.83 | 822 | 801 | 218.0 |
| D | 13 | 104 | 106977 | 487.02 | 822 | 801 | 218.0 |
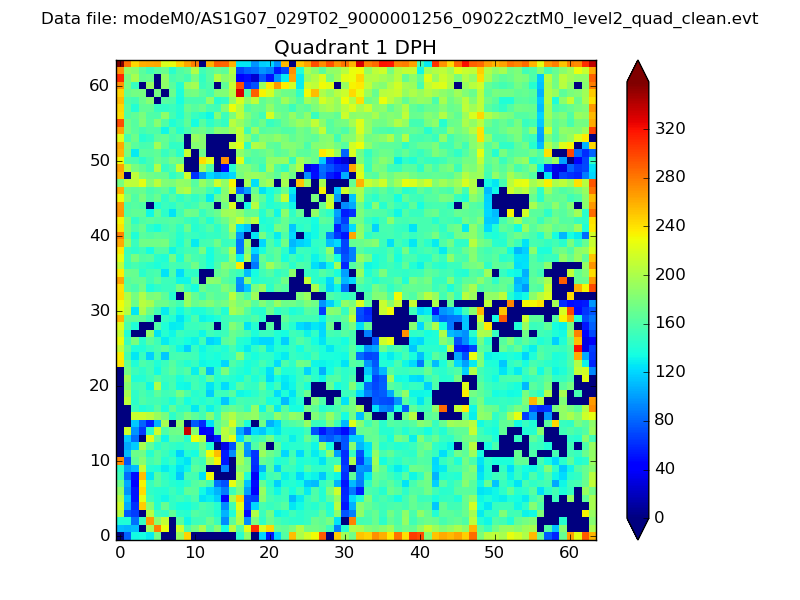
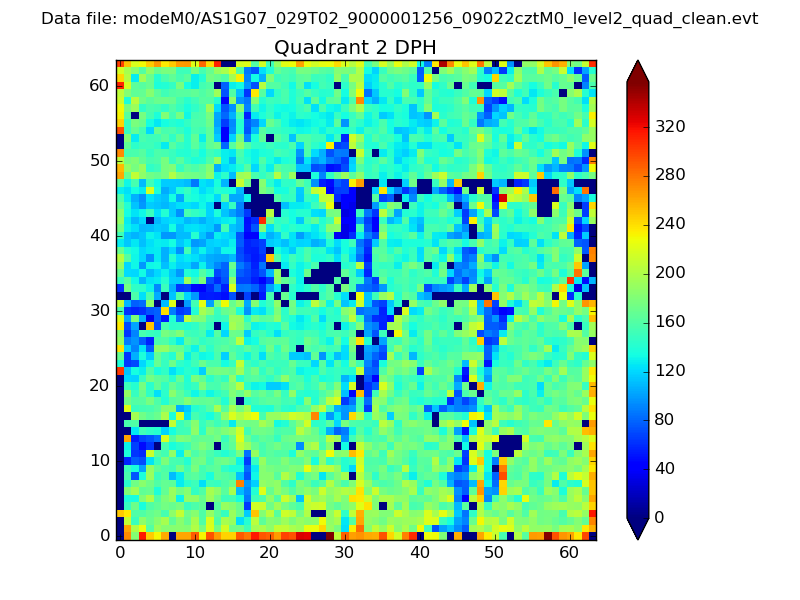
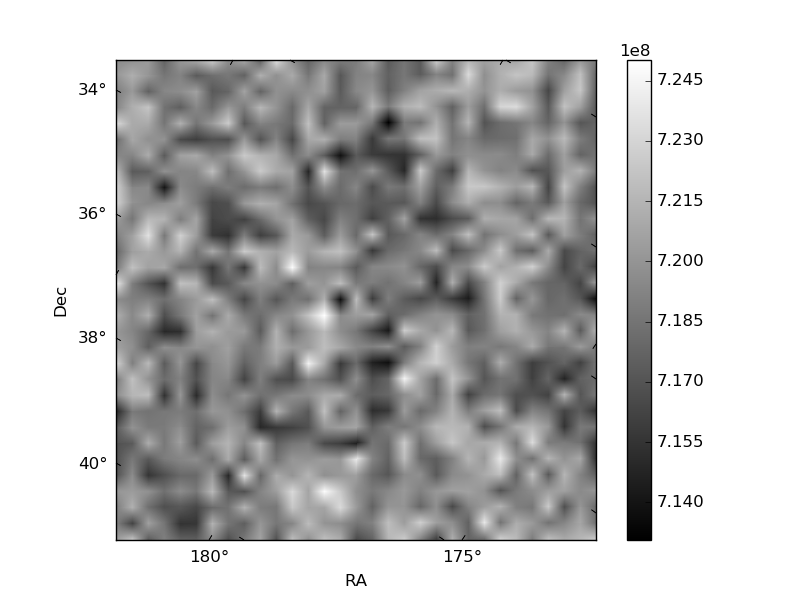
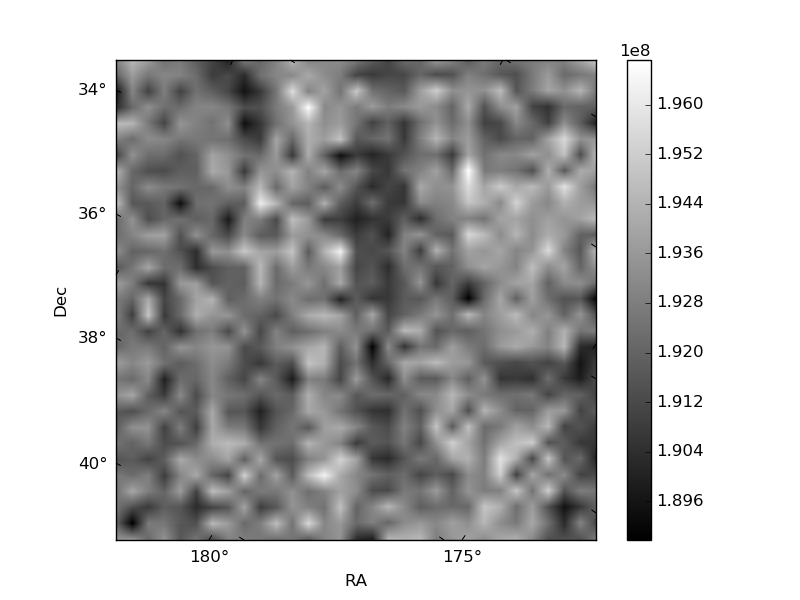
Histogram calculated using DETX and DETY for each event in the final _common_clean file
| Quadrant A | 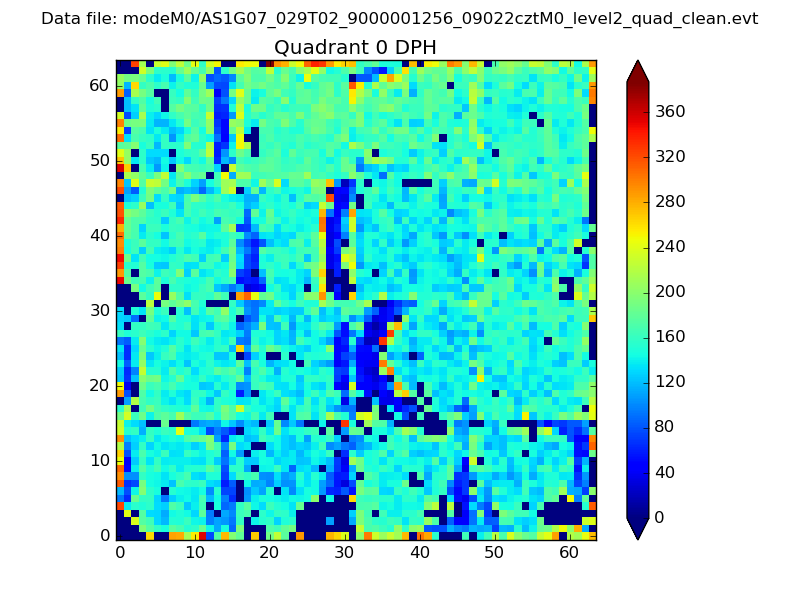 |
 |
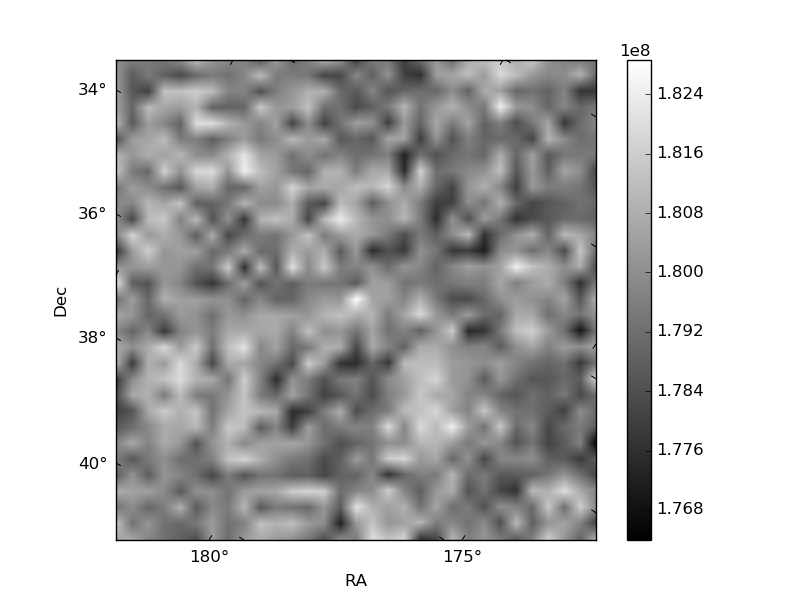
Quadrant B |
|---|---|---|---|
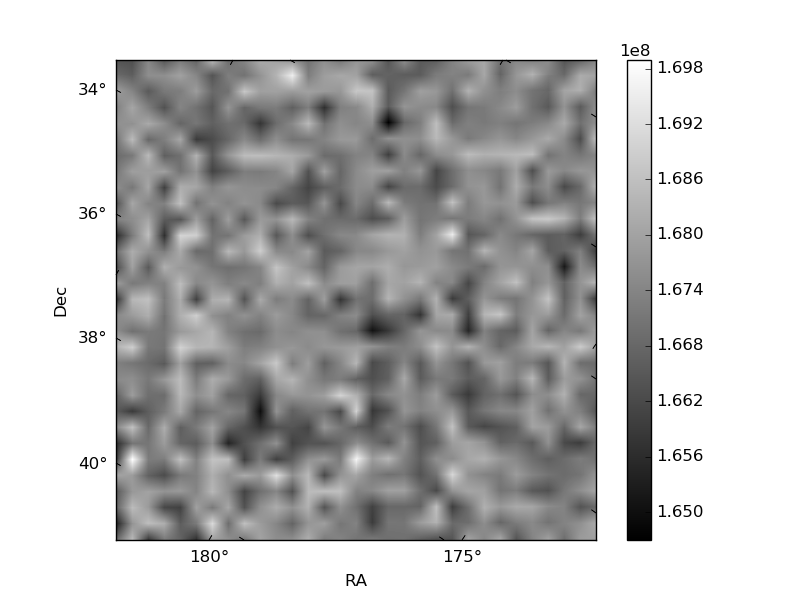
| Quadrant D | 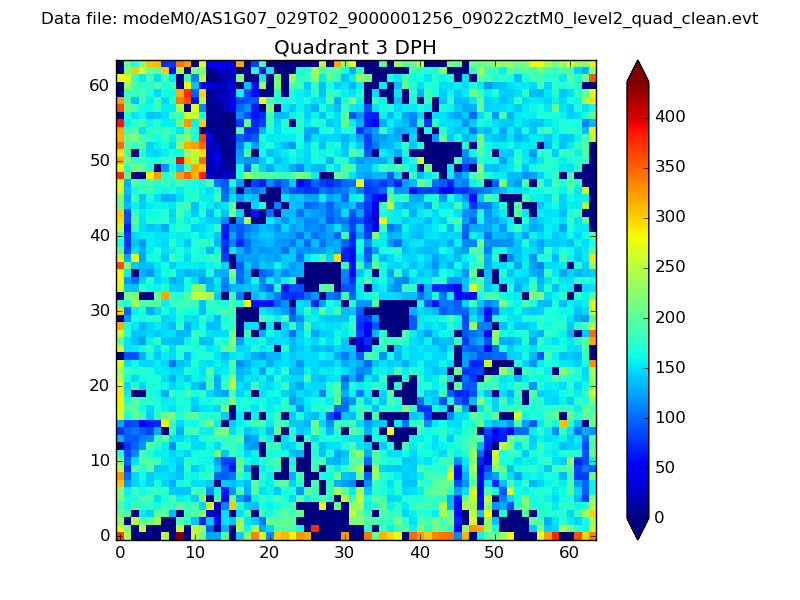 |
 |
Quadrant C |
| Plot type | Count rate plots | Images |
|---|---|---|
| Comparison with Poisson distribution Blue bars denote a histogram of data divided into 1 sec bins. Red curve is a Poisson curve with rate = median count rate of data. |
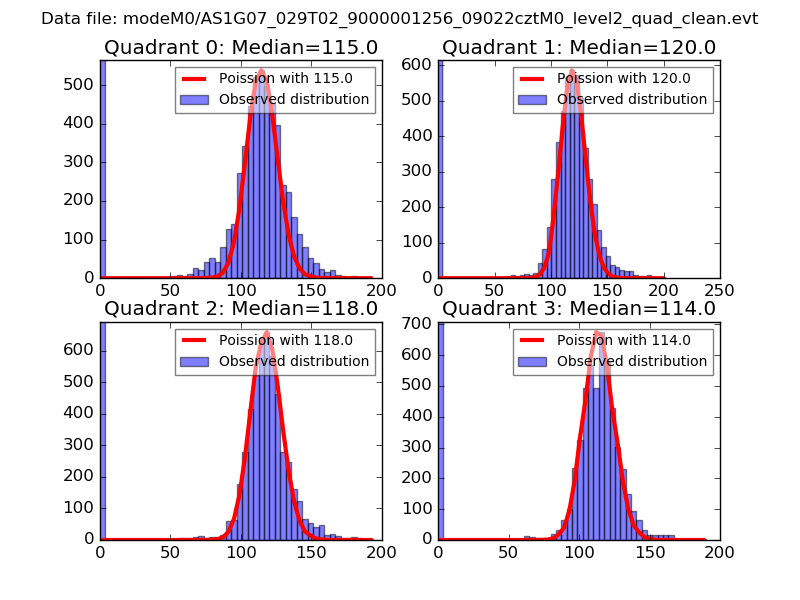 |
 |
| Quadrant-wise count rates Data is divided into 100 sec bins |
 |
|
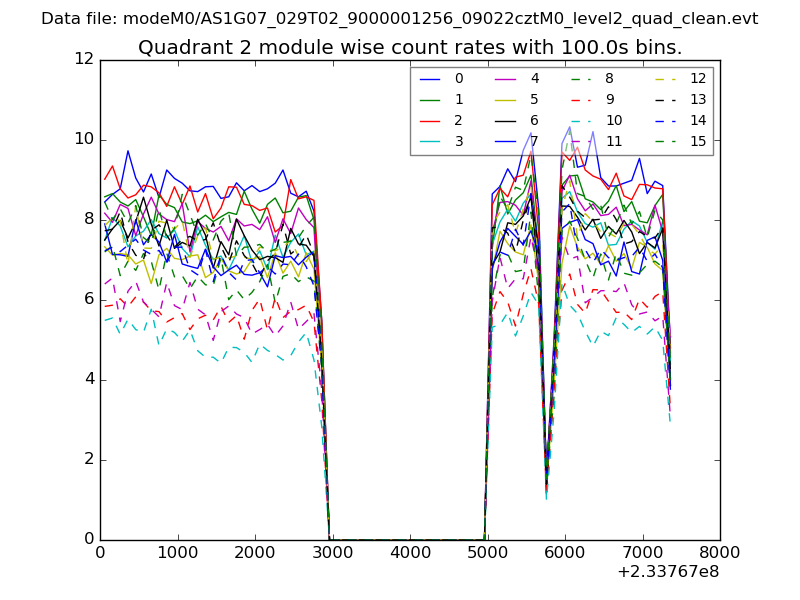
| Module-wise count rates for Quadrant A Data is divided into 100 sec bins |
 |
 |
| Module-wise count rates for Quadrant B Data is divided into 100 sec bins |
 |
 |
| Module-wise count rates for Quadrant C Data is divided into 100 sec bins |
 |
 |
| Module-wise count rates for Quadrant D Data is divided into 100 sec bins |
 |
 |
| Parameter | Plot |
|---|---|
| CZT HV Monitor | 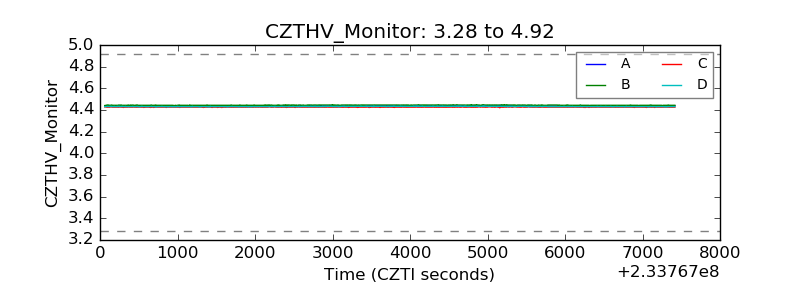 |
| D_VDD |  |
| Temperature 1 | 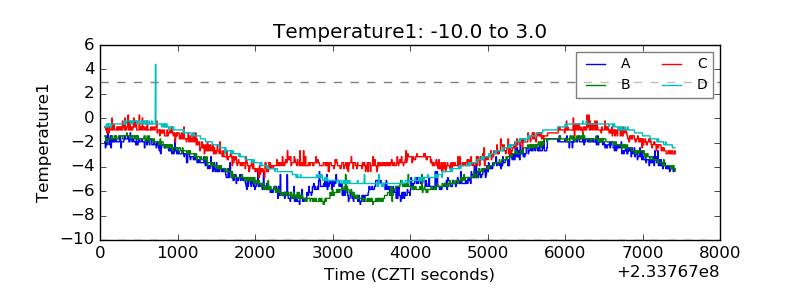 |
| Veto HV Monitor | 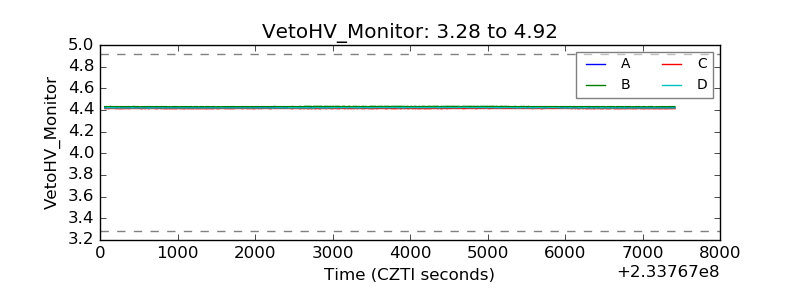 |
| Veto LLD | 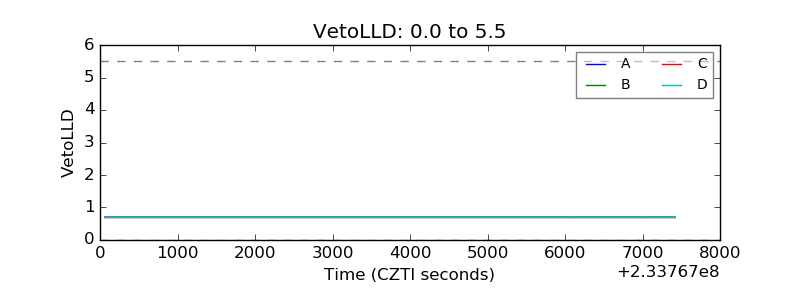 |
| Alpha Counter |  |
| _CPM_Rate |  |
| CZT Counter | 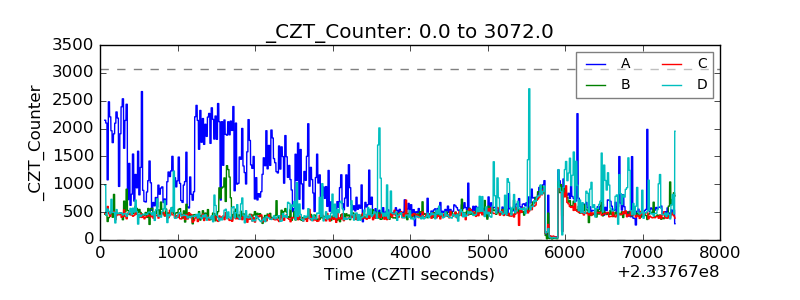 |
| +2.5 Volts monitor |  |
| +5 Volts monitor |  |
| _ROLL_ROT | 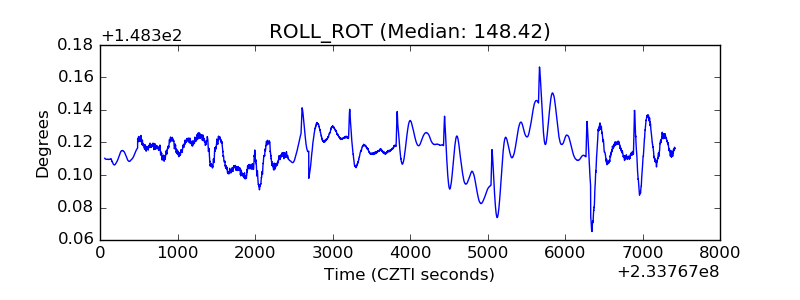 |
| _Roll_DEC | 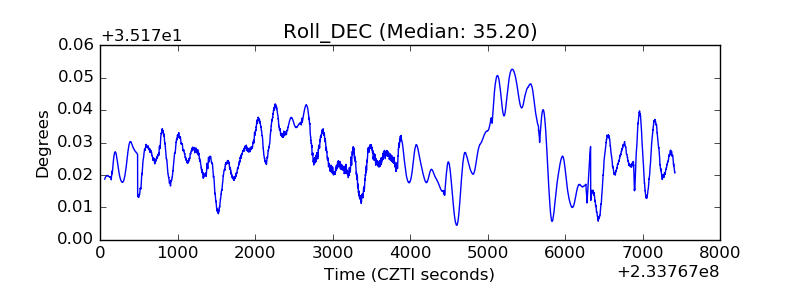 |
| _Roll_RA | 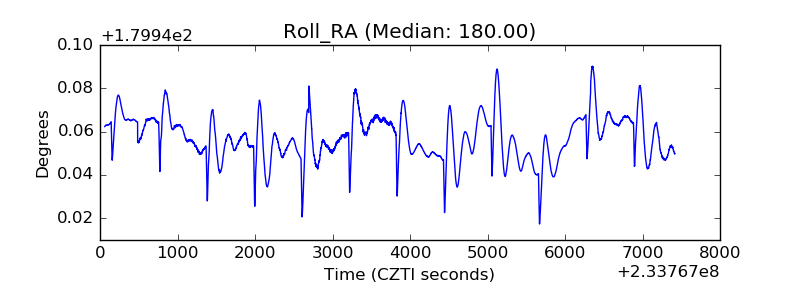 |
| Veto Counter | 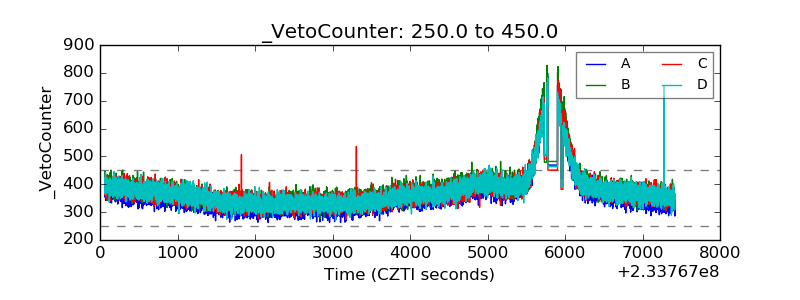 |