| Param | Original file | Final file |
|---|---|---|
| Filename | modeM0/AS1G07_029T02_9000001256_09025cztM0_level2.evt | modeM0/AS1G07_029T02_9000001256_09025cztM0_level2_quad_clean.evt |
| Size (bytes) | 966,798,720 | 164,203,200 |
| Size | 922.0 MB | 156.6 MB |
| Events in quadrant A | 8,039,182 | 1,022,860 |
| Events in quadrant B | 6,173,854 | 1,046,984 |
| Events in quadrant C | 5,656,355 | 1,031,724 |
| Events in quadrant D | 8,540,115 | 981,999 |
| Mode SS | |||
|---|---|---|---|
| Quadrant | BADHDUFLAG | Total packets | Discarded packets |
| A | 0 | 264 | 0 |
| B | 0 | 264 | 0 |
| C | 0 | 264 | 0 |
| D | 0 | 264 | 0 |
| Mode M9 | |||
|---|---|---|---|
| Quadrant | BADHDUFLAG | Total packets | Discarded packets |
| A | 0 | 18 | 0 |
| B | 0 | 18 | 0 |
| C | 0 | 18 | 0 |
| D | 0 | 18 | 0 |
| Mode M0 | |||
|---|---|---|---|
| Quadrant | BADHDUFLAG | Total packets | Discarded packets |
| A | 0 | 32410 | 4 |
| B | 0 | 27117 | 3 |
| C | 0 | 26132 | 3 |
| D | 0 | 34533 | 5 |
| Quadrant | Total seconds | Saturated seconds | Saturation percentage |
|---|---|---|---|
| A | 12865 | 304 | 2.363000% |
| B | 12865 | 112 | 0.870579% |
| C | 12865 | 47 | 0.365332% |
| D | 12864 | 507 | 3.941231% |
Noise dominated data is calculated using 1-second bins in cleaned event files. If a bin has >2000 counts, and if more than 50% of those come from <1% of pixels, then it is considered to be noise-dominated and hence unusable.
| Quadrant | # 1 sec bins | Bins with >0 counts | Bins with >2000 counts | High rate bins dominated by noise | Noise dominated (total time) | Noise dominated (detector-on time) | Marked lightcurve |
|---|---|---|---|---|---|---|---|
| A | 14645 | 12868 | 132 | 132 | 0.90% | 1.03% | 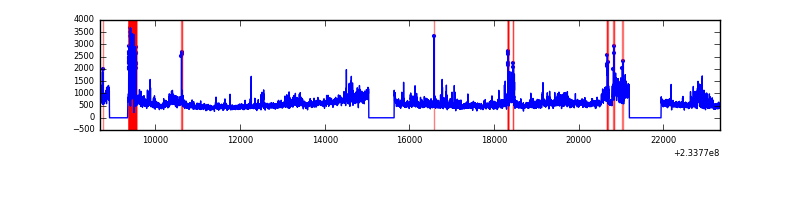 |
| B | 14645 | 12867 | 15 | 15 | 0.10% | 0.12% | 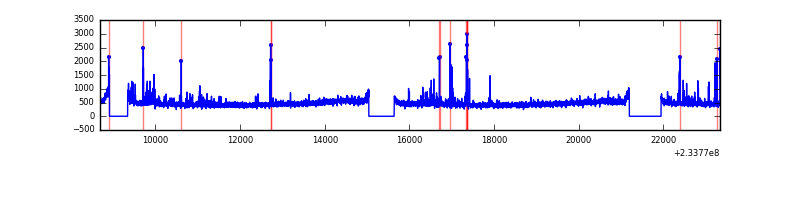 |
| C | 14645 | 12868 | 0 | 0 | 0.00% | 0.00% |  |
| D | 14645 | 12868 | 304 | 304 | 2.08% | 2.36% | 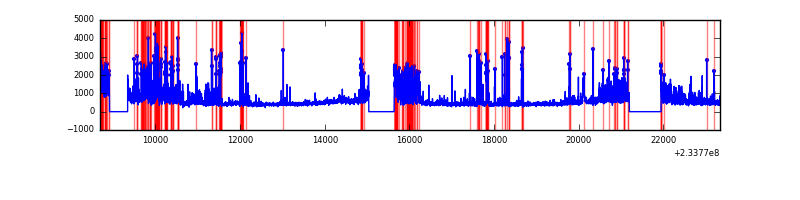 |
Top three noisy pixels from each quadrant. If the there are fewer than three noisy pixels in the level2.evt file, extra rows are filled as -1
| Pixel properties | Quadrant properties | ||||||
|---|---|---|---|---|---|---|---|
| Quadrant | DetID | PixID | Counts | Sigma | Mean | Median | Sigma |
| A | 8 | 5 | 1956456 | 6474.84 | 1475 | 1441 | 301.9 |
| A | 13 | 251 | 167822 | 551.04 | 1475 | 1441 | 301.9 |
| A | 1 | 162 | 131672 | 431.31 | 1475 | 1441 | 301.9 |
| B | 6 | 51 | 99291 | 342.84 | 1496 | 1457 | 285.4 |
| B | 4 | 48 | 97647 | 337.08 | 1496 | 1457 | 285.4 |
| B | 0 | 197 | 42956 | 145.42 | 1496 | 1457 | 285.4 |
| C | 13 | 61 | 10996 | 28.26 | 1449 | 1456 | 337.6 |
| C | 7 | 238 | 3790 | 6.91 | 1449 | 1456 | 337.6 |
| C | 7 | 159 | 3663 | 6.54 | 1449 | 1456 | 337.6 |
| D | 6 | 225 | 1593337 | 4404.33 | 1424 | 1386 | 361.5 |
| D | 1 | 52 | 396901 | 1094.24 | 1424 | 1386 | 361.5 |
| D | 13 | 104 | 300440 | 827.37 | 1424 | 1386 | 361.5 |
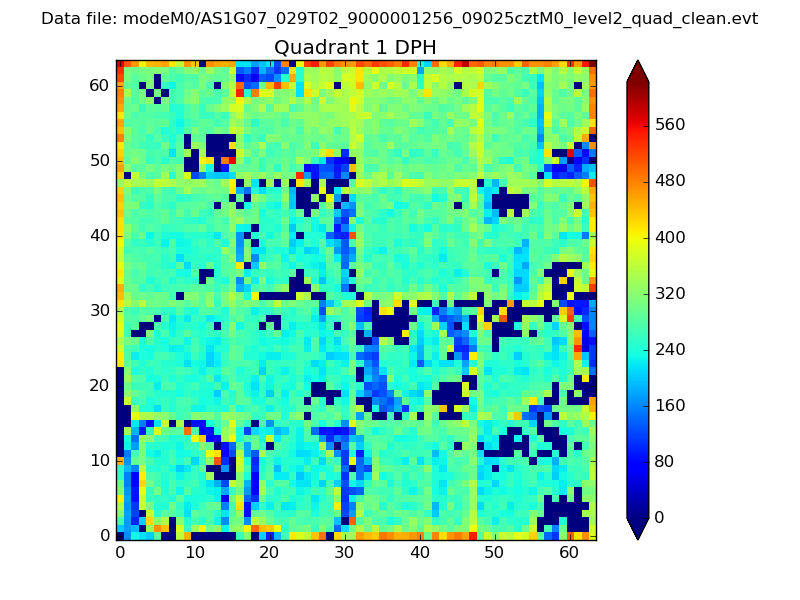
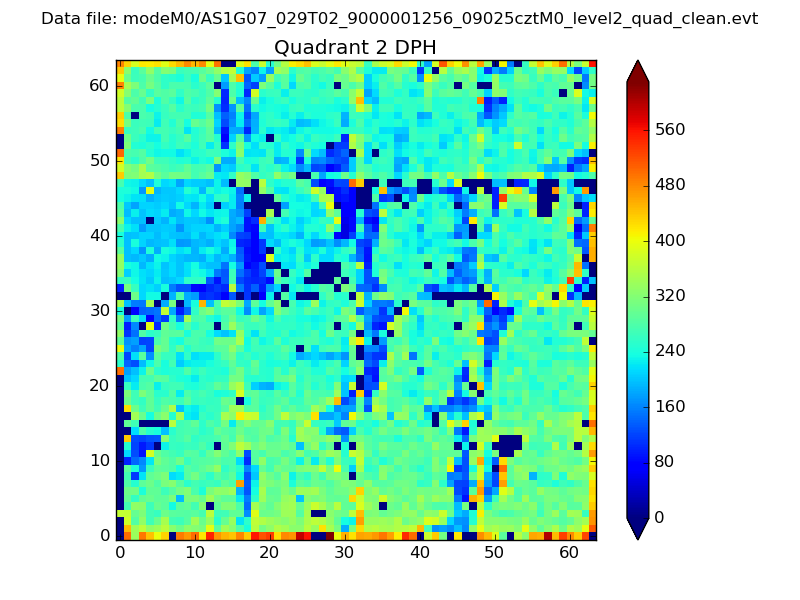
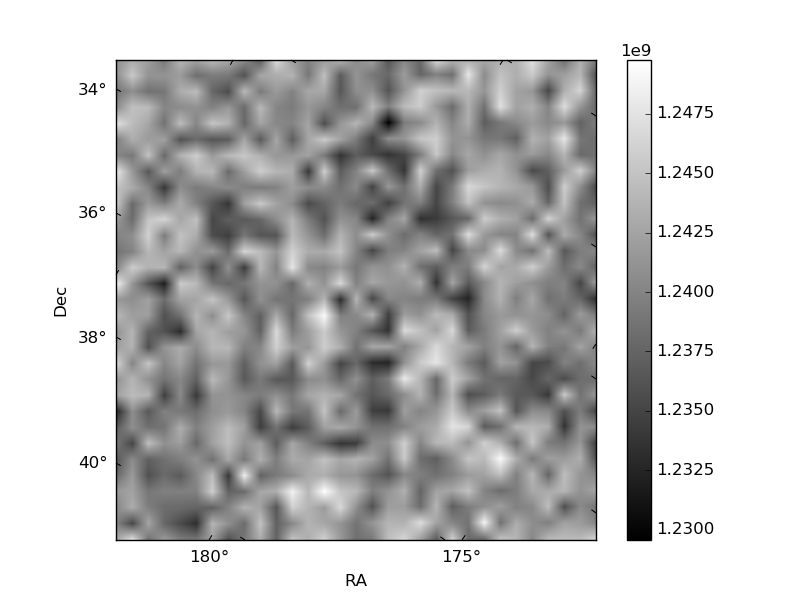
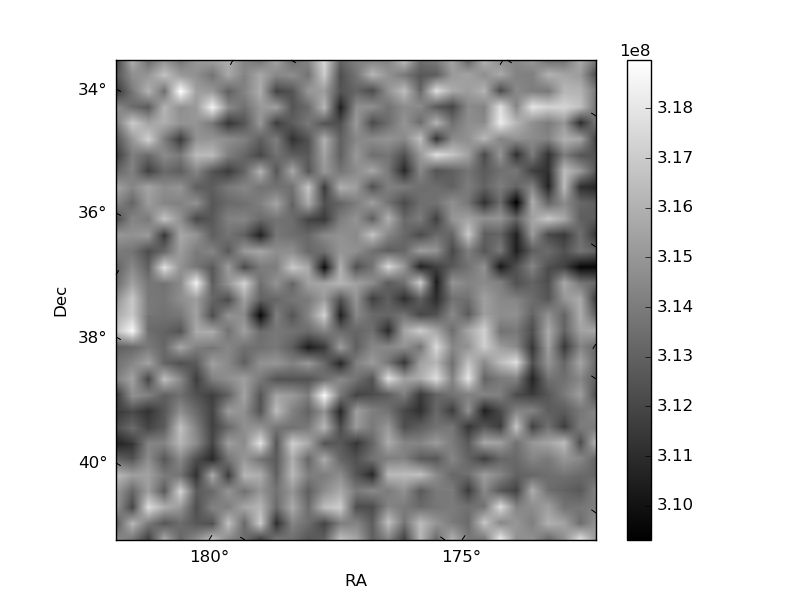
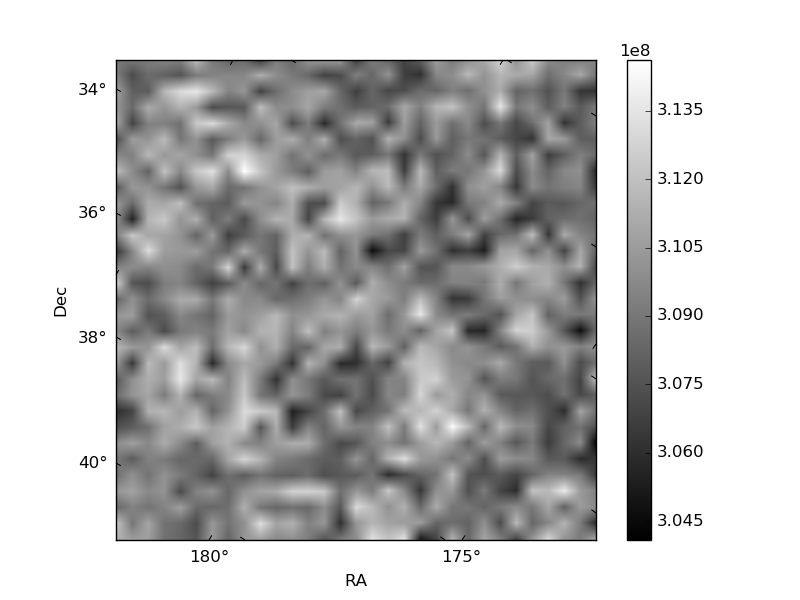
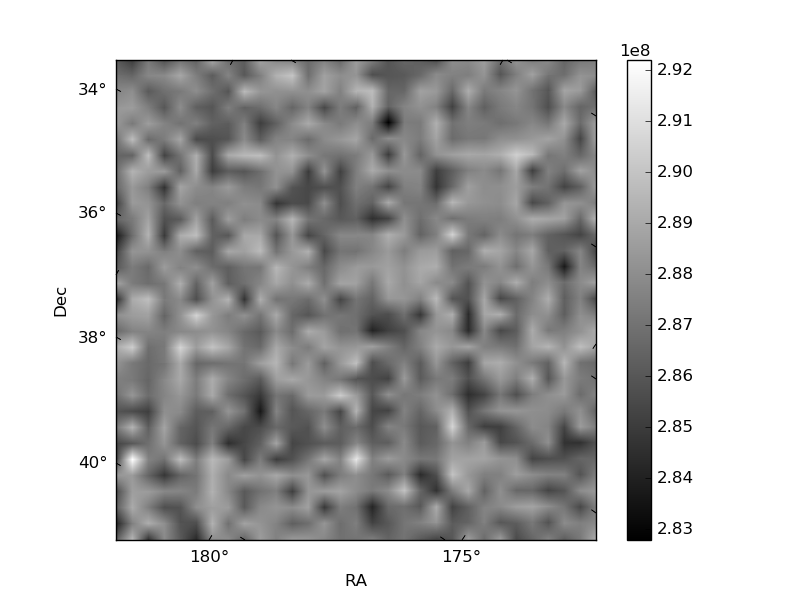
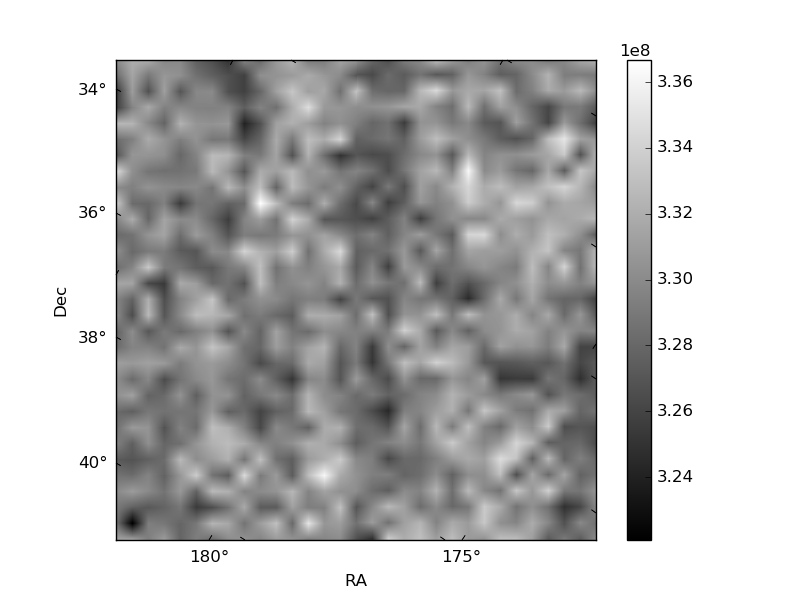
Histogram calculated using DETX and DETY for each event in the final _common_clean file
| Quadrant A | 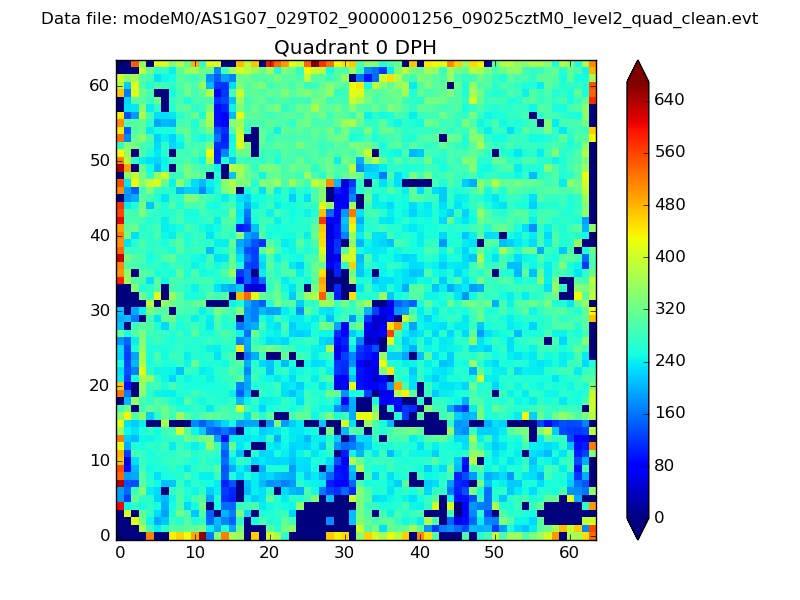 |
 |
Quadrant B |
|---|---|---|---|
| Quadrant D | 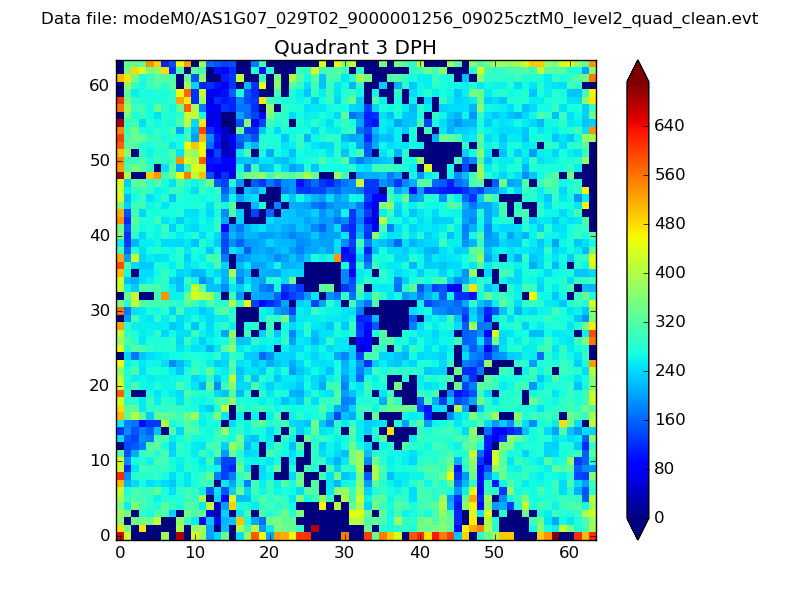 |
 |
Quadrant C |
| Plot type | Count rate plots | Images |
|---|---|---|
| Comparison with Poisson distribution Blue bars denote a histogram of data divided into 1 sec bins. Red curve is a Poisson curve with rate = median count rate of data. |
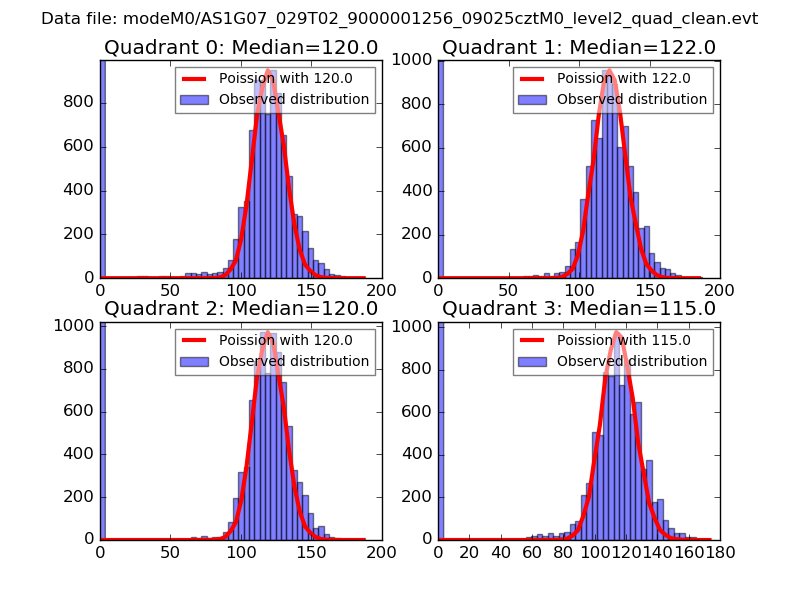 |
 |
| Quadrant-wise count rates Data is divided into 100 sec bins |
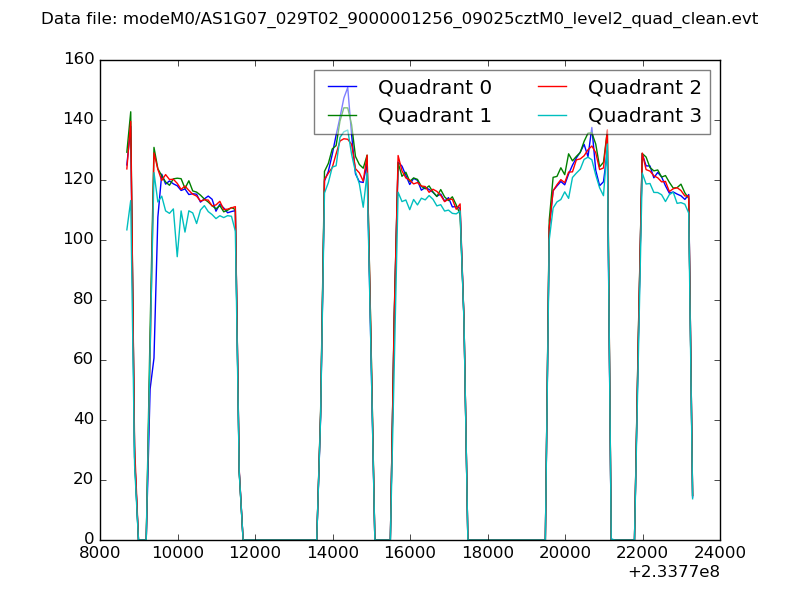 |
|
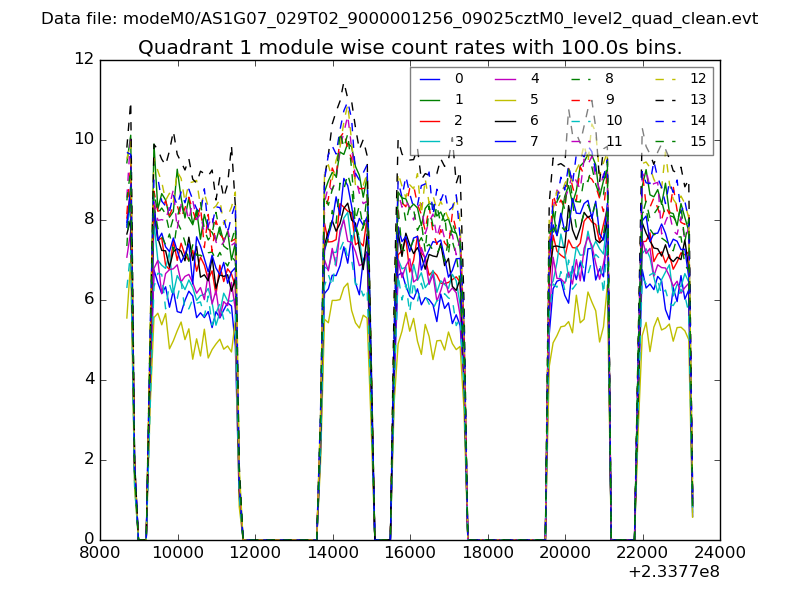
| Module-wise count rates for Quadrant A Data is divided into 100 sec bins |
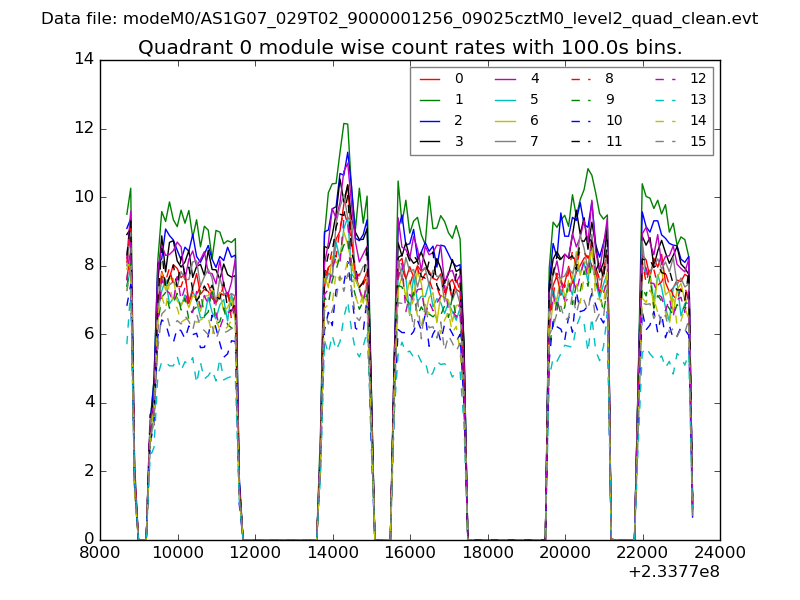 |
 |
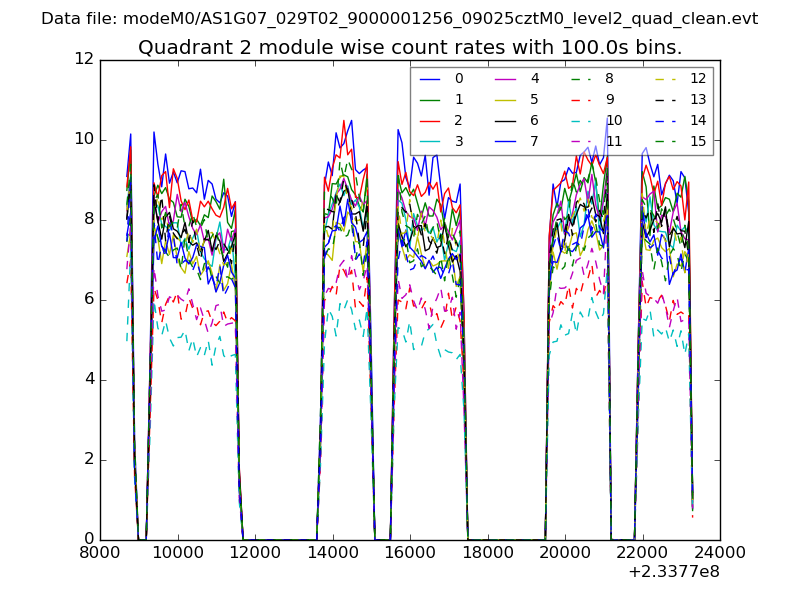
| Module-wise count rates for Quadrant B Data is divided into 100 sec bins |
 |
 |
| Module-wise count rates for Quadrant C Data is divided into 100 sec bins |
 |
 |
| Module-wise count rates for Quadrant D Data is divided into 100 sec bins |
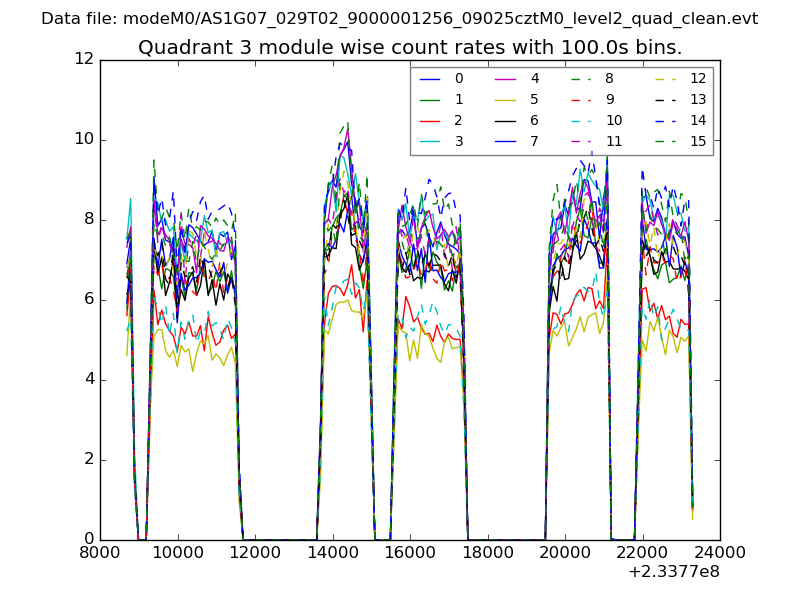 |
 |
| Parameter | Plot |
|---|---|
| CZT HV Monitor | 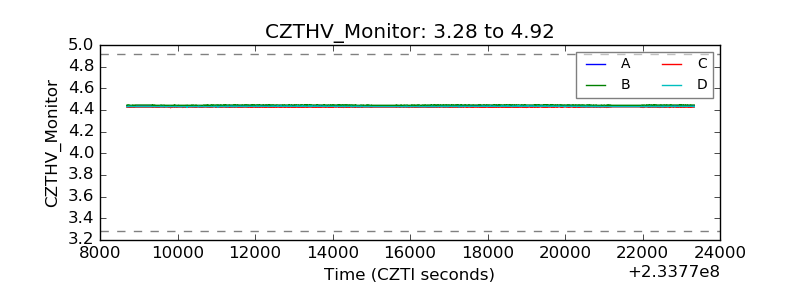 |
| D_VDD | 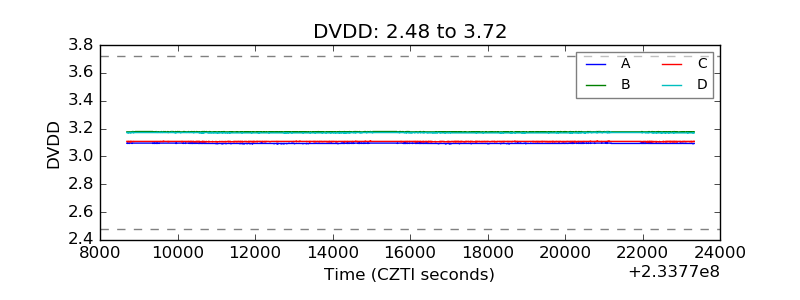 |
| Temperature 1 | 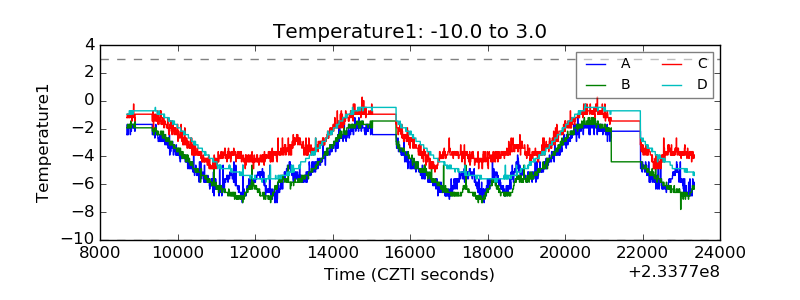 |
| Veto HV Monitor | 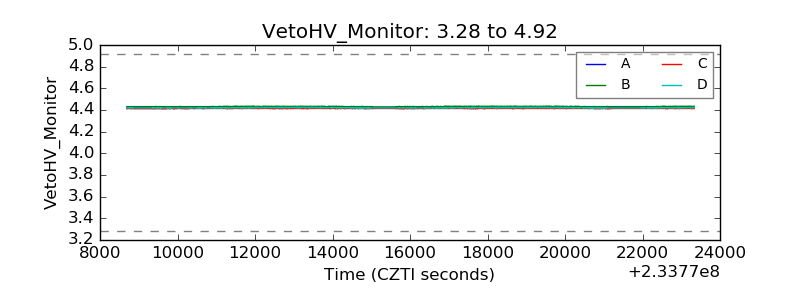 |
| Veto LLD |  |
| Alpha Counter | 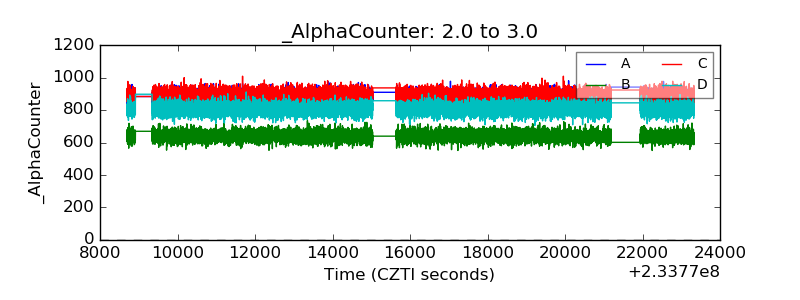 |
| _CPM_Rate | 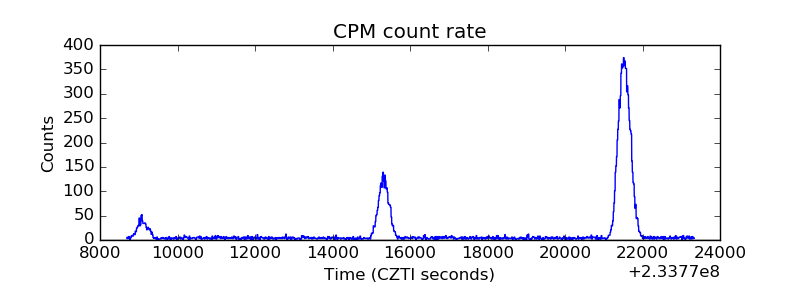 |
| CZT Counter | 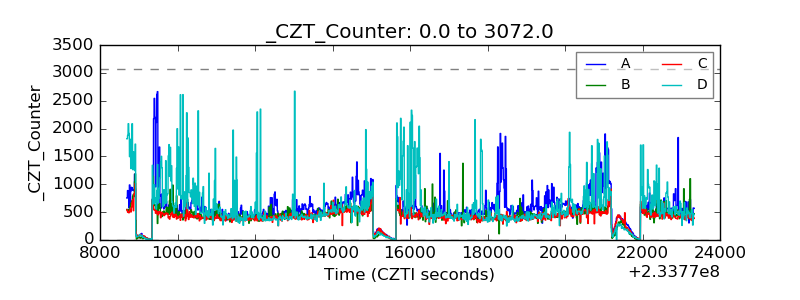 |
| +2.5 Volts monitor |  |
| +5 Volts monitor |  |
| _ROLL_ROT | 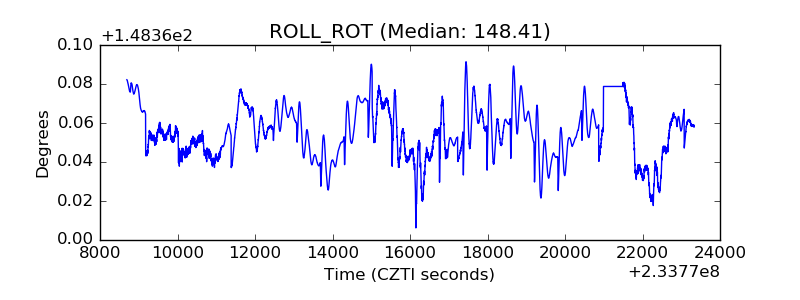 |
| _Roll_DEC | 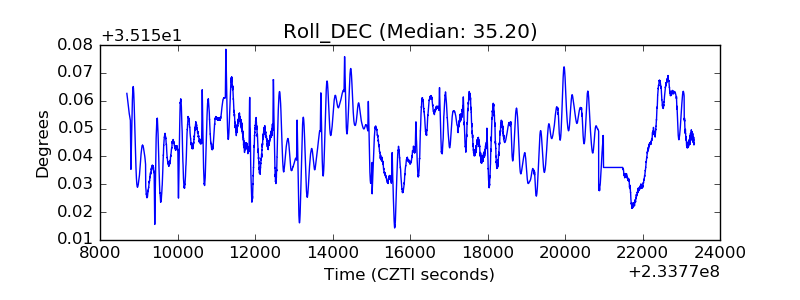 |
| _Roll_RA | 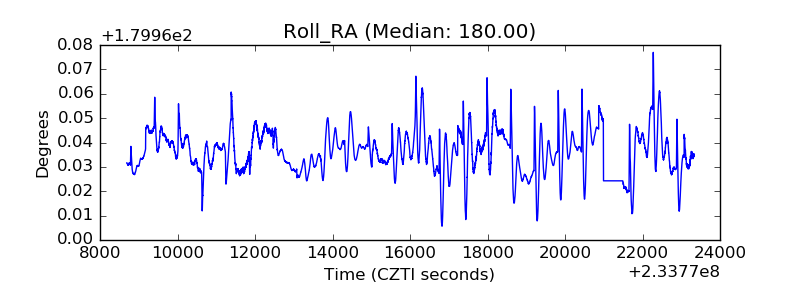 |
| Veto Counter | 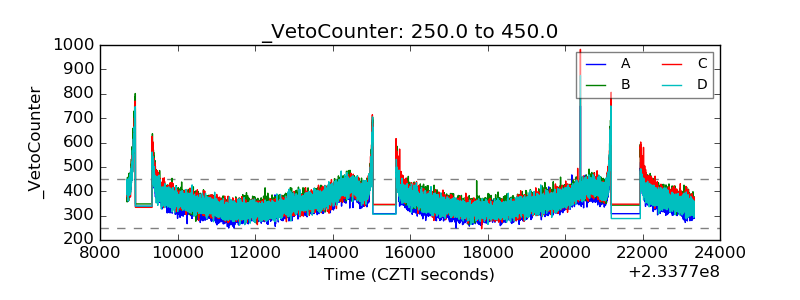 |