| Param | Original file | Final file |
|---|---|---|
| Filename | modeM0/AS1G07_029T02_9000001256_09026cztM0_level2.evt | modeM0/AS1G07_029T02_9000001256_09026cztM0_level2_quad_clean.evt |
| Size (bytes) | 557,942,400 | 93,263,040 |
| Size | 532.1 MB | 88.9 MB |
| Events in quadrant A | 5,141,371 | 578,274 |
| Events in quadrant B | 3,717,610 | 593,244 |
| Events in quadrant C | 3,250,200 | 583,249 |
| Events in quadrant D | 4,293,990 | 561,926 |
| Mode SS | |||
|---|---|---|---|
| Quadrant | BADHDUFLAG | Total packets | Discarded packets |
| A | 0 | 148 | 0 |
| B | 0 | 148 | 0 |
| C | 0 | 148 | 0 |
| D | 0 | 148 | 0 |
| Mode M9 | |||
|---|---|---|---|
| Quadrant | BADHDUFLAG | Total packets | Discarded packets |
| A | 0 | 17 | 0 |
| B | 0 | 17 | 0 |
| C | 0 | 17 | 0 |
| D | 0 | 17 | 0 |
| Mode M0 | |||
|---|---|---|---|
| Quadrant | BADHDUFLAG | Total packets | Discarded packets |
| A | 0 | 19924 | 3 |
| B | 0 | 15950 | 2 |
| C | 0 | 14799 | 2 |
| D | 0 | 17854 | 2 |
| Quadrant | Total seconds | Saturated seconds | Saturation percentage |
|---|---|---|---|
| A | 7296 | 269 | 3.686952% |
| B | 7296 | 95 | 1.302083% |
| C | 7296 | 22 | 0.301535% |
| D | 7296 | 112 | 1.535088% |
Noise dominated data is calculated using 1-second bins in cleaned event files. If a bin has >2000 counts, and if more than 50% of those come from <1% of pixels, then it is considered to be noise-dominated and hence unusable.
| Quadrant | # 1 sec bins | Bins with >0 counts | Bins with >2000 counts | High rate bins dominated by noise | Noise dominated (total time) | Noise dominated (detector-on time) | Marked lightcurve |
|---|---|---|---|---|---|---|---|
| A | 8981 | 7298 | 183 | 183 | 2.04% | 2.51% | 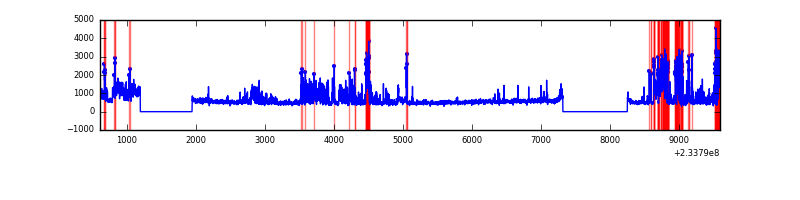 |
| B | 8981 | 7298 | 22 | 22 | 0.24% | 0.30% | 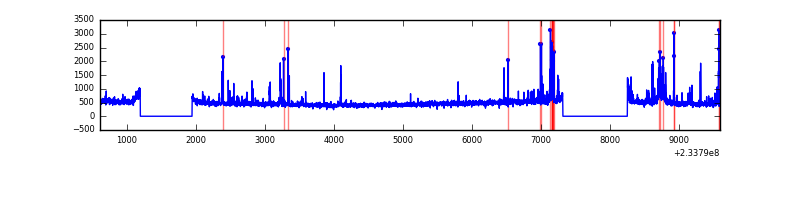 |
| C | 8981 | 7298 | 0 | 0 | 0.00% | 0.00% | 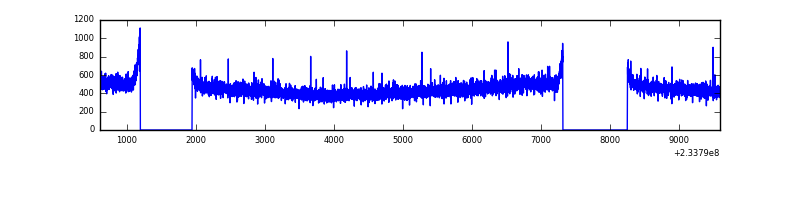 |
| D | 8981 | 7298 | 56 | 56 | 0.62% | 0.77% | 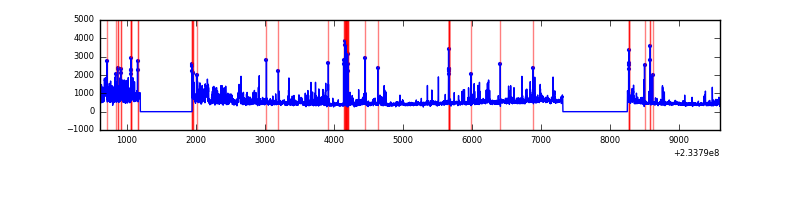 |
Top three noisy pixels from each quadrant. If the there are fewer than three noisy pixels in the level2.evt file, extra rows are filled as -1
| Pixel properties | Quadrant properties | ||||||
|---|---|---|---|---|---|---|---|
| Quadrant | DetID | PixID | Counts | Sigma | Mean | Median | Sigma |
| A | 8 | 5 | 1708669 | 9722.07 | 847 | 828 | 175.7 |
| A | 1 | 162 | 81082 | 456.85 | 847 | 828 | 175.7 |
| A | 13 | 251 | 52611 | 294.78 | 847 | 828 | 175.7 |
| B | 4 | 48 | 184851 | 1111.4 | 858 | 836 | 165.6 |
| B | 6 | 51 | 124666 | 747.9 | 858 | 836 | 165.6 |
| B | 0 | 214 | 26802 | 156.83 | 858 | 836 | 165.6 |
| C | 13 | 61 | 6142 | 27.28 | 833 | 834 | 194.6 |
| C | 3 | 254 | 2218 | 7.11 | 833 | 834 | 194.6 |
| C | 3 | 202 | 2011 | 6.05 | 833 | 834 | 194.6 |
| D | 6 | 225 | 564625 | 2642.58 | 823 | 803 | 213.4 |
| D | 1 | 52 | 295703 | 1382.17 | 823 | 803 | 213.4 |
| D | 2 | 14 | 111835 | 520.4 | 823 | 803 | 213.4 |
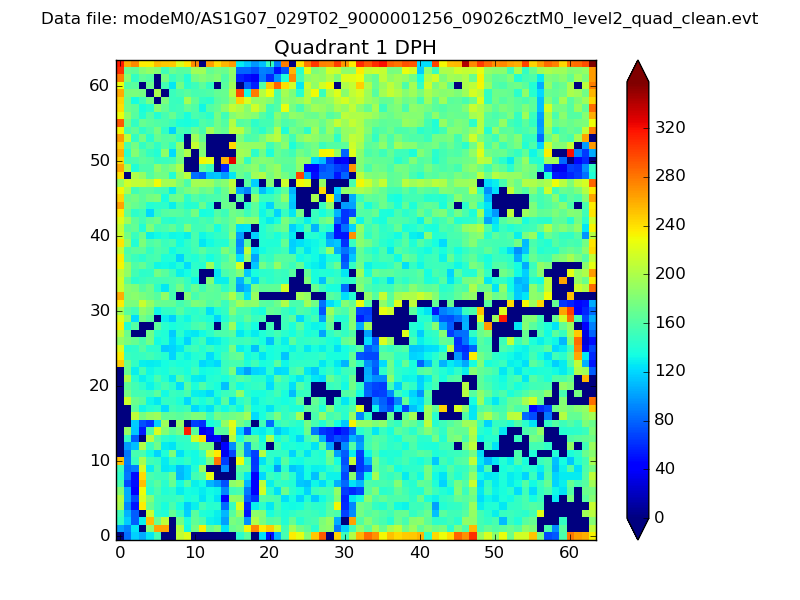
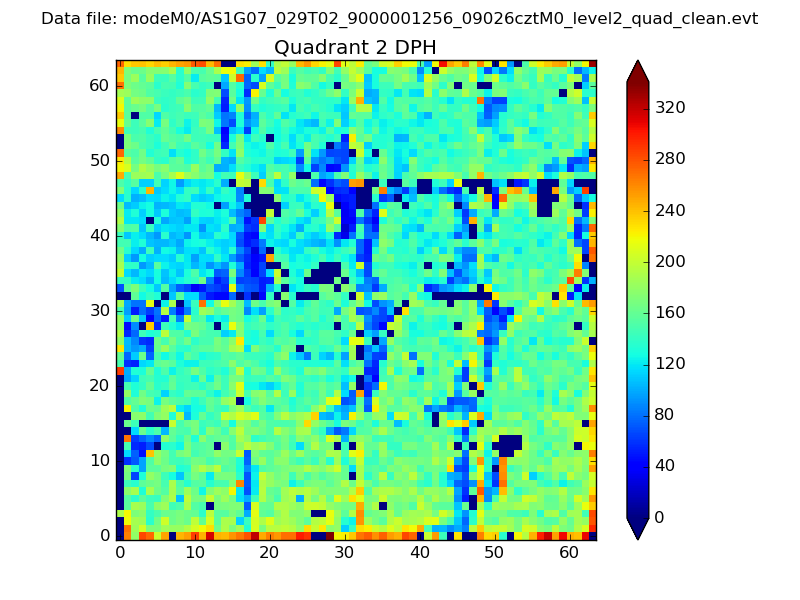
Histogram calculated using DETX and DETY for each event in the final _common_clean file
| Quadrant A |  |
 |
Quadrant B |
|---|---|---|---|
| Quadrant D | 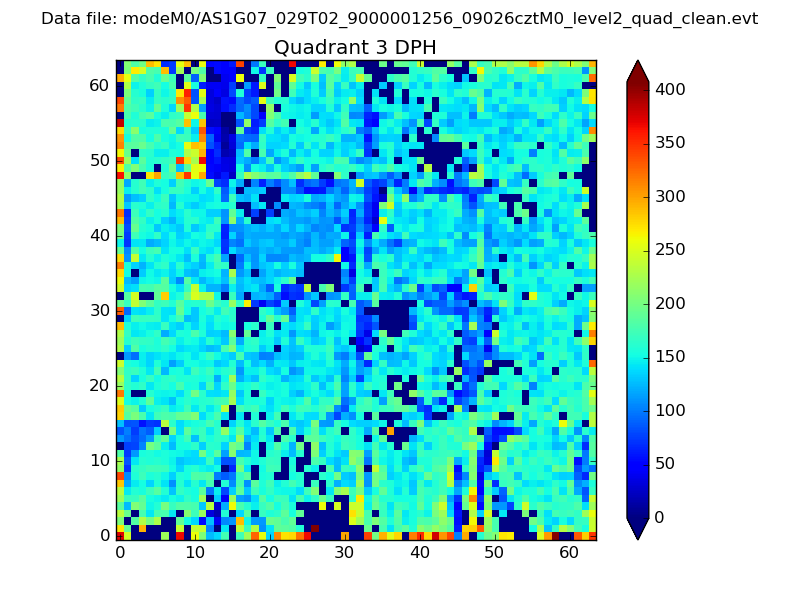 |
 |
Quadrant C |
| Plot type | Count rate plots | Images |
|---|---|---|
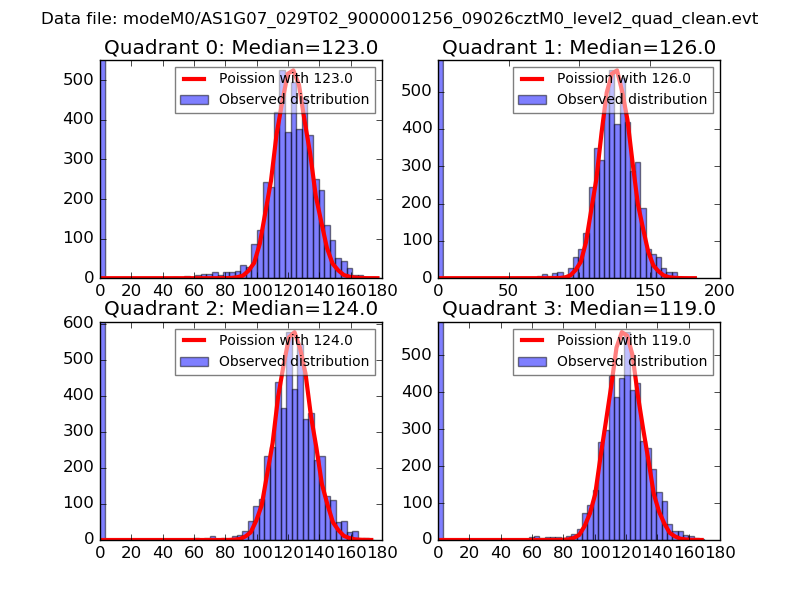
| Comparison with Poisson distribution Blue bars denote a histogram of data divided into 1 sec bins. Red curve is a Poisson curve with rate = median count rate of data. |
 |
 |
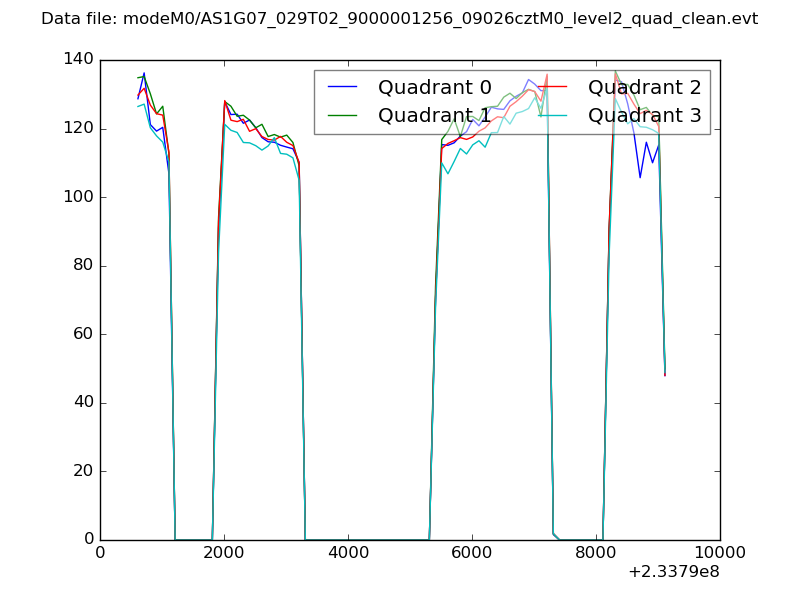
| Quadrant-wise count rates Data is divided into 100 sec bins |
 |
|
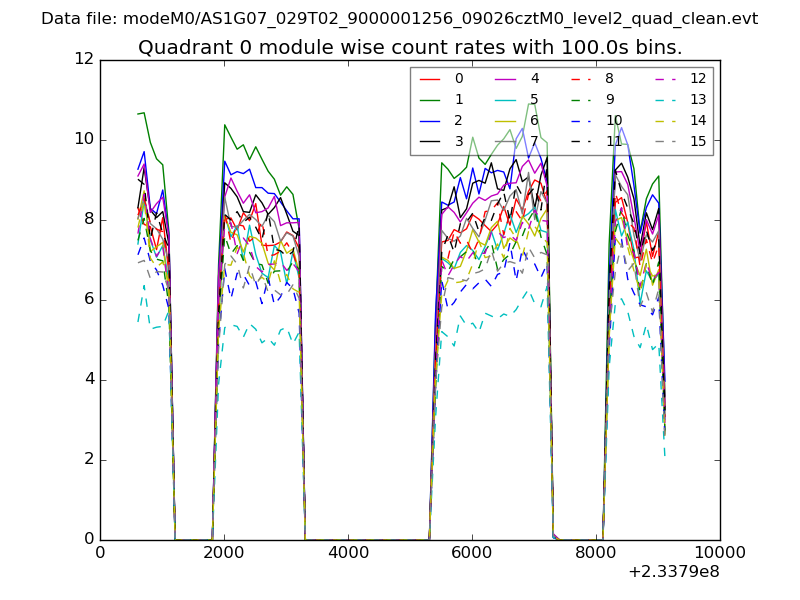
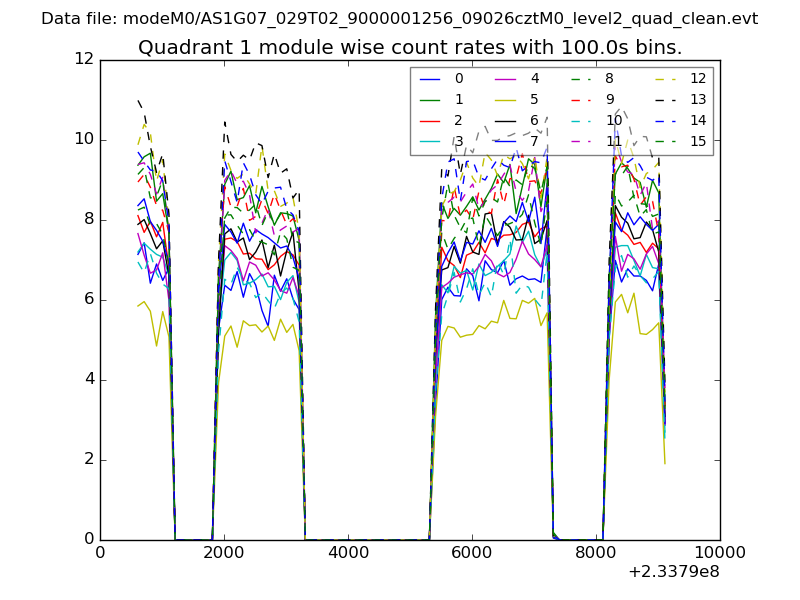
| Module-wise count rates for Quadrant A Data is divided into 100 sec bins |
 |
 |
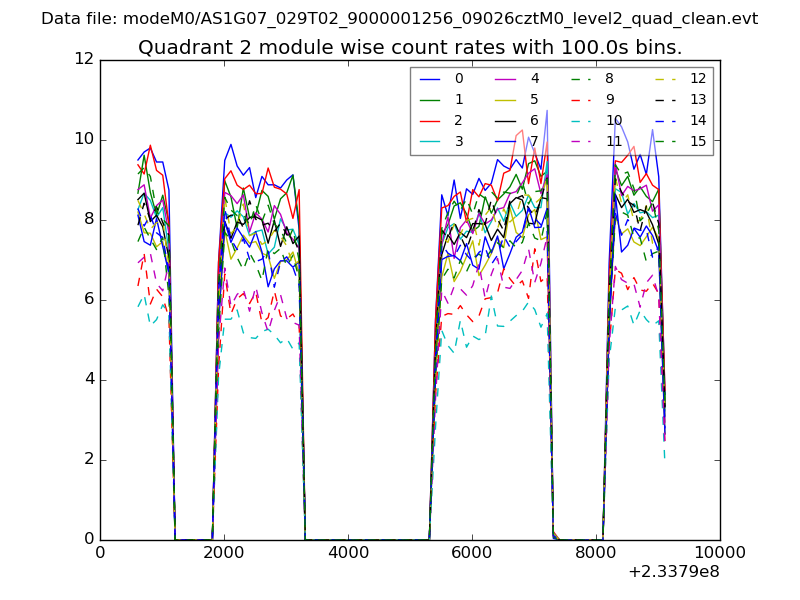
| Module-wise count rates for Quadrant B Data is divided into 100 sec bins |
 |
 |
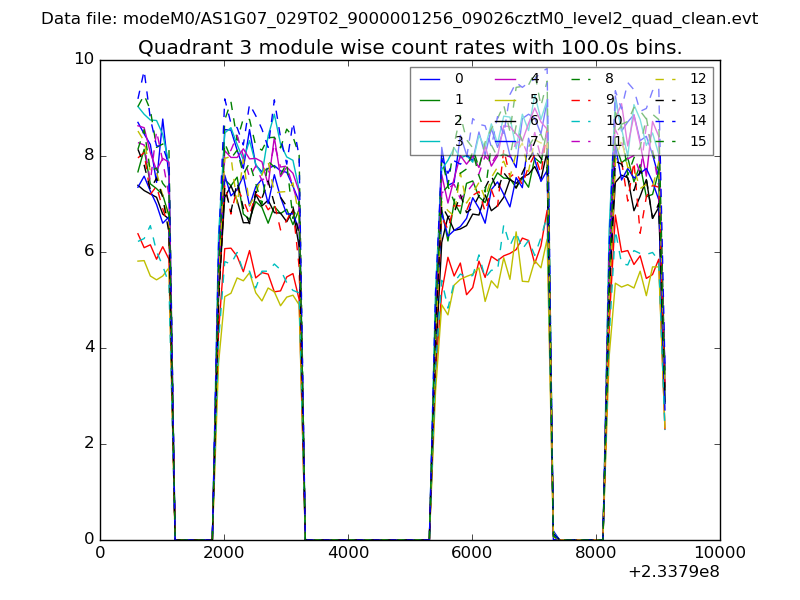
| Module-wise count rates for Quadrant C Data is divided into 100 sec bins |
 |
 |
| Module-wise count rates for Quadrant D Data is divided into 100 sec bins |
 |
 |
| Parameter | Plot |
|---|---|
| CZT HV Monitor | 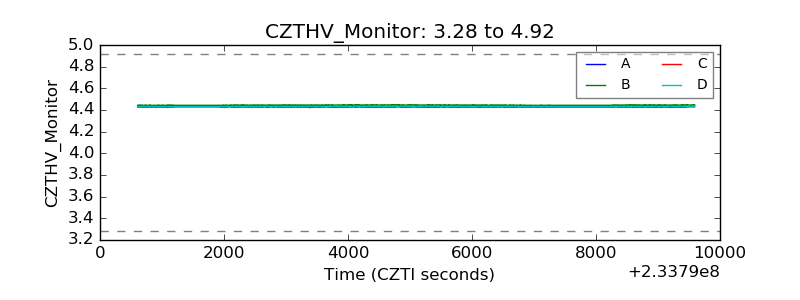 |
| D_VDD | 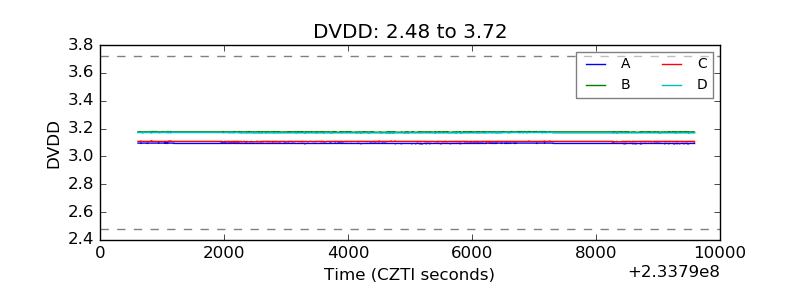 |
| Temperature 1 | 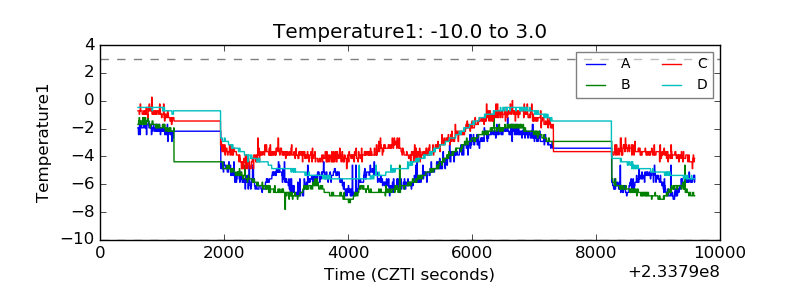 |
| Veto HV Monitor | 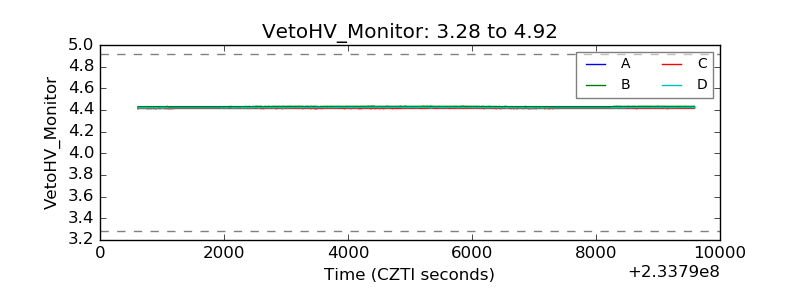 |
| Veto LLD | 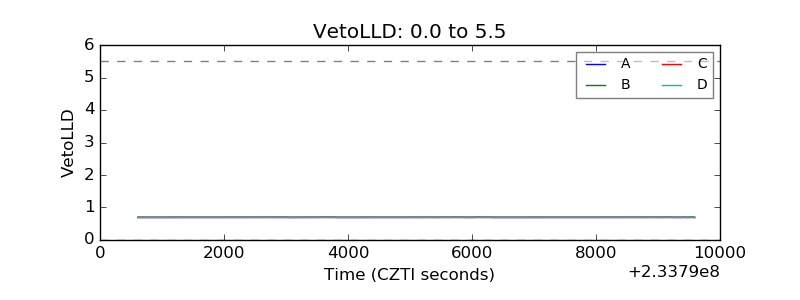 |
| Alpha Counter | 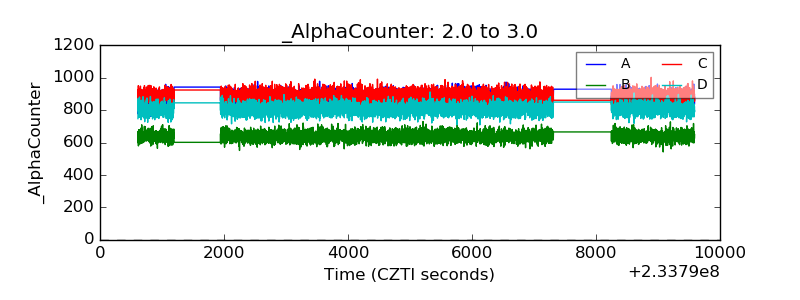 |
| _CPM_Rate | 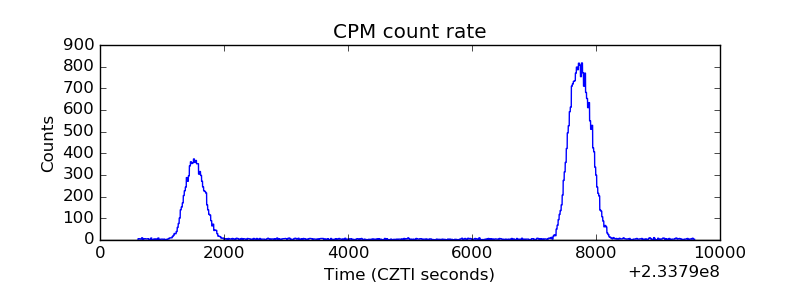 |
| CZT Counter | 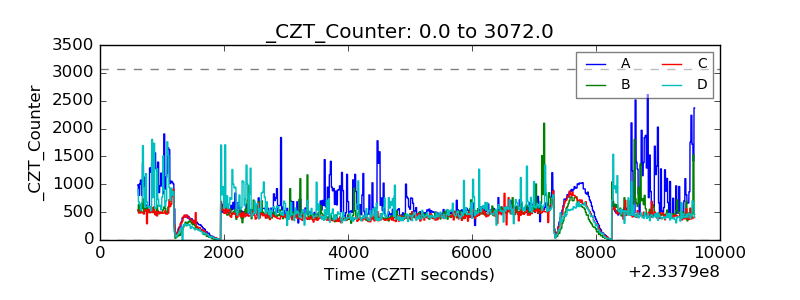 |
| +2.5 Volts monitor |  |
| +5 Volts monitor |  |
| _ROLL_ROT | 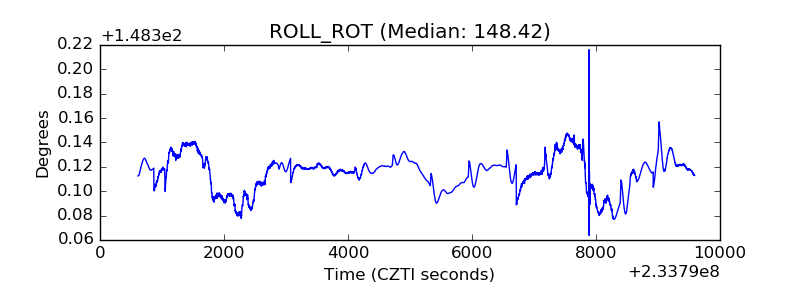 |
| _Roll_DEC | 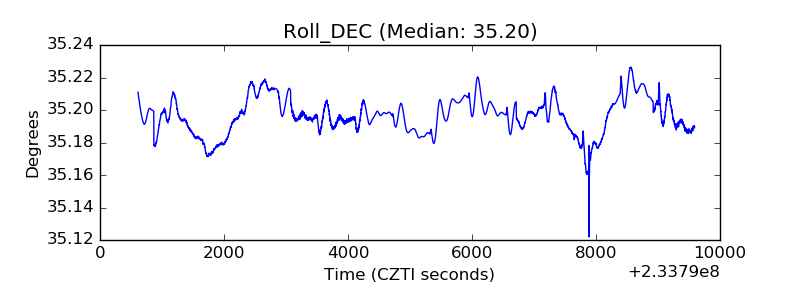 |
| _Roll_RA | 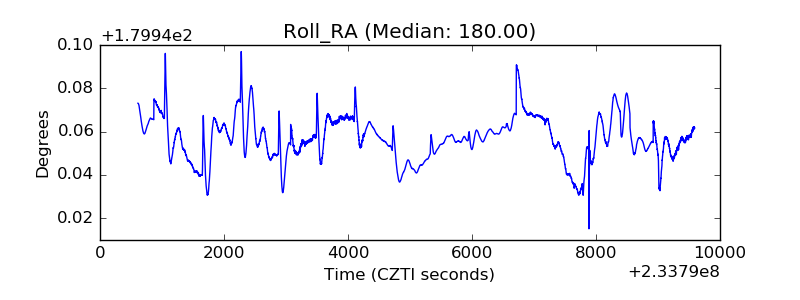 |
| Veto Counter | 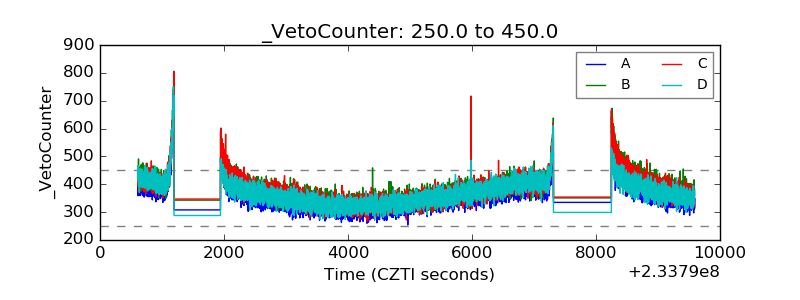 |