| Param | Original file | Final file |
|---|---|---|
| Filename | modeM0/AS1G07_029T02_9000001256_09029cztM0_level2.evt | modeM0/AS1G07_029T02_9000001256_09029cztM0_level2_quad_clean.evt |
| Size (bytes) | 552,421,440 | 65,880,000 |
| Size | 526.8 MB | 62.8 MB |
| Events in quadrant A | 6,272,762 | 379,546 |
| Events in quadrant B | 3,367,459 | 396,207 |
| Events in quadrant C | 3,046,096 | 386,697 |
| Events in quadrant D | 3,596,757 | 372,206 |
| Mode SS | |||
|---|---|---|---|
| Quadrant | BADHDUFLAG | Total packets | Discarded packets |
| A | 0 | 134 | 0 |
| B | 0 | 134 | 0 |
| C | 0 | 134 | 0 |
| D | 0 | 134 | 0 |
| Mode M9 | |||
|---|---|---|---|
| Quadrant | BADHDUFLAG | Total packets | Discarded packets |
| A | 0 | 15 | 0 |
| B | 0 | 15 | 0 |
| C | 0 | 15 | 0 |
| D | 0 | 16 | 0 |
| Mode M0 | |||
|---|---|---|---|
| Quadrant | BADHDUFLAG | Total packets | Discarded packets |
| A | 0 | 23060 | 3 |
| B | 0 | 14108 | 2 |
| C | 0 | 13456 | 2 |
| D | 0 | 15242 | 2 |
| Quadrant | Total seconds | Saturated seconds | Saturation percentage |
|---|---|---|---|
| A | 6596 | 516 | 7.822923% |
| B | 6596 | 46 | 0.697392% |
| C | 6596 | 16 | 0.242571% |
| D | 6596 | 134 | 2.031534% |
Noise dominated data is calculated using 1-second bins in cleaned event files. If a bin has >2000 counts, and if more than 50% of those come from <1% of pixels, then it is considered to be noise-dominated and hence unusable.
| Quadrant | # 1 sec bins | Bins with >0 counts | Bins with >2000 counts | High rate bins dominated by noise | Noise dominated (total time) | Noise dominated (detector-on time) | Marked lightcurve |
|---|---|---|---|---|---|---|---|
| A | 7766 | 6596 | 418 | 418 | 5.38% | 6.34% | 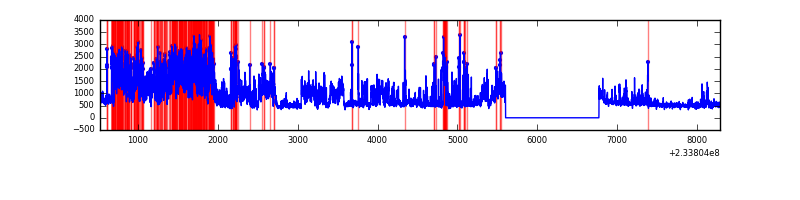 |
| B | 7766 | 6597 | 8 | 8 | 0.10% | 0.12% | 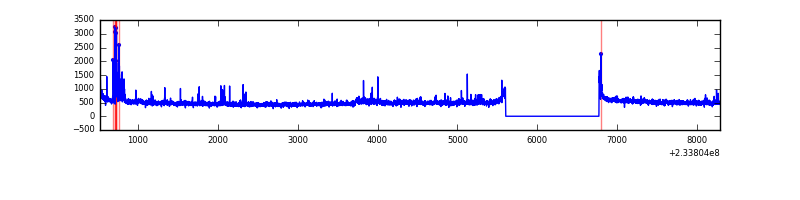 |
| C | 7766 | 6597 | 0 | 0 | 0.00% | 0.00% | 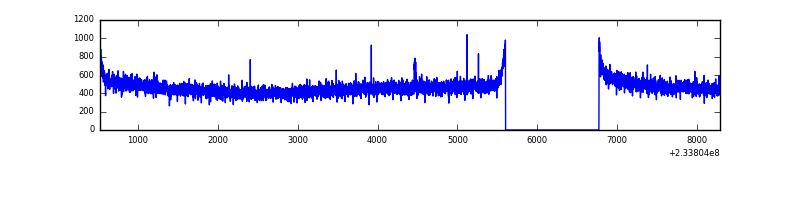 |
| D | 7766 | 6597 | 103 | 103 | 1.33% | 1.56% | 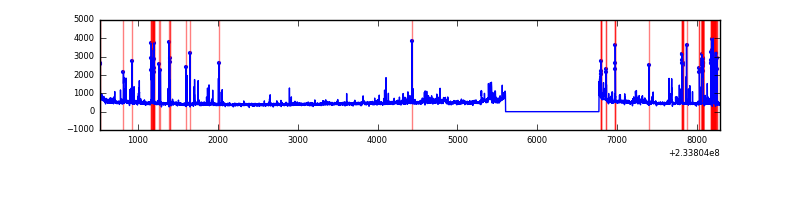 |
Top three noisy pixels from each quadrant. If the there are fewer than three noisy pixels in the level2.evt file, extra rows are filled as -1
| Pixel properties | Quadrant properties | ||||||
|---|---|---|---|---|---|---|---|
| Quadrant | DetID | PixID | Counts | Sigma | Mean | Median | Sigma |
| A | 8 | 5 | 3136418 | 19463.76 | 794 | 776 | 161.1 |
| A | 1 | 162 | 48790 | 298.04 | 794 | 776 | 161.1 |
| A | 1 | 178 | 10642 | 61.24 | 794 | 776 | 161.1 |
| B | 4 | 48 | 124483 | 804.68 | 813 | 796 | 153.7 |
| B | 0 | 187 | 25218 | 158.88 | 813 | 796 | 153.7 |
| B | 0 | 214 | 20291 | 126.83 | 813 | 796 | 153.7 |
| C | 14 | 67 | 8143 | 40.84 | 779 | 784 | 180.2 |
| C | 13 | 61 | 5958 | 28.71 | 779 | 784 | 180.2 |
| C | 3 | 202 | 1921 | 6.31 | 779 | 784 | 180.2 |
| D | 1 | 52 | 368532 | 1957.02 | 765 | 748 | 187.9 |
| D | 2 | 14 | 147302 | 779.83 | 765 | 748 | 187.9 |
| D | 6 | 225 | 87839 | 463.42 | 765 | 748 | 187.9 |
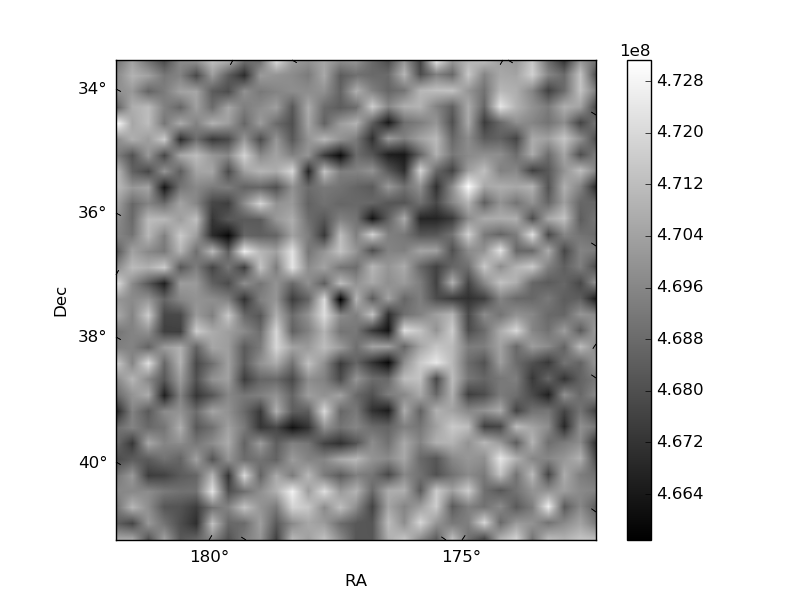
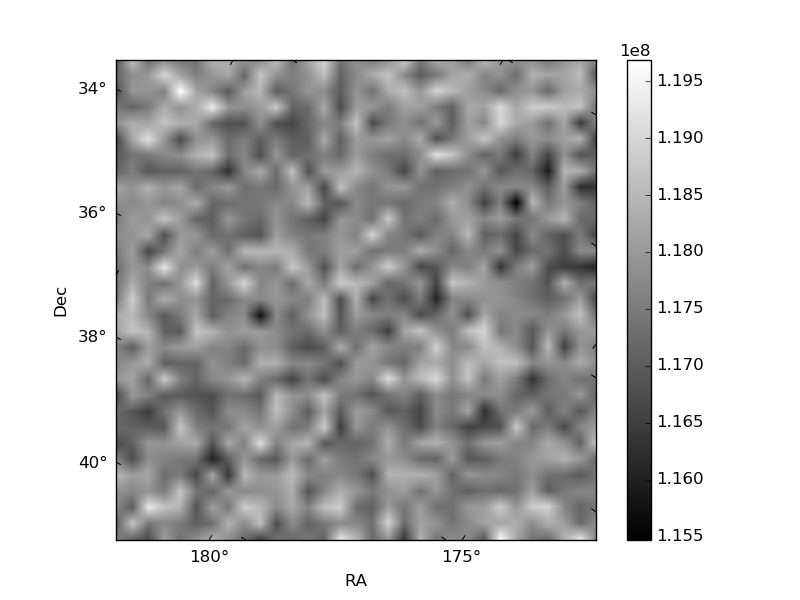
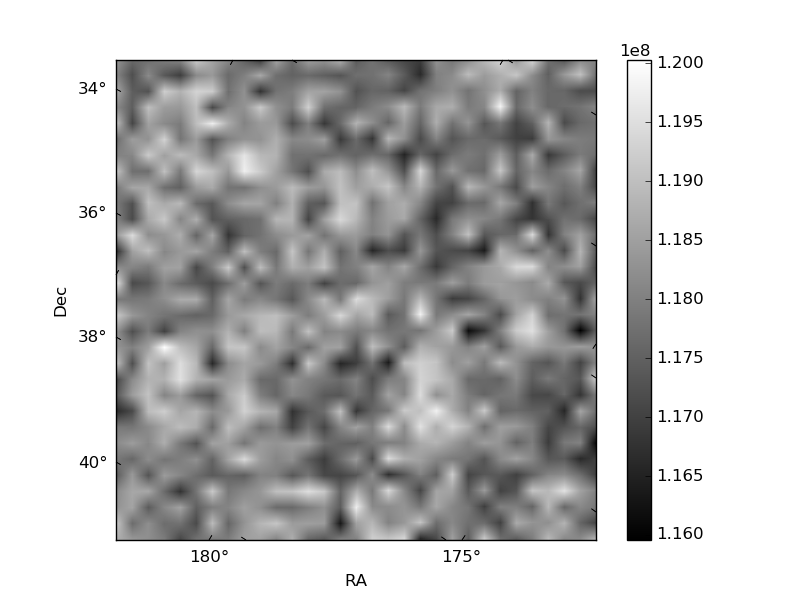
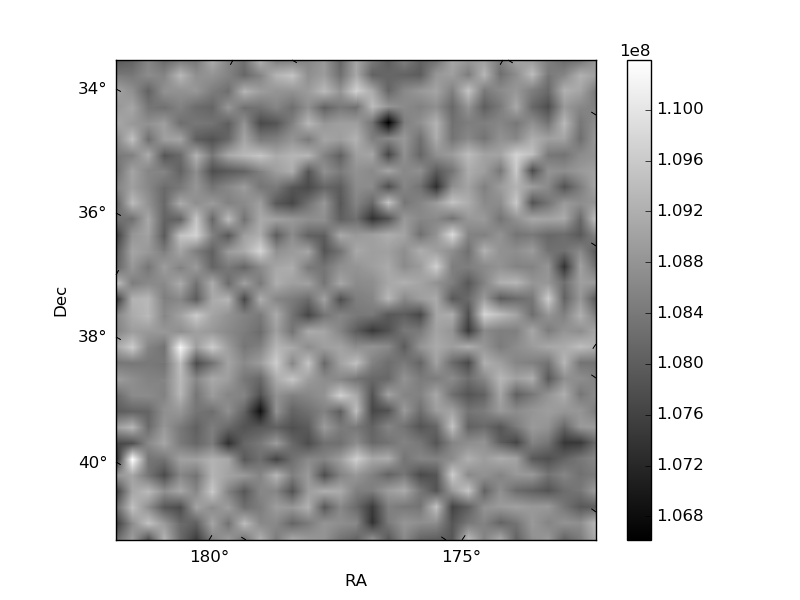
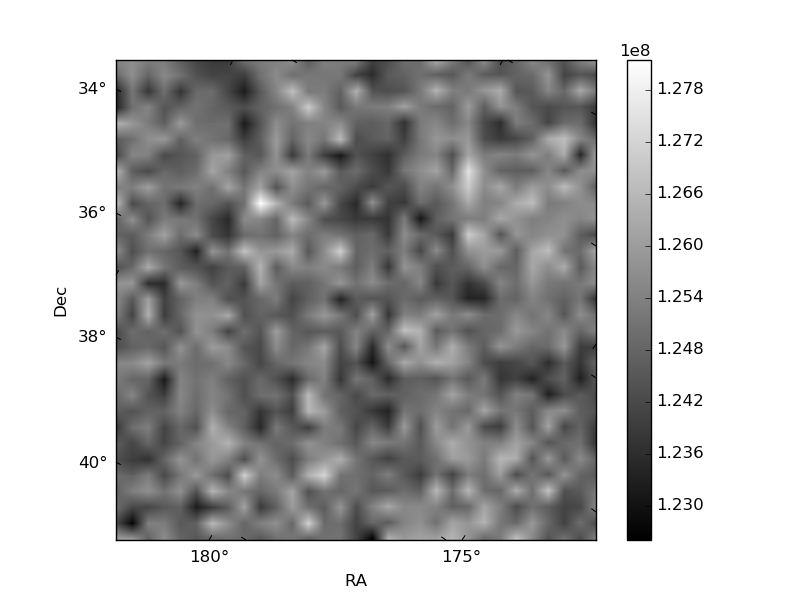
Histogram calculated using DETX and DETY for each event in the final _common_clean file
| Quadrant A | 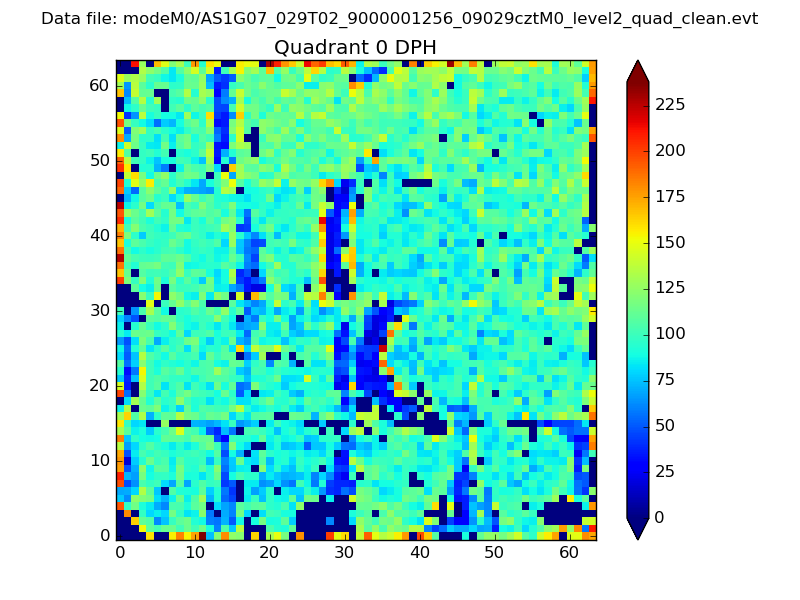 |
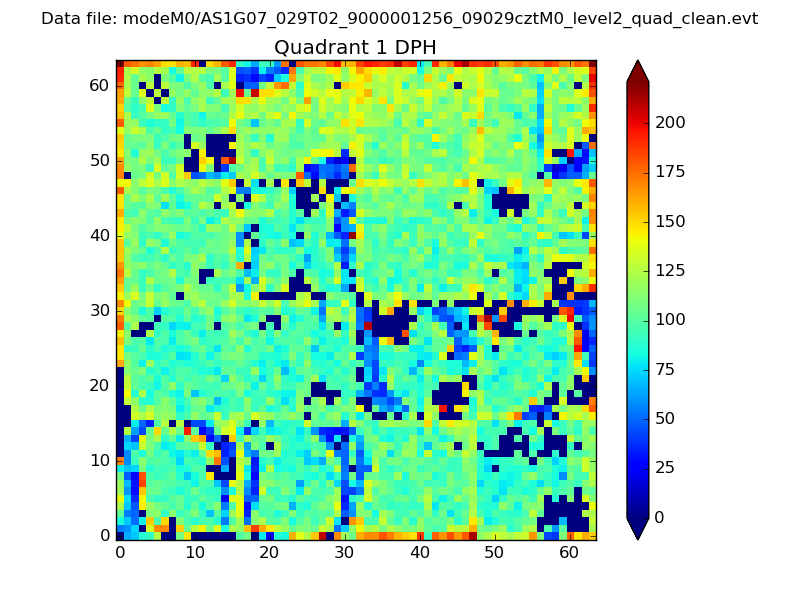 |
Quadrant B |
|---|---|---|---|
| Quadrant D | 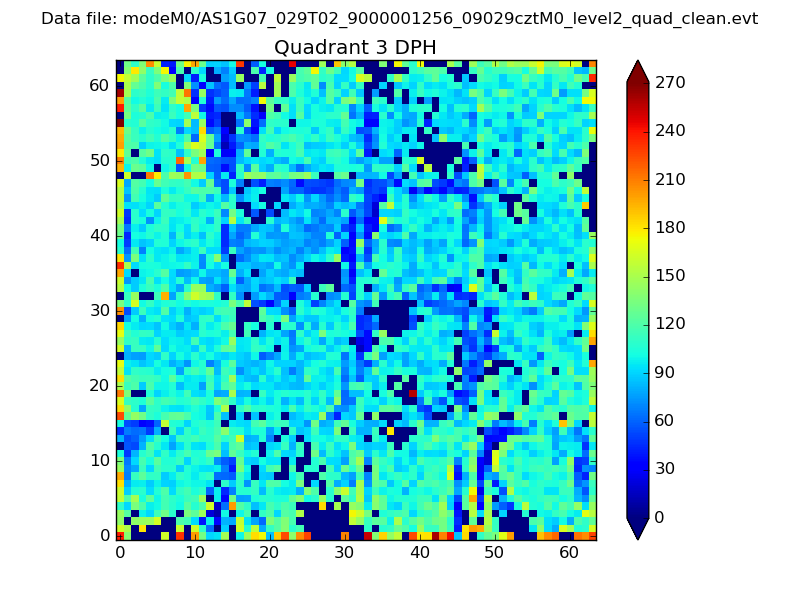 |
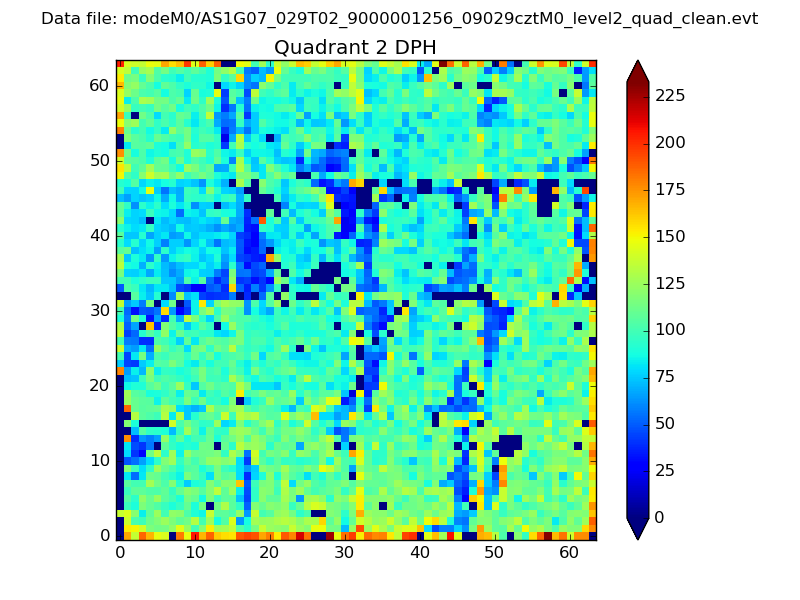 |
Quadrant C |
| Plot type | Count rate plots | Images |
|---|---|---|
| Comparison with Poisson distribution Blue bars denote a histogram of data divided into 1 sec bins. Red curve is a Poisson curve with rate = median count rate of data. |
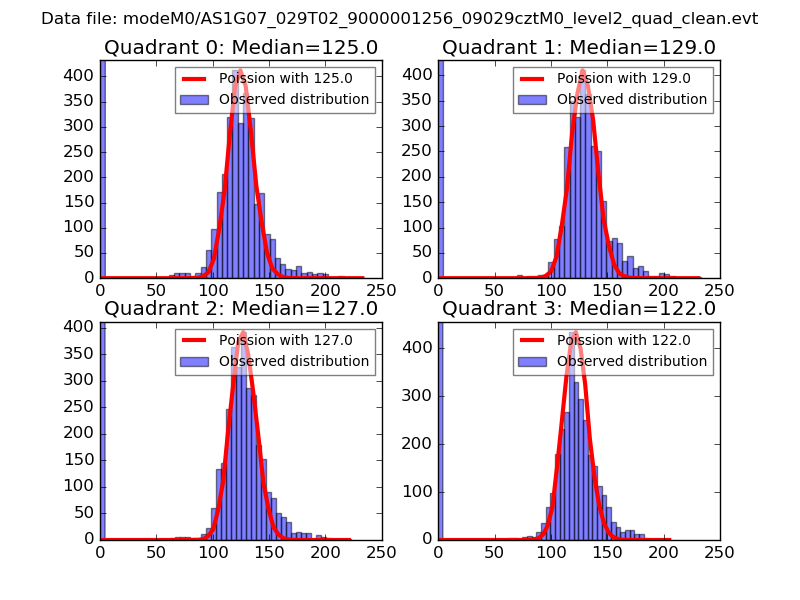 |
 |
| Quadrant-wise count rates Data is divided into 100 sec bins |
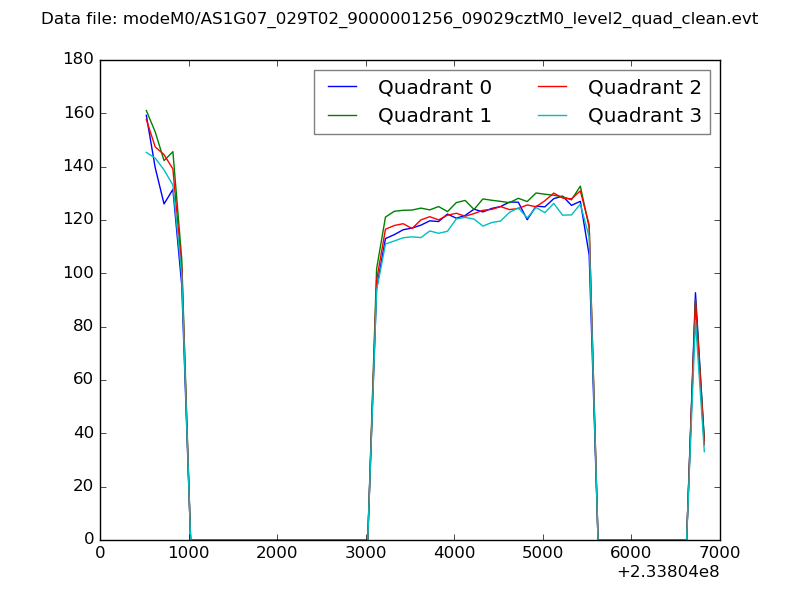 |
|
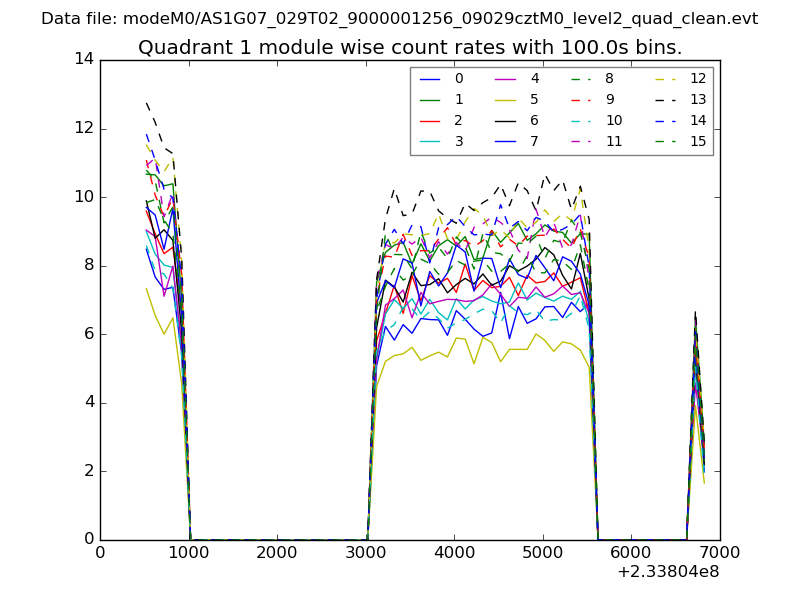
| Module-wise count rates for Quadrant A Data is divided into 100 sec bins |
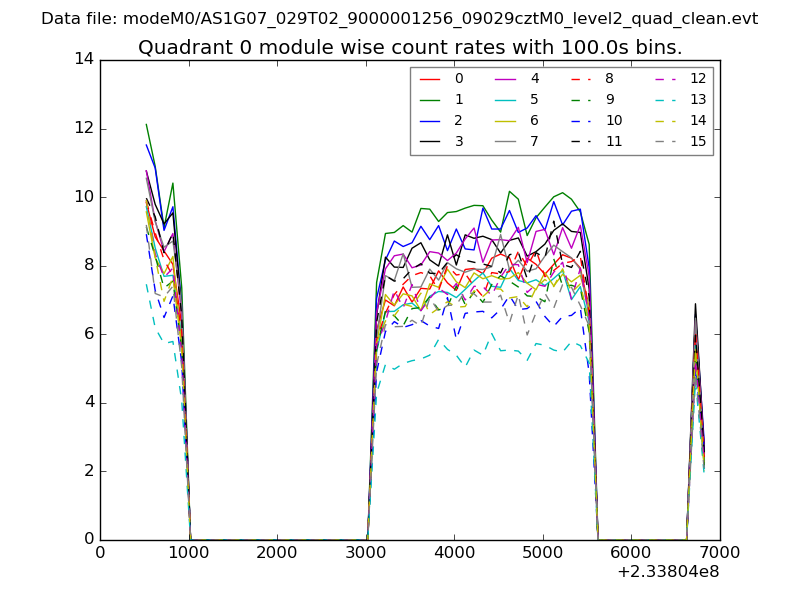 |
 |
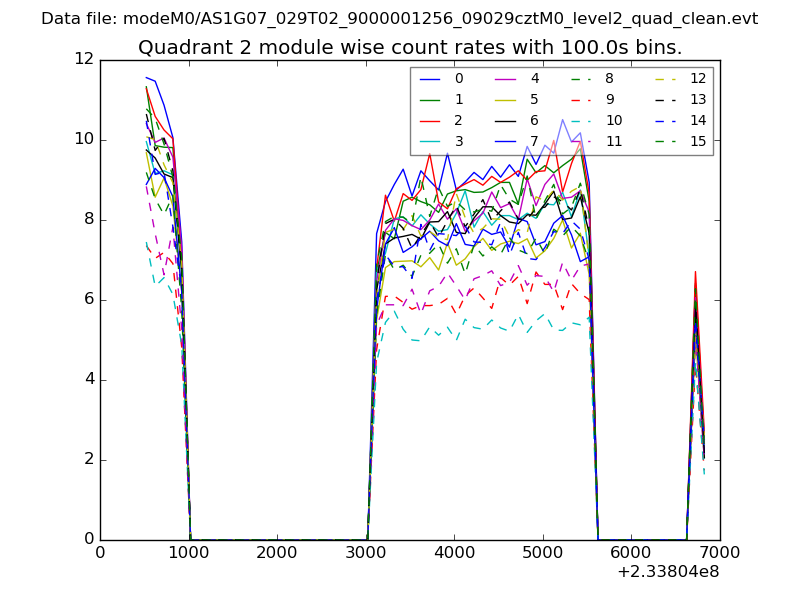
| Module-wise count rates for Quadrant B Data is divided into 100 sec bins |
 |
 |
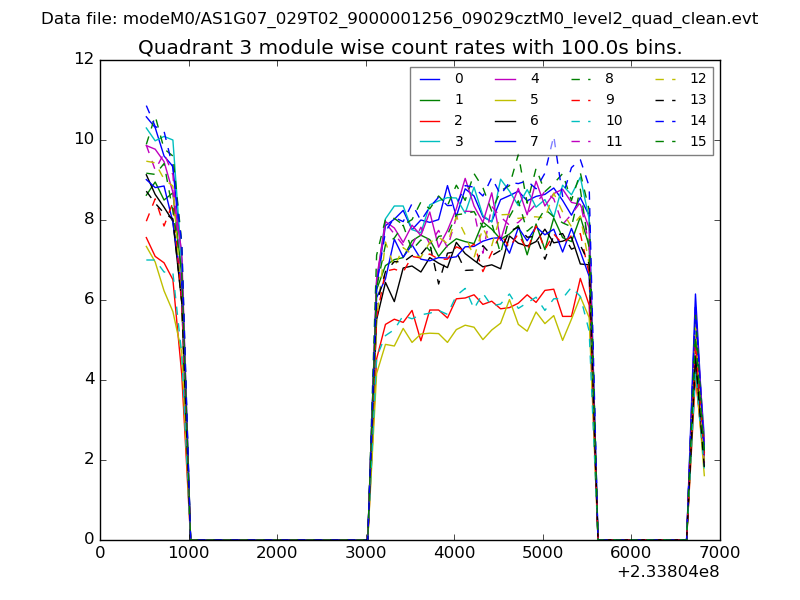
| Module-wise count rates for Quadrant C Data is divided into 100 sec bins |
 |
 |
| Module-wise count rates for Quadrant D Data is divided into 100 sec bins |
 |
 |
| Parameter | Plot |
|---|---|
| CZT HV Monitor | 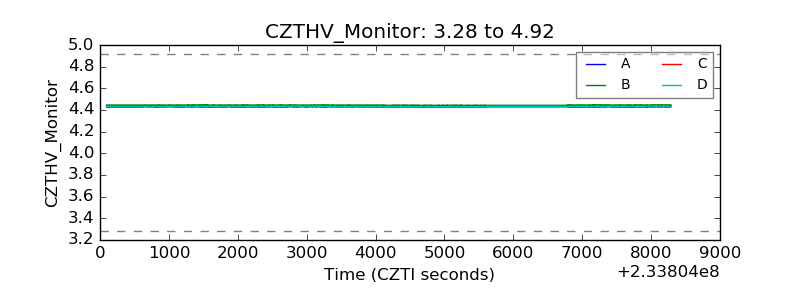 |
| D_VDD | 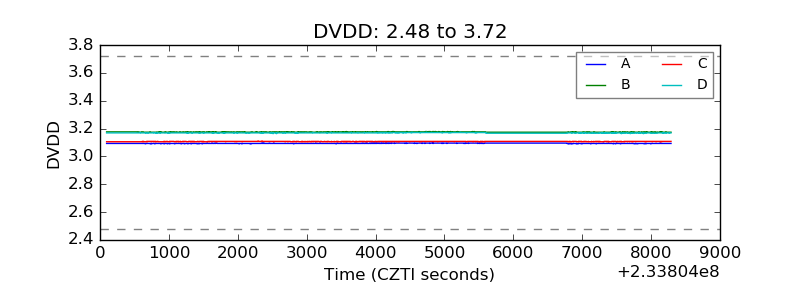 |
| Temperature 1 | 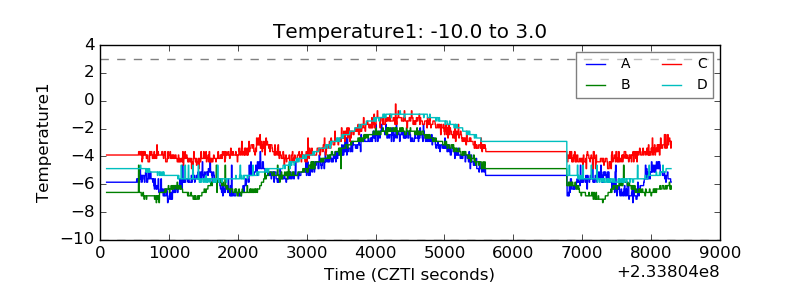 |
| Veto HV Monitor | 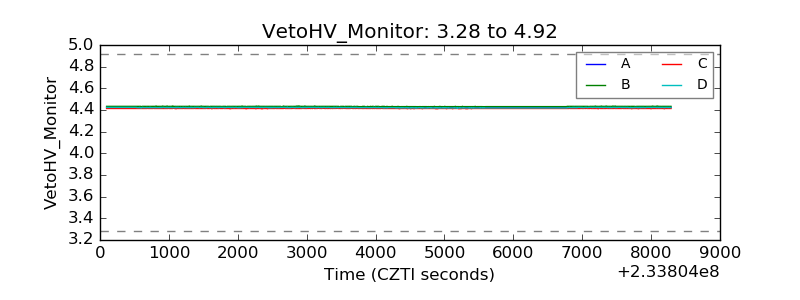 |
| Veto LLD | 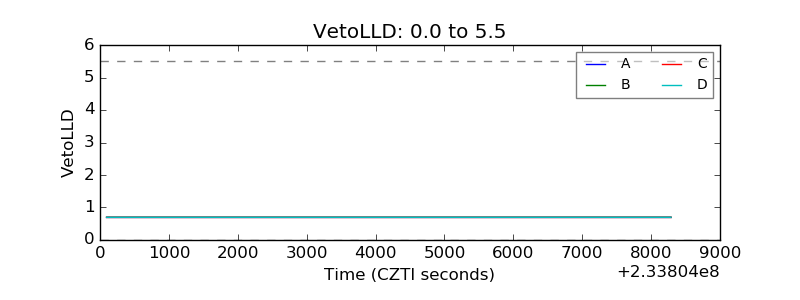 |
| Alpha Counter | 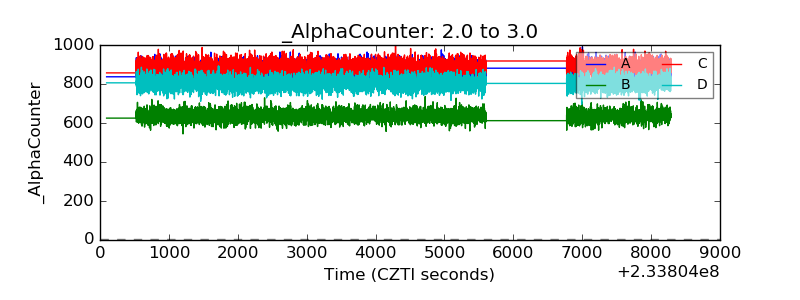 |
| _CPM_Rate | 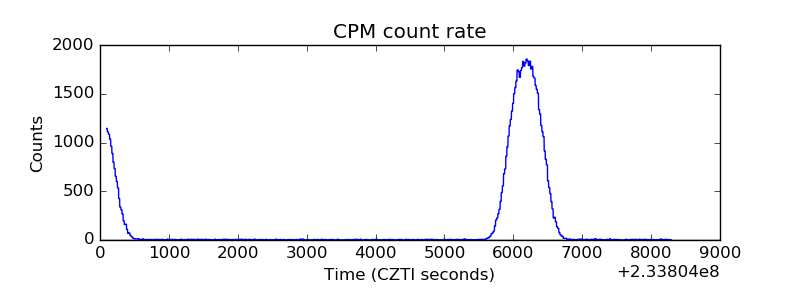 |
| CZT Counter | 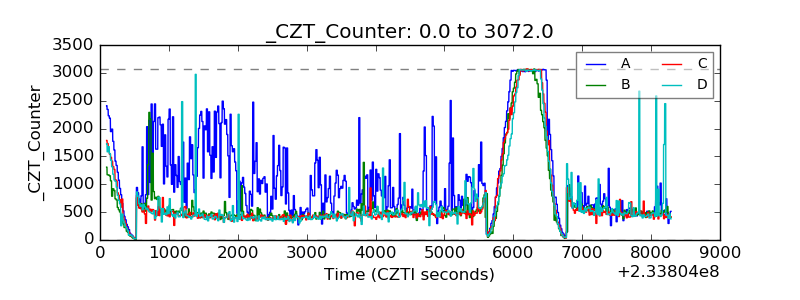 |
| +2.5 Volts monitor |  |
| +5 Volts monitor |  |
| _ROLL_ROT | 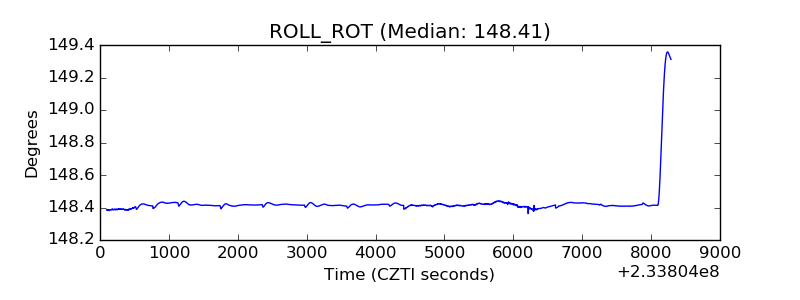 |
| _Roll_DEC | 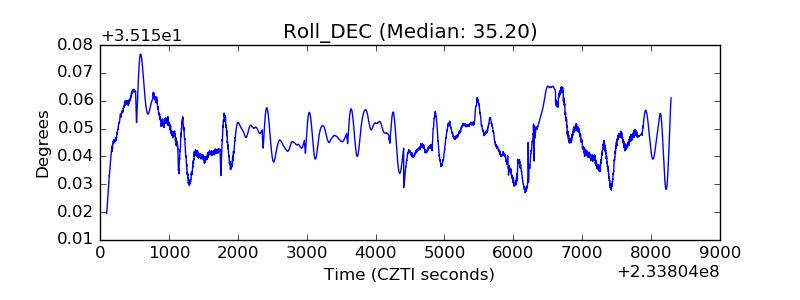 |
| _Roll_RA | 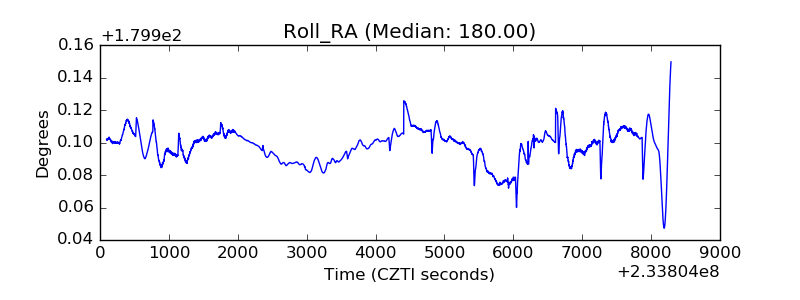 |
| Veto Counter | 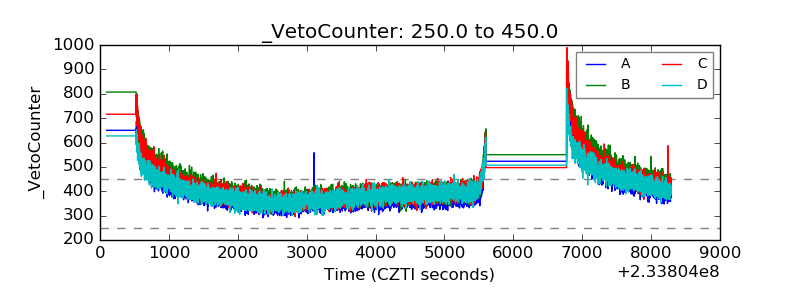 |