| Param | Original file | Final file |
|---|---|---|
| Filename | modeM0/AS1G07_029T02_9000001256_09031cztM0_level2.evt | modeM0/AS1G07_029T02_9000001256_09031cztM0_level2_quad_clean.evt |
| Size (bytes) | 627,891,840 | 65,695,680 |
| Size | 598.8 MB | 62.7 MB |
| Events in quadrant A | 3,723,771 | 416,284 |
| Events in quadrant B | 3,179,627 | 423,111 |
| Events in quadrant C | 2,910,457 | 410,937 |
| Events in quadrant D | 8,796,839 | 320,401 |
| Mode SS | |||
|---|---|---|---|
| Quadrant | BADHDUFLAG | Total packets | Discarded packets |
| A | 0 | 120 | 0 |
| B | 0 | 120 | 0 |
| C | 0 | 120 | 0 |
| D | 0 | 120 | 0 |
| Mode M9 | |||
|---|---|---|---|
| Quadrant | BADHDUFLAG | Total packets | Discarded packets |
| A | 0 | 13 | 0 |
| B | 0 | 13 | 0 |
| C | 0 | 13 | 0 |
| D | 0 | 13 | 0 |
| Mode M0 | |||
|---|---|---|---|
| Quadrant | BADHDUFLAG | Total packets | Discarded packets |
| A | 0 | 14785 | 2 |
| B | 0 | 12951 | 1 |
| C | 0 | 12346 | 1 |
| D | 0 | 30192 | 1 |
| Quadrant | Total seconds | Saturated seconds | Saturation percentage |
|---|---|---|---|
| A | 5987 | 138 | 2.304994% |
| B | 5987 | 97 | 1.620177% |
| C | 5987 | 45 | 0.751629% |
| D | 5987 | 2237 | 37.364289% |
Noise dominated data is calculated using 1-second bins in cleaned event files. If a bin has >2000 counts, and if more than 50% of those come from <1% of pixels, then it is considered to be noise-dominated and hence unusable.
| Quadrant | # 1 sec bins | Bins with >0 counts | Bins with >2000 counts | High rate bins dominated by noise | Noise dominated (total time) | Noise dominated (detector-on time) | Marked lightcurve |
|---|---|---|---|---|---|---|---|
| A | 7262 | 5987 | 37 | 37 | 0.51% | 0.62% | 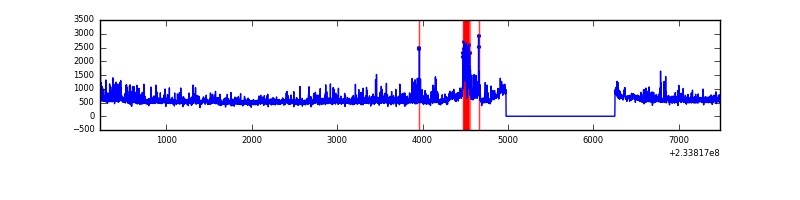 |
| B | 7262 | 5987 | 5 | 5 | 0.07% | 0.08% | 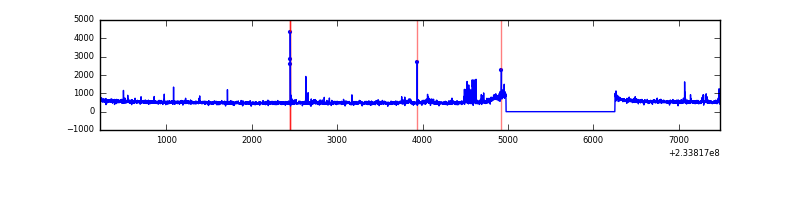 |
| C | 7262 | 5988 | 0 | 0 | 0.00% | 0.00% | 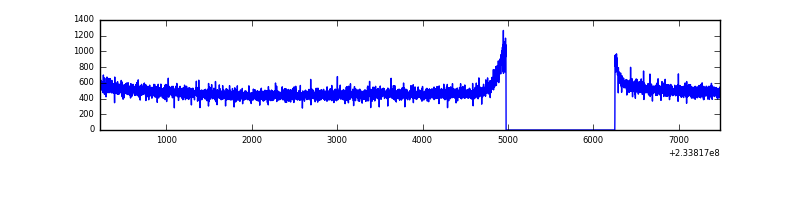 |
| D | 7262 | 5987 | 2036 | 2036 | 28.04% | 34.01% | 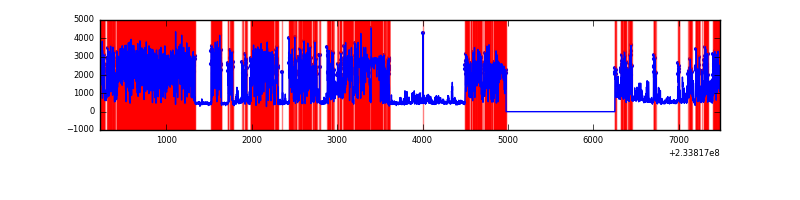 |
Top three noisy pixels from each quadrant. If the there are fewer than three noisy pixels in the level2.evt file, extra rows are filled as -1
| Pixel properties | Quadrant properties | ||||||
|---|---|---|---|---|---|---|---|
| Quadrant | DetID | PixID | Counts | Sigma | Mean | Median | Sigma |
| A | 8 | 5 | 561021 | 3566.25 | 780 | 765 | 157.1 |
| A | 1 | 162 | 88481 | 558.35 | 780 | 765 | 157.1 |
| A | 1 | 178 | 22791 | 140.2 | 780 | 765 | 157.1 |
| B | 4 | 48 | 61271 | 414.24 | 782 | 766 | 146.1 |
| B | 10 | 252 | 15911 | 103.69 | 782 | 766 | 146.1 |
| B | 12 | 111 | 15502 | 100.89 | 782 | 766 | 146.1 |
| C | 13 | 61 | 5657 | 28.5 | 746 | 750 | 172.2 |
| C | 3 | 202 | 1855 | 6.42 | 746 | 750 | 172.2 |
| C | -1 | -1 | -1 | -1.0 | 746 | 750 | 172.2 |
| D | 1 | 52 | 6050782 | 39330.56 | 635 | 621 | 153.8 |
| D | 6 | 225 | 253169 | 1641.75 | 635 | 621 | 153.8 |
| D | 13 | 122 | 21295 | 134.4 | 635 | 621 | 153.8 |
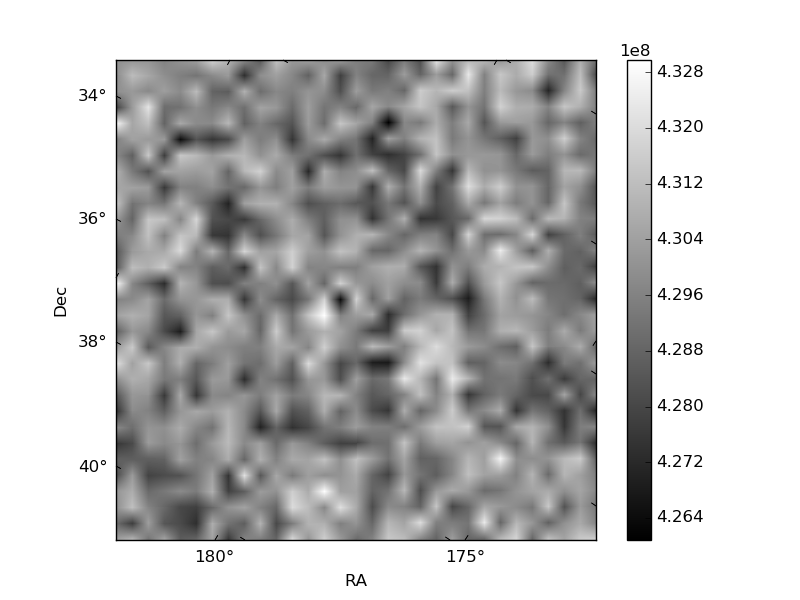
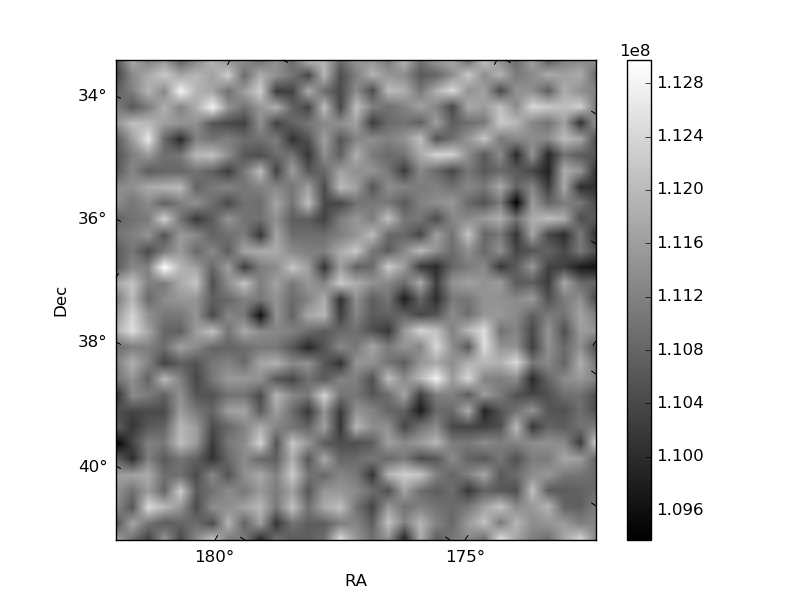
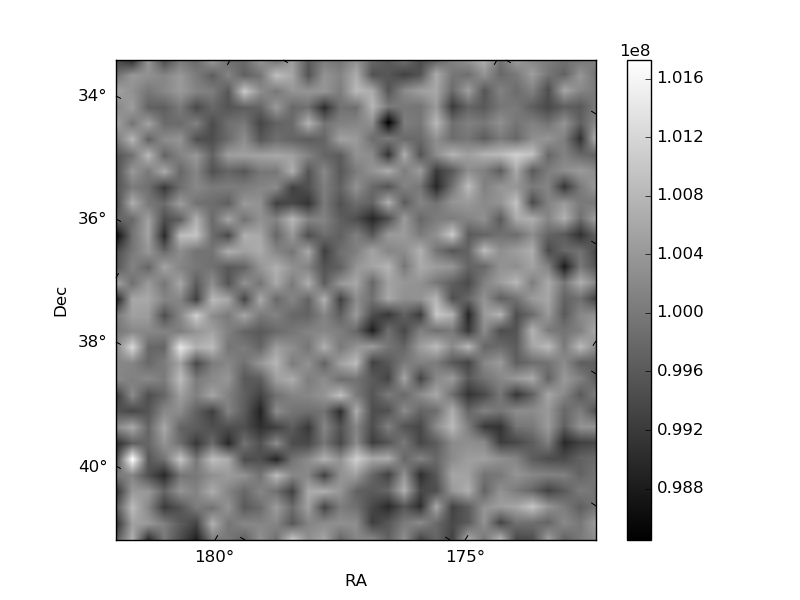
Histogram calculated using DETX and DETY for each event in the final _common_clean file
| Quadrant A | 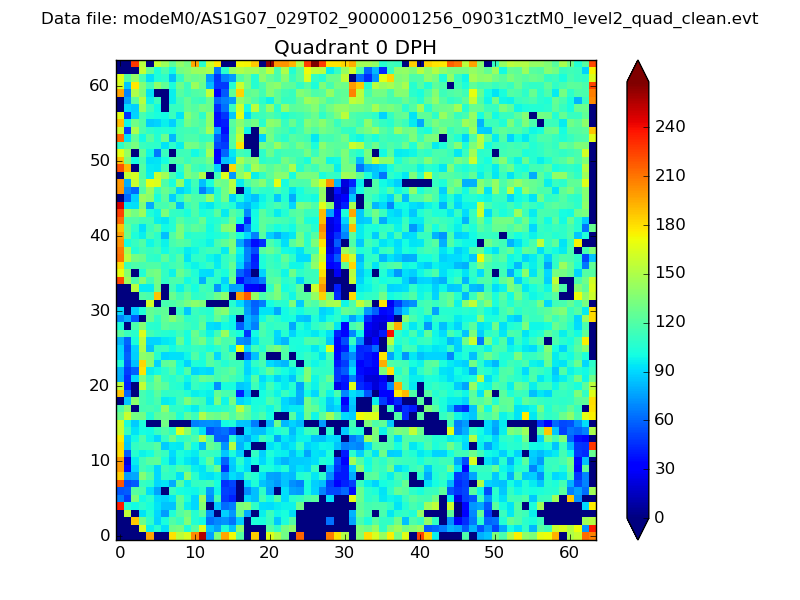 |
 |
Quadrant B |
|---|---|---|---|
| Quadrant D | 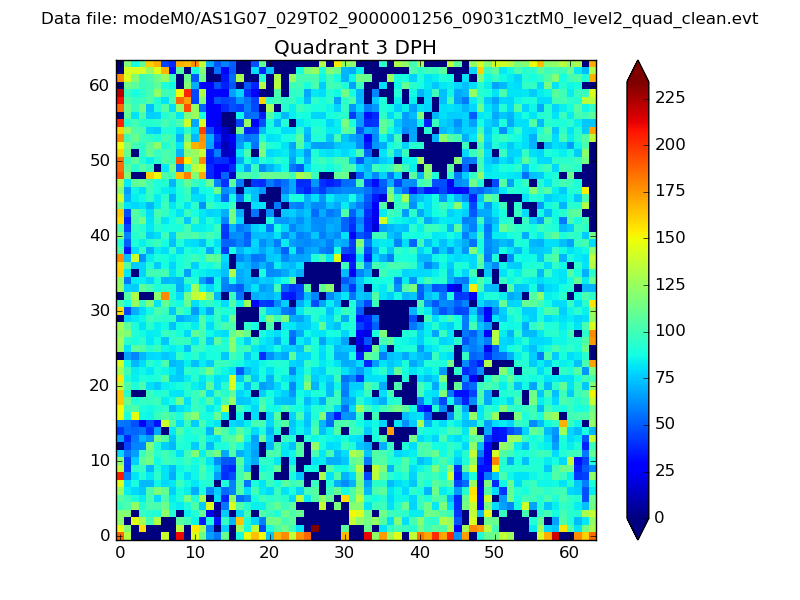 |
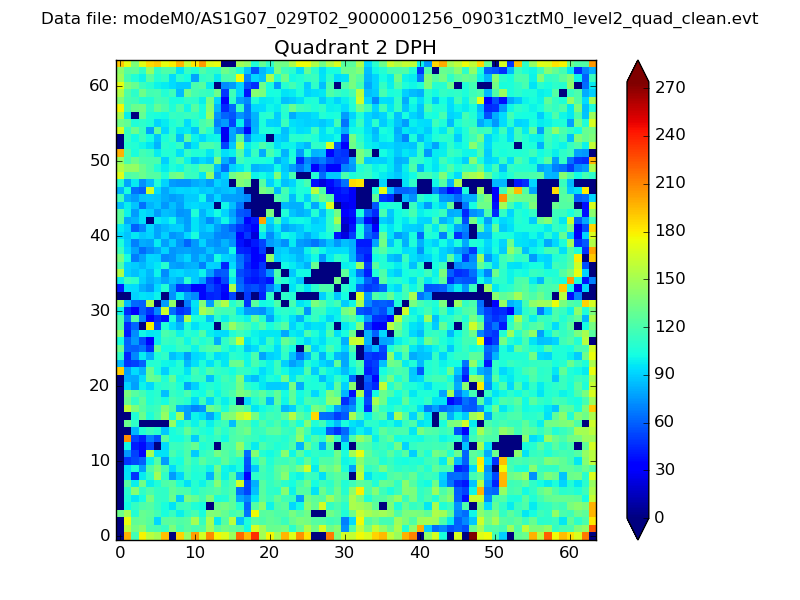 |
Quadrant C |
| Plot type | Count rate plots | Images |
|---|---|---|
| Comparison with Poisson distribution Blue bars denote a histogram of data divided into 1 sec bins. Red curve is a Poisson curve with rate = median count rate of data. |
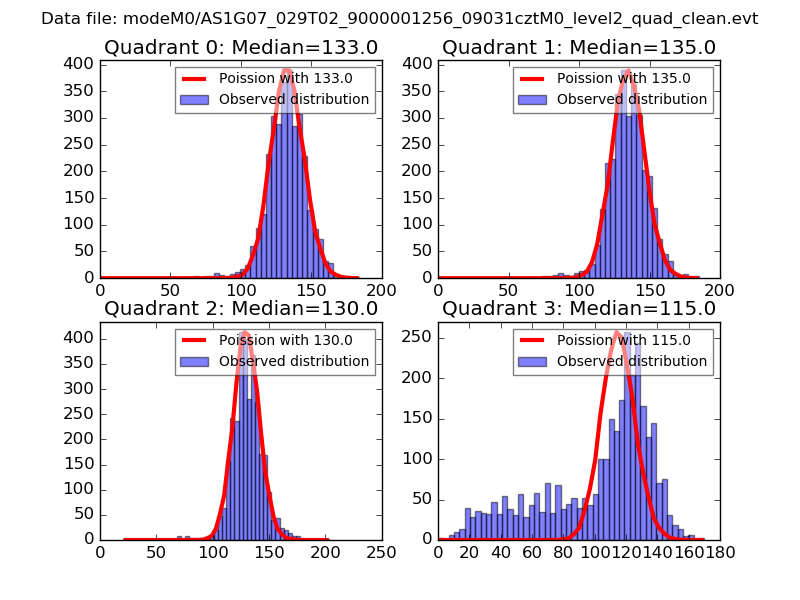 |
 |
| Quadrant-wise count rates Data is divided into 100 sec bins |
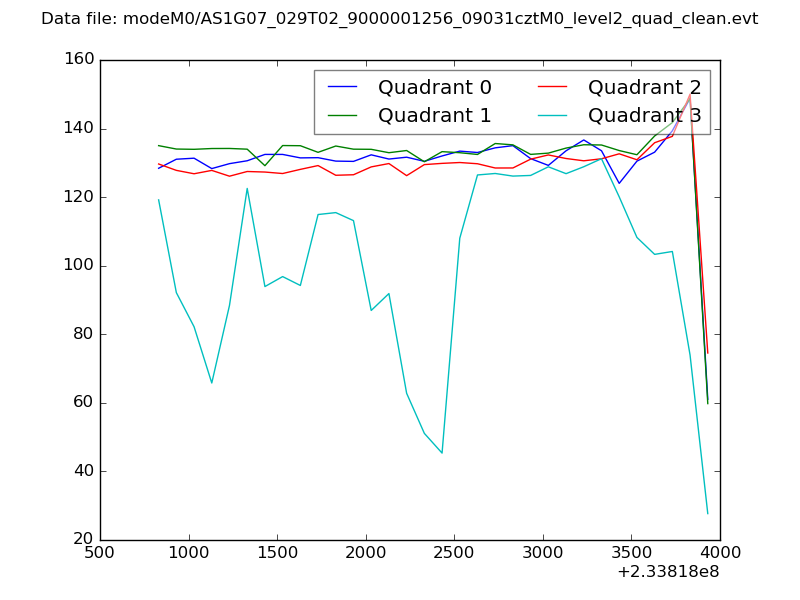 |
|
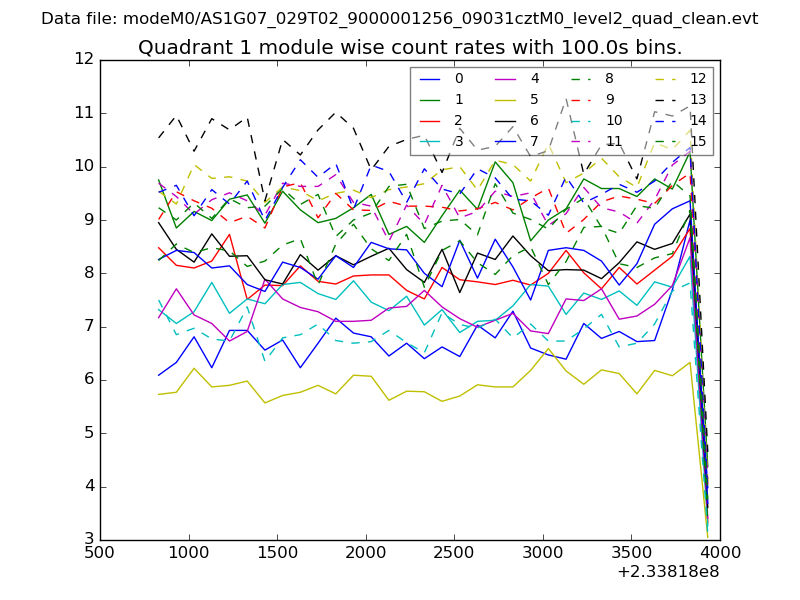
| Module-wise count rates for Quadrant A Data is divided into 100 sec bins |
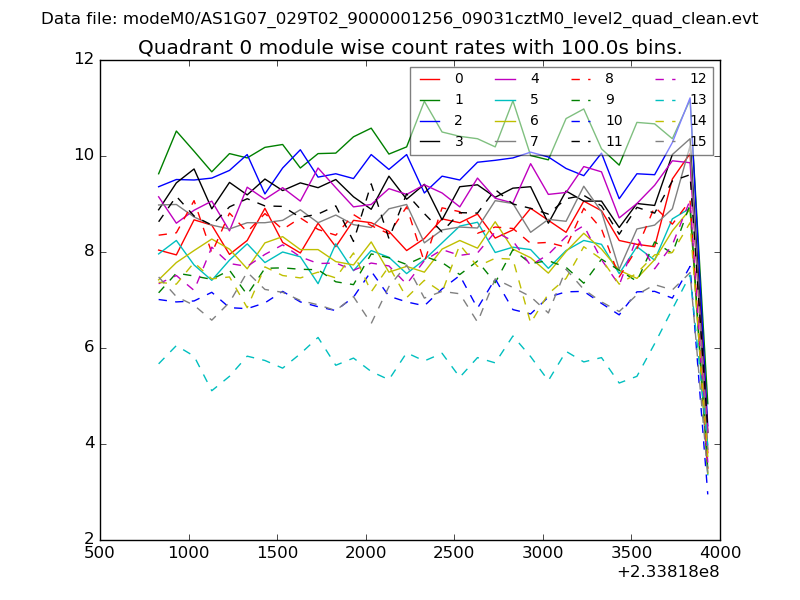 |
 |
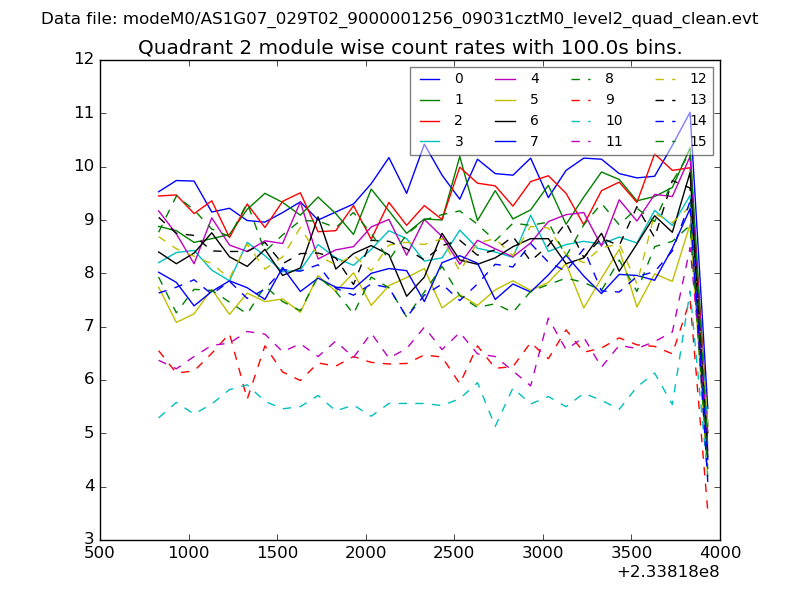
| Module-wise count rates for Quadrant B Data is divided into 100 sec bins |
 |
 |
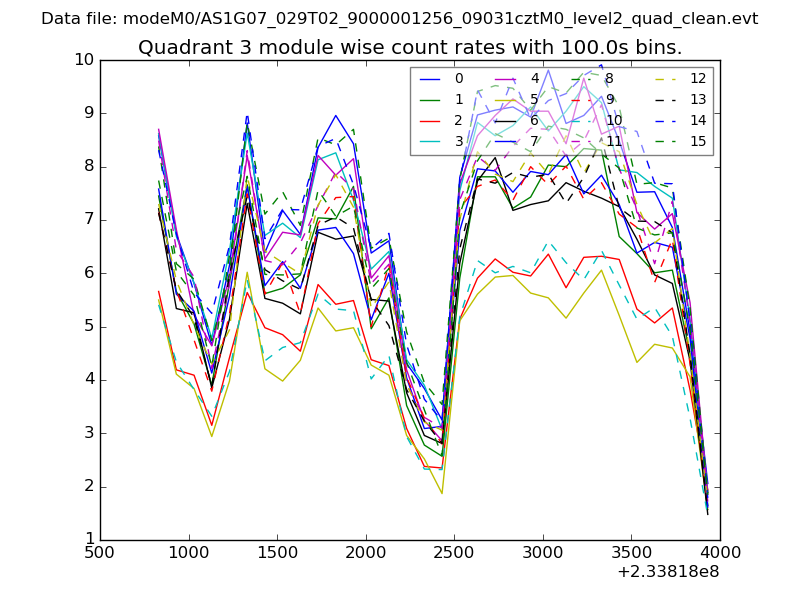
| Module-wise count rates for Quadrant C Data is divided into 100 sec bins |
 |
 |
| Module-wise count rates for Quadrant D Data is divided into 100 sec bins |
 |
 |
| Parameter | Plot |
|---|---|
| CZT HV Monitor | 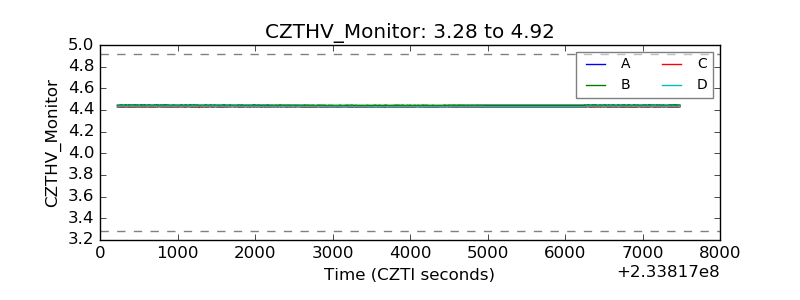 |
| D_VDD |  |
| Temperature 1 |  |
| Veto HV Monitor | 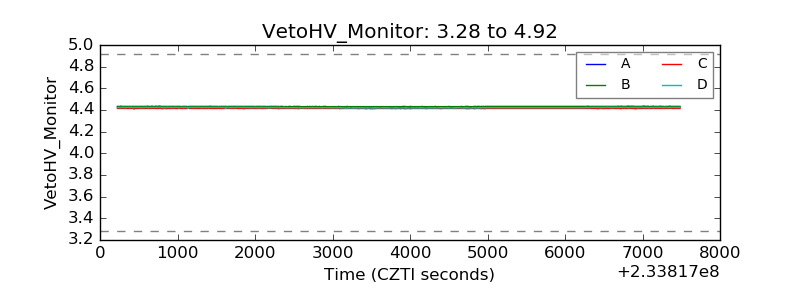 |
| Veto LLD | 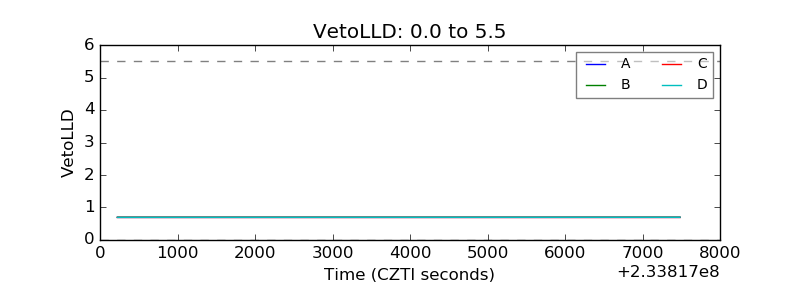 |
| Alpha Counter | 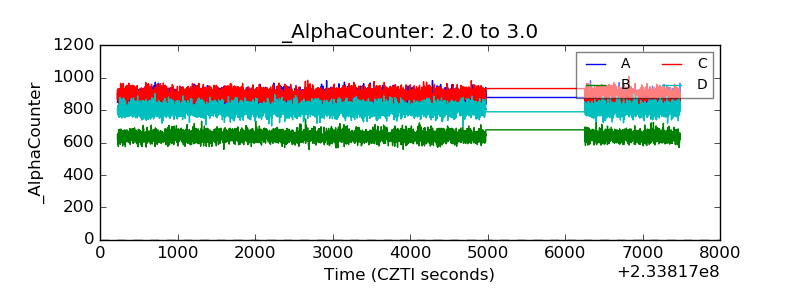 |
| _CPM_Rate | 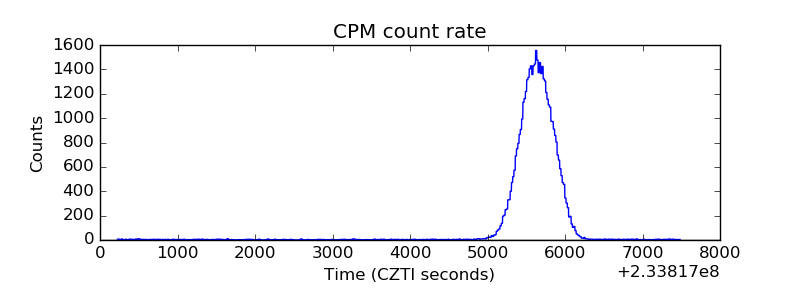 |
| CZT Counter | 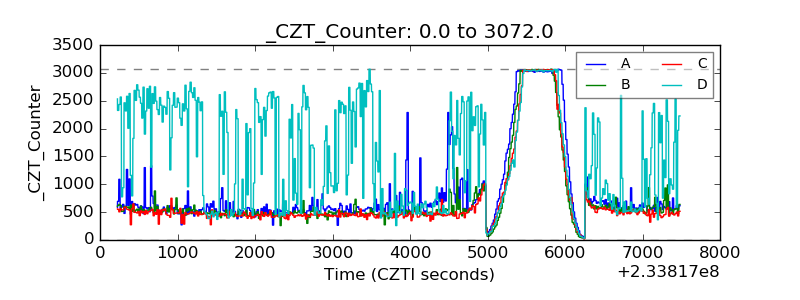 |
| +2.5 Volts monitor |  |
| +5 Volts monitor |  |
| _ROLL_ROT | 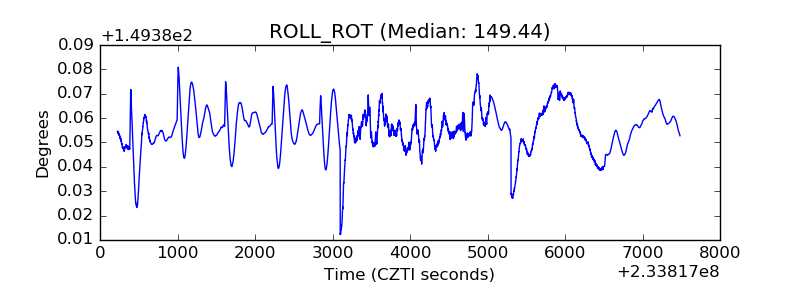 |
| _Roll_DEC | 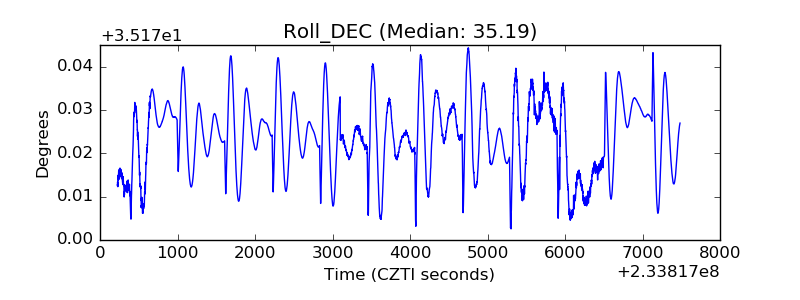 |
| _Roll_RA | 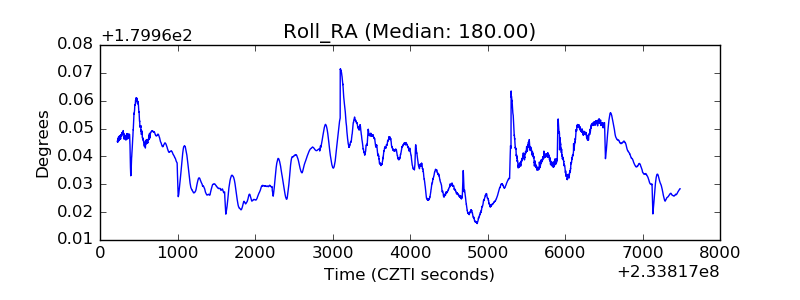 |
| Veto Counter | 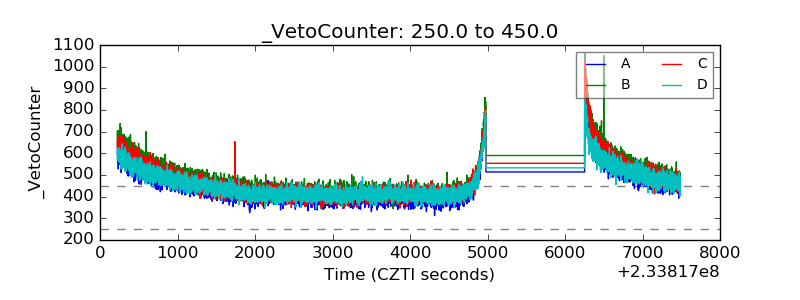 |