| Param | Original file | Final file |
|---|---|---|
| Filename | modeM0/AS1G07_029T02_9000001256_09032cztM0_level2.evt | modeM0/AS1G07_029T02_9000001256_09032cztM0_level2_quad_clean.evt |
| Size (bytes) | 565,133,760 | 80,556,480 |
| Size | 539.0 MB | 76.8 MB |
| Events in quadrant A | 4,138,344 | 511,056 |
| Events in quadrant B | 3,505,331 | 519,514 |
| Events in quadrant C | 3,119,529 | 503,303 |
| Events in quadrant D | 5,923,531 | 464,065 |
| Mode SS | |||
|---|---|---|---|
| Quadrant | BADHDUFLAG | Total packets | Discarded packets |
| A | 0 | 130 | 0 |
| B | 0 | 130 | 0 |
| C | 0 | 130 | 0 |
| D | 0 | 130 | 0 |
| Mode M9 | |||
|---|---|---|---|
| Quadrant | BADHDUFLAG | Total packets | Discarded packets |
| A | 0 | 18 | 0 |
| B | 0 | 18 | 0 |
| C | 0 | 18 | 0 |
| D | 0 | 19 | 0 |
| Mode M0 | |||
|---|---|---|---|
| Quadrant | BADHDUFLAG | Total packets | Discarded packets |
| A | 0 | 16567 | 3 |
| B | 0 | 14201 | 2 |
| C | 0 | 13254 | 2 |
| D | 0 | 21773 | 2 |
| Quadrant | Total seconds | Saturated seconds | Saturation percentage |
|---|---|---|---|
| A | 6318 | 161 | 2.548275% |
| B | 6318 | 148 | 2.342513% |
| C | 6318 | 82 | 1.297879% |
| D | 6318 | 810 | 12.820513% |
Noise dominated data is calculated using 1-second bins in cleaned event files. If a bin has >2000 counts, and if more than 50% of those come from <1% of pixels, then it is considered to be noise-dominated and hence unusable.
| Quadrant | # 1 sec bins | Bins with >0 counts | Bins with >2000 counts | High rate bins dominated by noise | Noise dominated (total time) | Noise dominated (detector-on time) | Marked lightcurve |
|---|---|---|---|---|---|---|---|
| A | 7563 | 6318 | 0 | 0 | 0.00% | 0.00% |  |
| B | 7563 | 6318 | 11 | 11 | 0.15% | 0.17% | 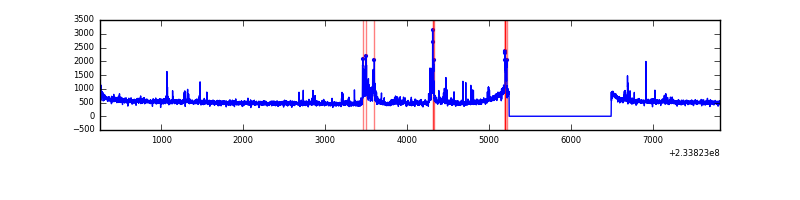 |
| C | 7563 | 6318 | 4 | 4 | 0.05% | 0.06% | 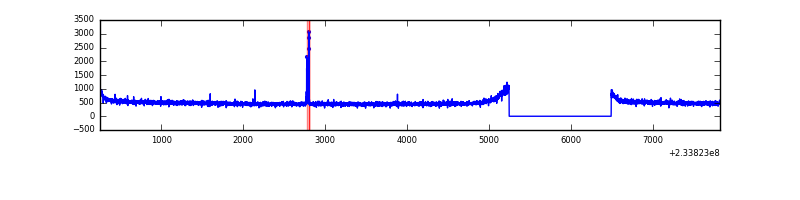 |
| D | 7563 | 6318 | 645 | 645 | 8.53% | 10.21% | 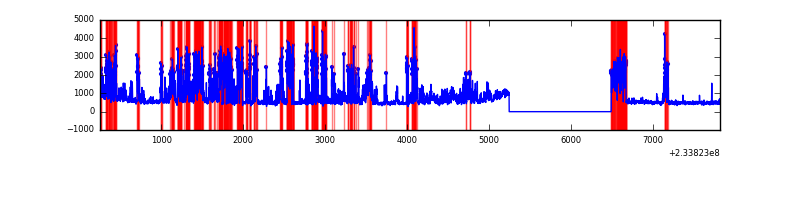 |
Top three noisy pixels from each quadrant. If the there are fewer than three noisy pixels in the level2.evt file, extra rows are filled as -1
| Pixel properties | Quadrant properties | ||||||
|---|---|---|---|---|---|---|---|
| Quadrant | DetID | PixID | Counts | Sigma | Mean | Median | Sigma |
| A | 8 | 5 | 802948 | 4842.04 | 827 | 810 | 165.7 |
| A | 1 | 162 | 75458 | 450.6 | 827 | 810 | 165.7 |
| A | 1 | 178 | 22781 | 132.62 | 827 | 810 | 165.7 |
| B | 4 | 48 | 191525 | 1224.9 | 823 | 804 | 155.7 |
| B | 10 | 16 | 35886 | 225.31 | 823 | 804 | 155.7 |
| B | 0 | 229 | 27774 | 173.21 | 823 | 804 | 155.7 |
| C | 8 | 222 | 34508 | 184.75 | 791 | 795 | 182.5 |
| C | 13 | 61 | 6006 | 28.56 | 791 | 795 | 182.5 |
| C | 3 | 202 | 1993 | 6.57 | 791 | 795 | 182.5 |
| D | 1 | 52 | 2360974 | 12843.69 | 760 | 743 | 183.8 |
| D | 6 | 225 | 582631 | 3166.46 | 760 | 743 | 183.8 |
| D | 13 | 122 | 38759 | 206.87 | 760 | 743 | 183.8 |
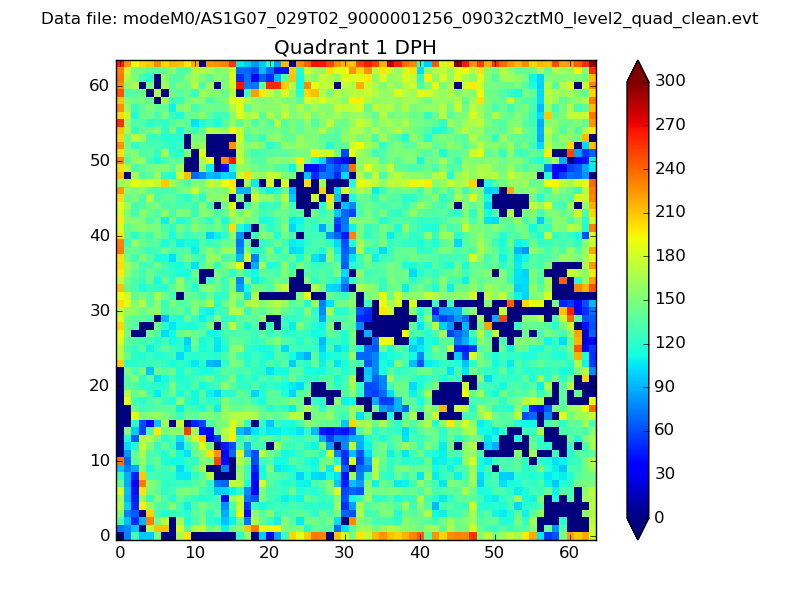
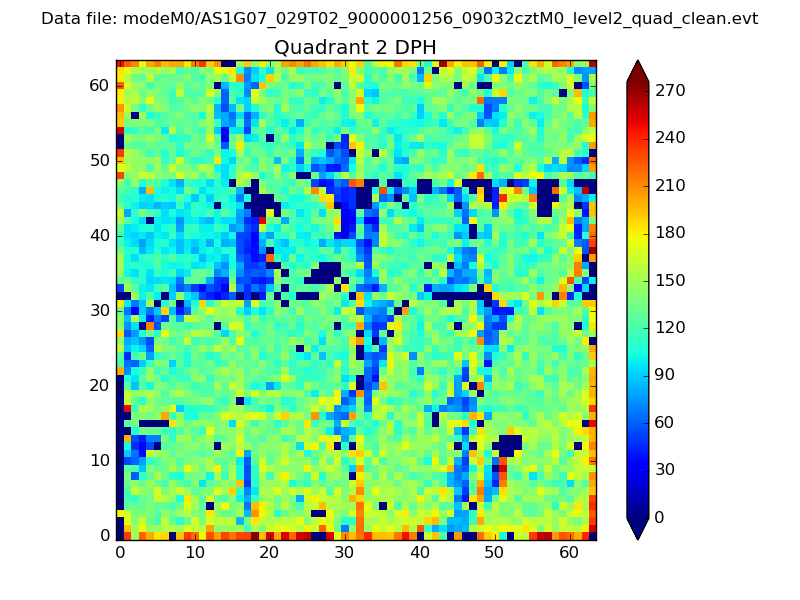
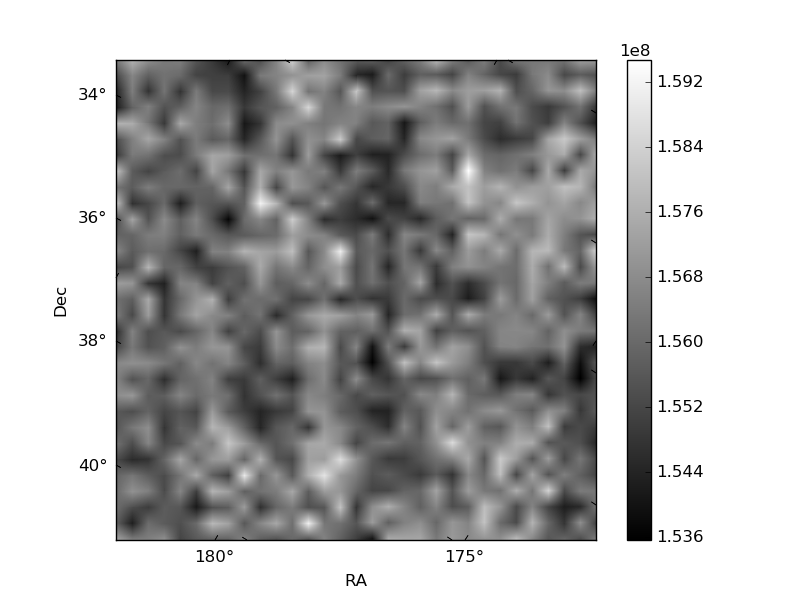
Histogram calculated using DETX and DETY for each event in the final _common_clean file
| Quadrant A |  |
 |
Quadrant B |
|---|---|---|---|
| Quadrant D | 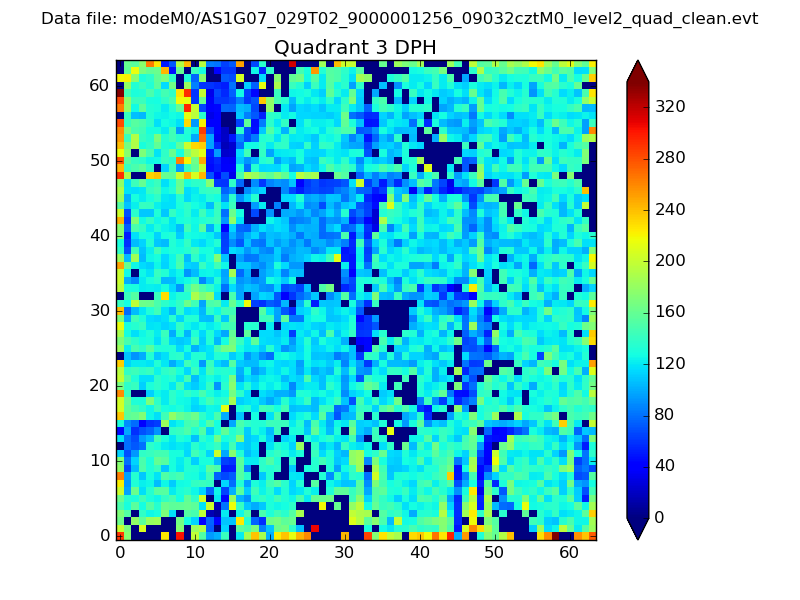 |
 |
Quadrant C |
| Plot type | Count rate plots | Images |
|---|---|---|
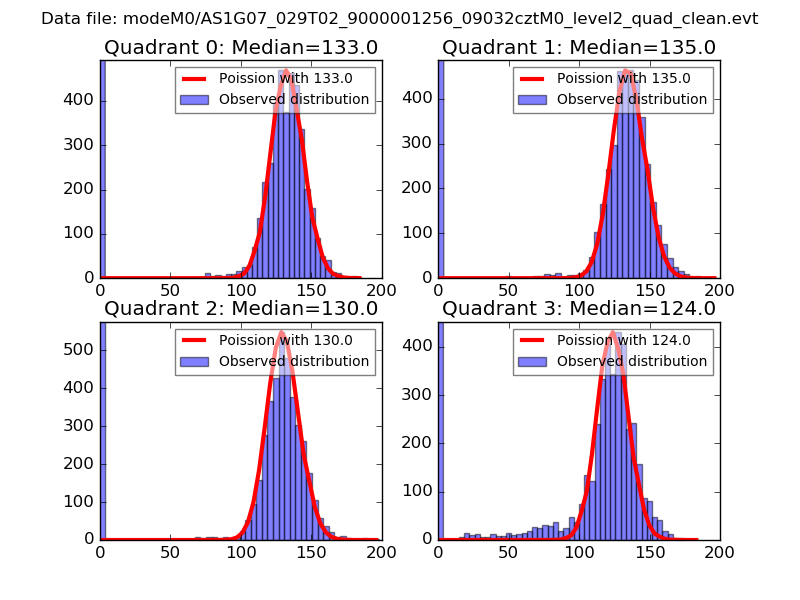
| Comparison with Poisson distribution Blue bars denote a histogram of data divided into 1 sec bins. Red curve is a Poisson curve with rate = median count rate of data. |
 |
 |
| Quadrant-wise count rates Data is divided into 100 sec bins |
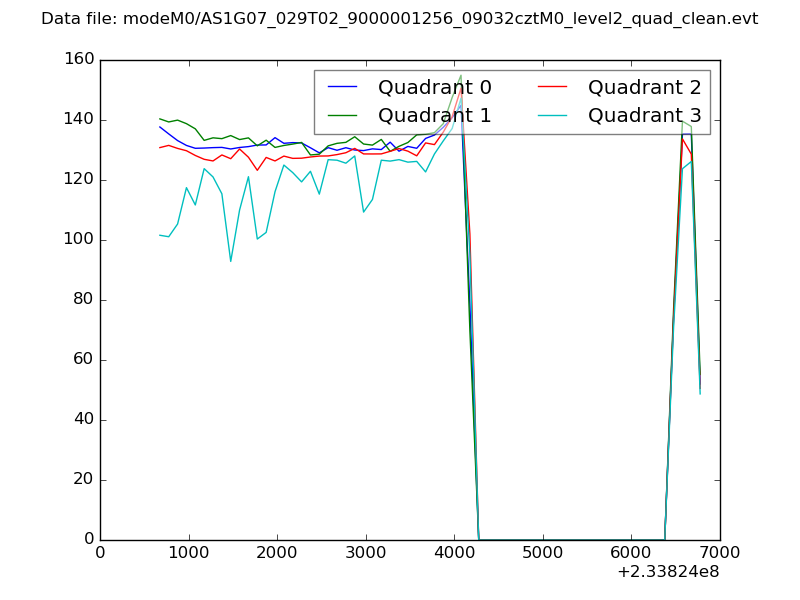 |
|
| Module-wise count rates for Quadrant A Data is divided into 100 sec bins |
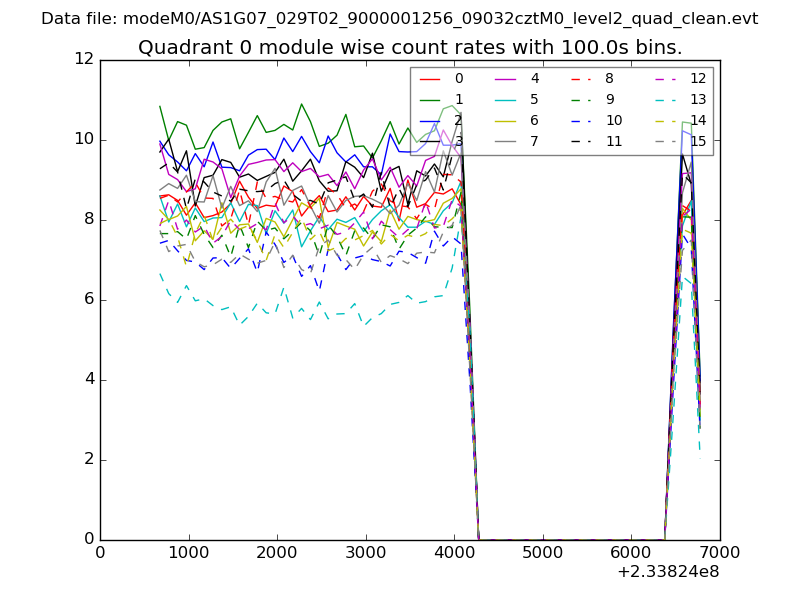 |
 |
| Module-wise count rates for Quadrant B Data is divided into 100 sec bins |
 |
 |
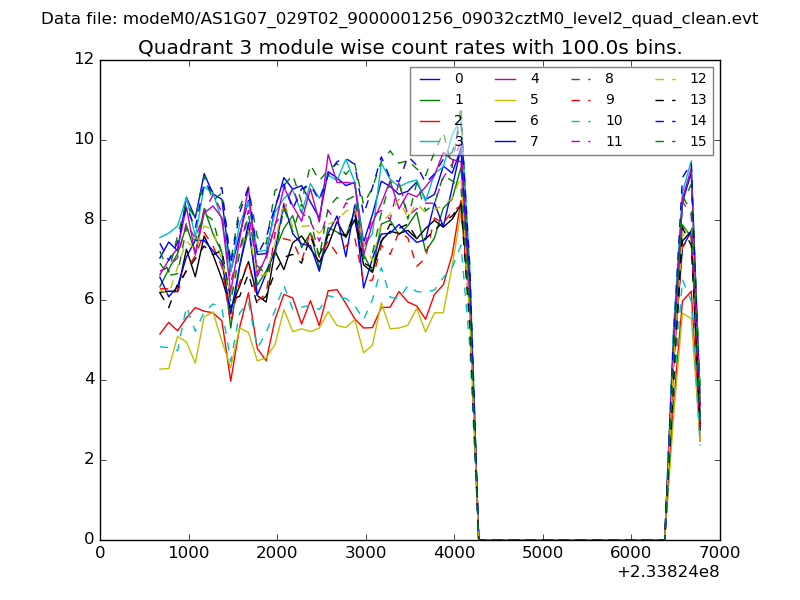
| Module-wise count rates for Quadrant C Data is divided into 100 sec bins |
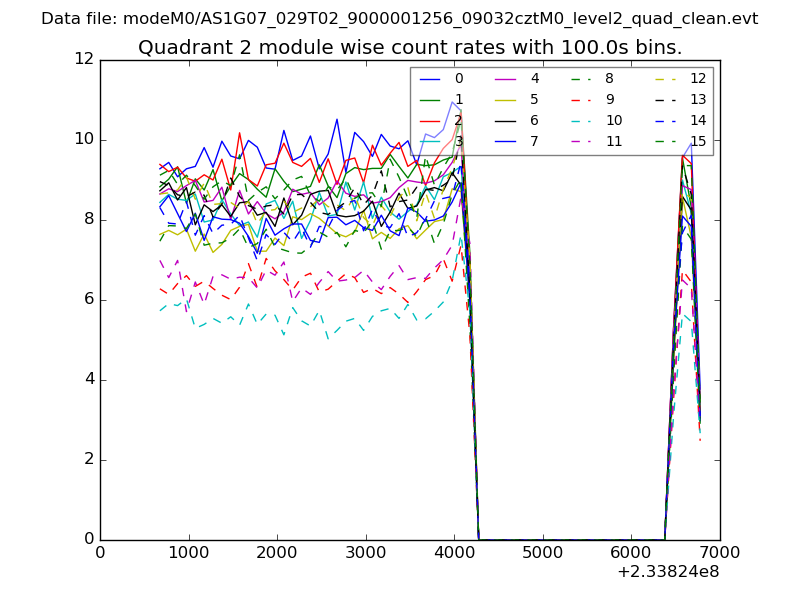 |
 |
| Module-wise count rates for Quadrant D Data is divided into 100 sec bins |
 |
 |
| Parameter | Plot |
|---|---|
| CZT HV Monitor | 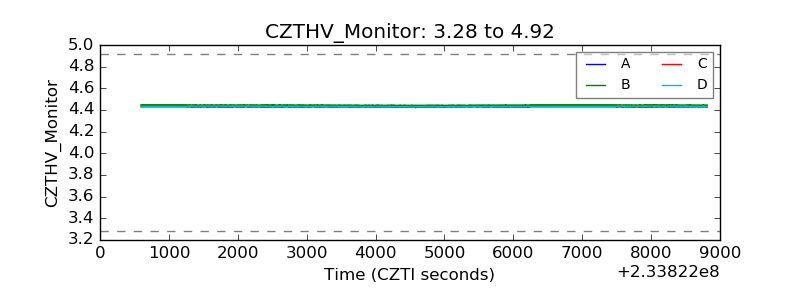 |
| D_VDD | 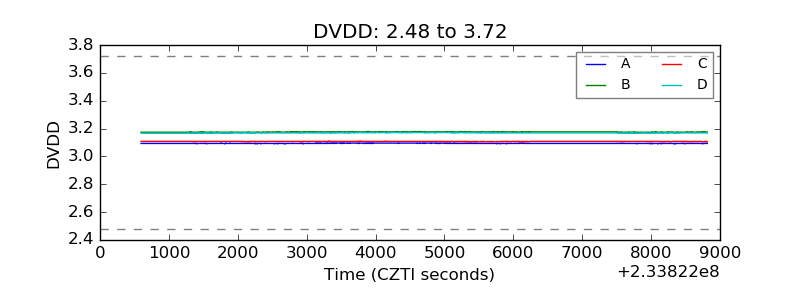 |
| Temperature 1 | 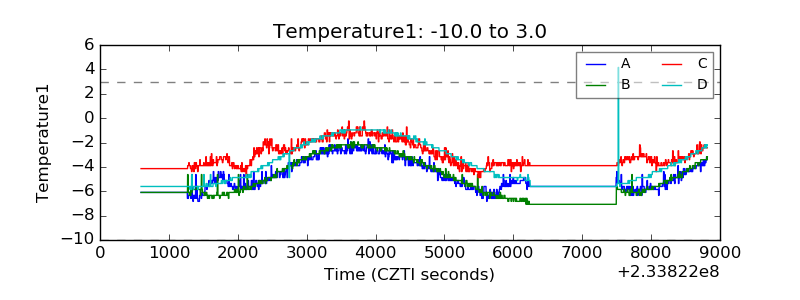 |
| Veto HV Monitor |  |
| Veto LLD | 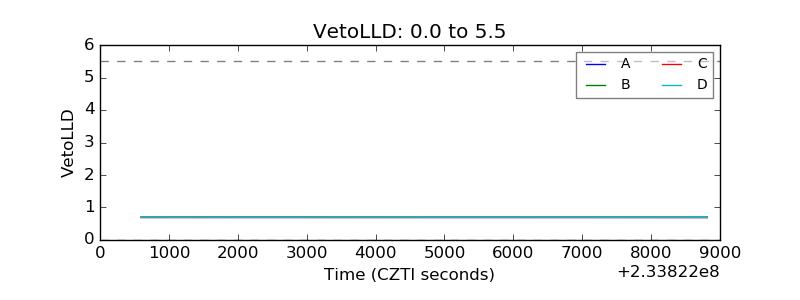 |
| Alpha Counter | 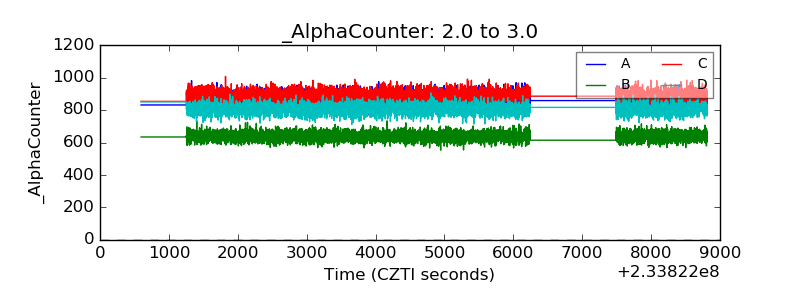 |
| _CPM_Rate | 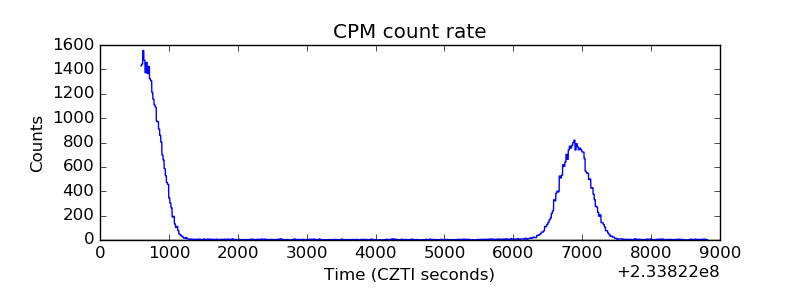 |
| CZT Counter | 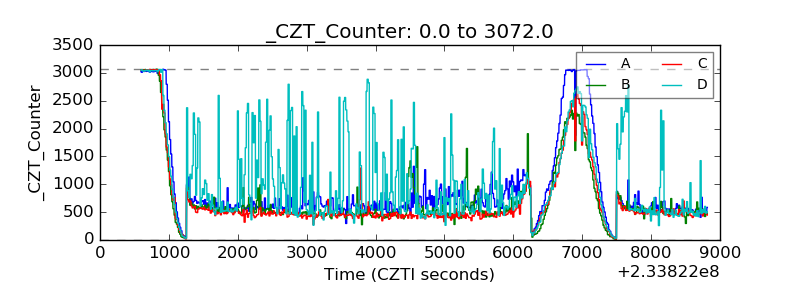 |
| +2.5 Volts monitor |  |
| +5 Volts monitor |  |
| _ROLL_ROT | 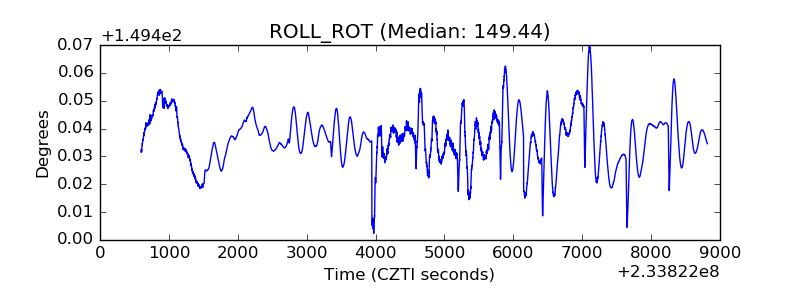 |
| _Roll_DEC | 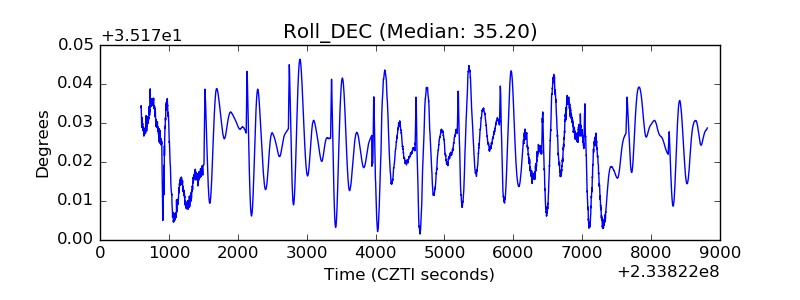 |
| _Roll_RA | 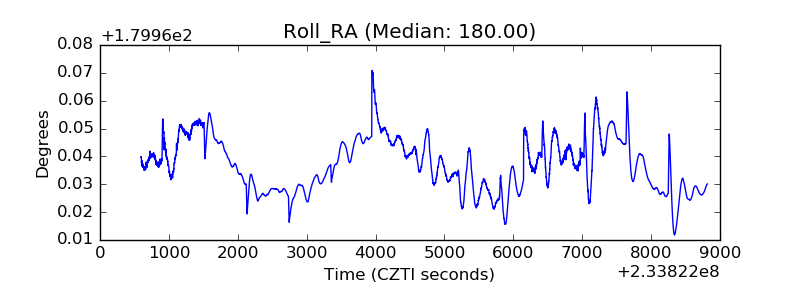 |
| Veto Counter | 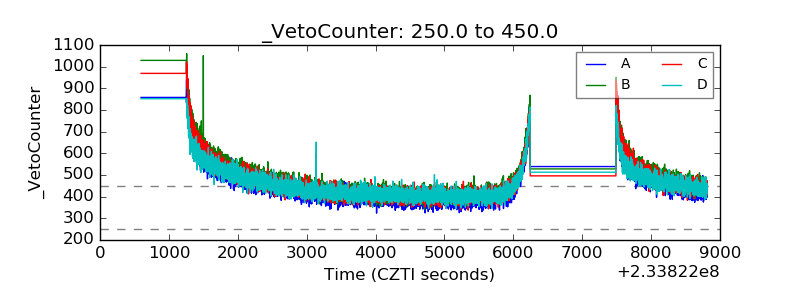 |