| Param | Original file | Final file |
|---|---|---|
| Filename | modeM0/AS1G07_029T02_9000001256_09035cztM0_level2.evt | modeM0/AS1G07_029T02_9000001256_09035cztM0_level2_quad_clean.evt |
| Size (bytes) | 619,925,760 | 99,872,640 |
| Size | 591.2 MB | 95.2 MB |
| Events in quadrant A | 7,103,276 | 627,505 |
| Events in quadrant B | 3,736,234 | 649,750 |
| Events in quadrant C | 3,220,656 | 635,205 |
| Events in quadrant D | 4,228,530 | 611,970 |
| Mode SS | |||
|---|---|---|---|
| Quadrant | BADHDUFLAG | Total packets | Discarded packets |
| A | 0 | 146 | 0 |
| B | 0 | 146 | 0 |
| C | 0 | 146 | 0 |
| D | 0 | 146 | 0 |
| Mode M9 | |||
|---|---|---|---|
| Quadrant | BADHDUFLAG | Total packets | Discarded packets |
| A | 0 | 4 | 0 |
| B | 0 | 4 | 0 |
| C | 0 | 4 | 0 |
| D | 0 | 4 | 0 |
| Mode M0 | |||
|---|---|---|---|
| Quadrant | BADHDUFLAG | Total packets | Discarded packets |
| A | 0 | 26170 | 2 |
| B | 0 | 15745 | 1 |
| C | 0 | 14699 | 1 |
| D | 0 | 17530 | 1 |
| Quadrant | Total seconds | Saturated seconds | Saturation percentage |
|---|---|---|---|
| A | 7179 | 445 | 6.198635% |
| B | 7179 | 96 | 1.337234% |
| C | 7179 | 28 | 0.390026% |
| D | 7179 | 176 | 2.451595% |
Noise dominated data is calculated using 1-second bins in cleaned event files. If a bin has >2000 counts, and if more than 50% of those come from <1% of pixels, then it is considered to be noise-dominated and hence unusable.
| Quadrant | # 1 sec bins | Bins with >0 counts | Bins with >2000 counts | High rate bins dominated by noise | Noise dominated (total time) | Noise dominated (detector-on time) | Marked lightcurve |
|---|---|---|---|---|---|---|---|
| A | 7584 | 7179 | 307 | 307 | 4.05% | 4.28% | 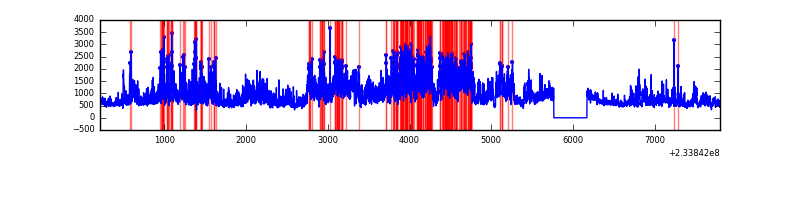 |
| B | 7584 | 7180 | 13 | 13 | 0.17% | 0.18% | 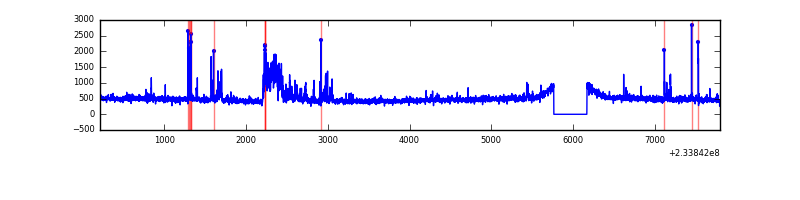 |
| C | 7584 | 7180 | 0 | 0 | 0.00% | 0.00% | 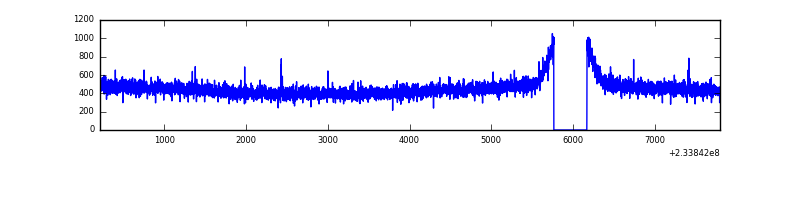 |
| D | 7584 | 7179 | 85 | 85 | 1.12% | 1.18% | 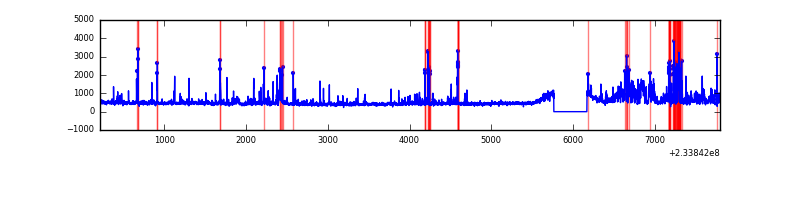 |
Top three noisy pixels from each quadrant. If the there are fewer than three noisy pixels in the level2.evt file, extra rows are filled as -1
| Pixel properties | Quadrant properties | ||||||
|---|---|---|---|---|---|---|---|
| Quadrant | DetID | PixID | Counts | Sigma | Mean | Median | Sigma |
| A | 8 | 5 | 3501551 | 20416.62 | 842 | 824 | 171.5 |
| A | 5 | 16 | 153176 | 888.53 | 842 | 824 | 171.5 |
| A | 1 | 162 | 88276 | 510.03 | 842 | 824 | 171.5 |
| B | 4 | 48 | 243208 | 1470.85 | 853 | 833 | 164.8 |
| B | 6 | 51 | 80082 | 480.92 | 853 | 833 | 164.8 |
| B | 0 | 197 | 22939 | 134.15 | 853 | 833 | 164.8 |
| C | 13 | 61 | 6226 | 28.1 | 825 | 830 | 192.0 |
| C | 14 | 234 | 2833 | 10.43 | 825 | 830 | 192.0 |
| C | 3 | 202 | 2052 | 6.36 | 825 | 830 | 192.0 |
| D | 6 | 225 | 754474 | 3581.23 | 825 | 805 | 210.4 |
| D | 2 | 14 | 84392 | 397.18 | 825 | 805 | 210.4 |
| D | 1 | 52 | 63375 | 297.32 | 825 | 805 | 210.4 |
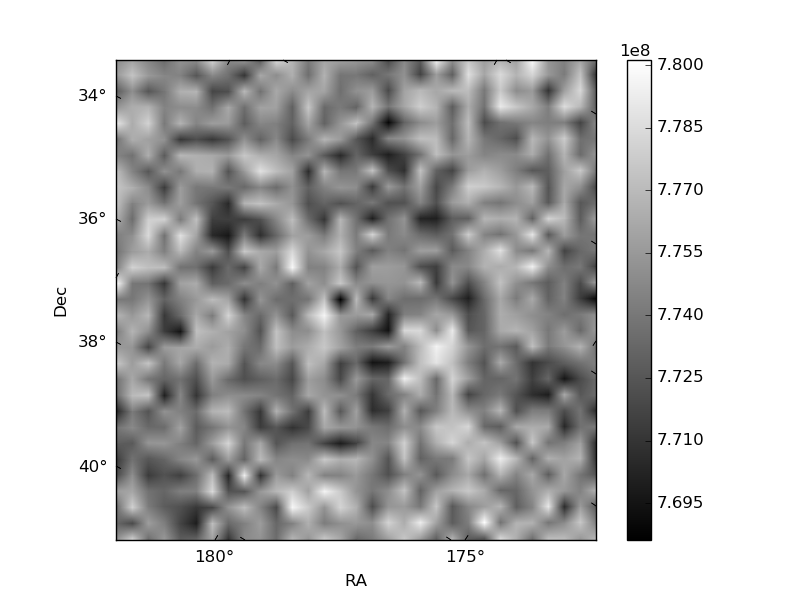
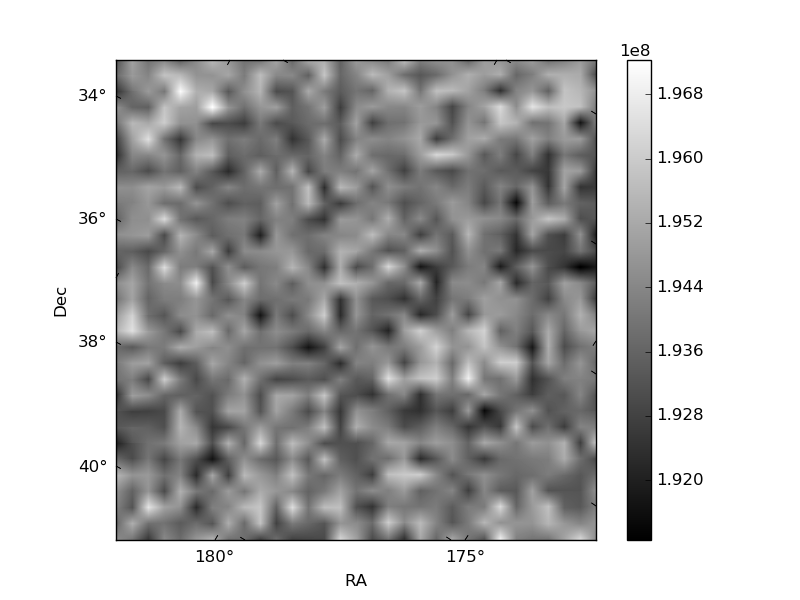
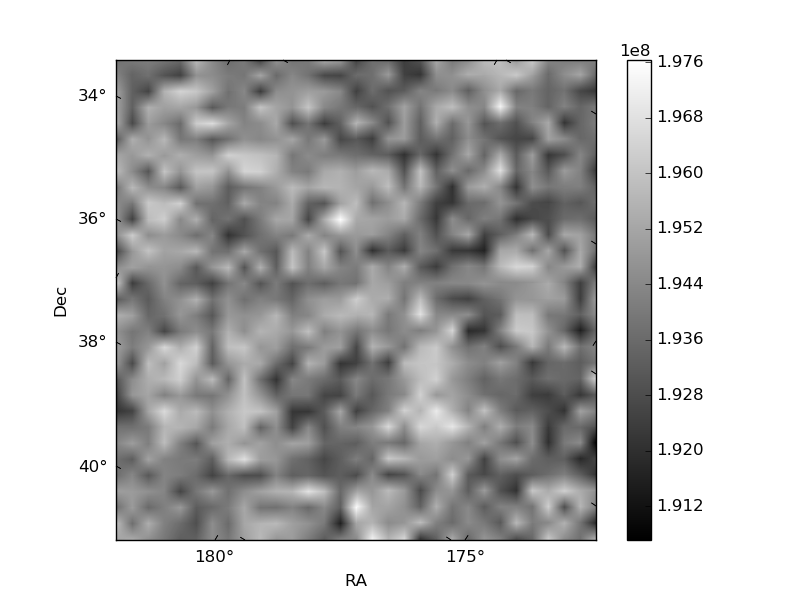
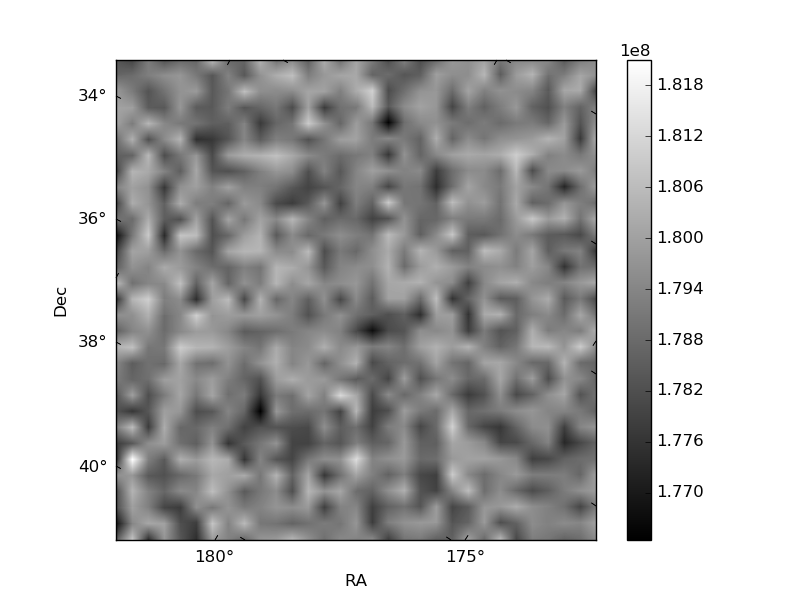
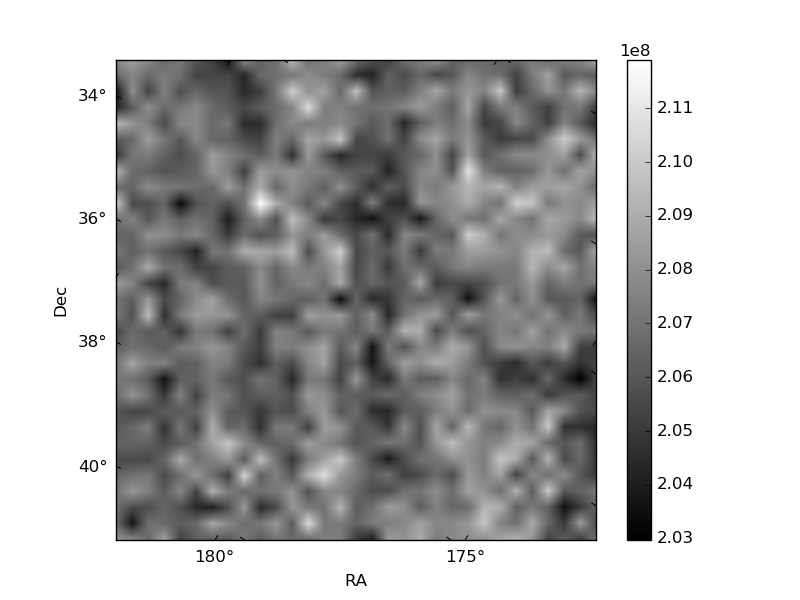
Histogram calculated using DETX and DETY for each event in the final _common_clean file
| Quadrant A | 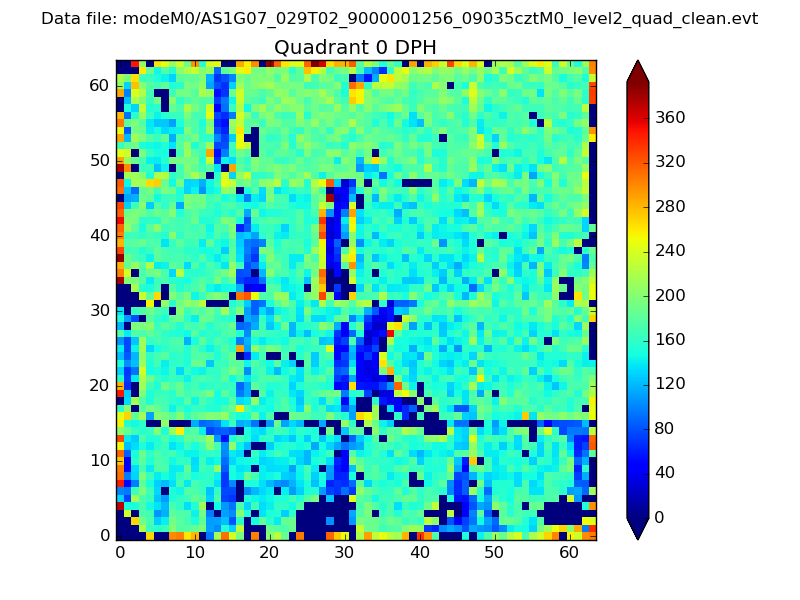 |
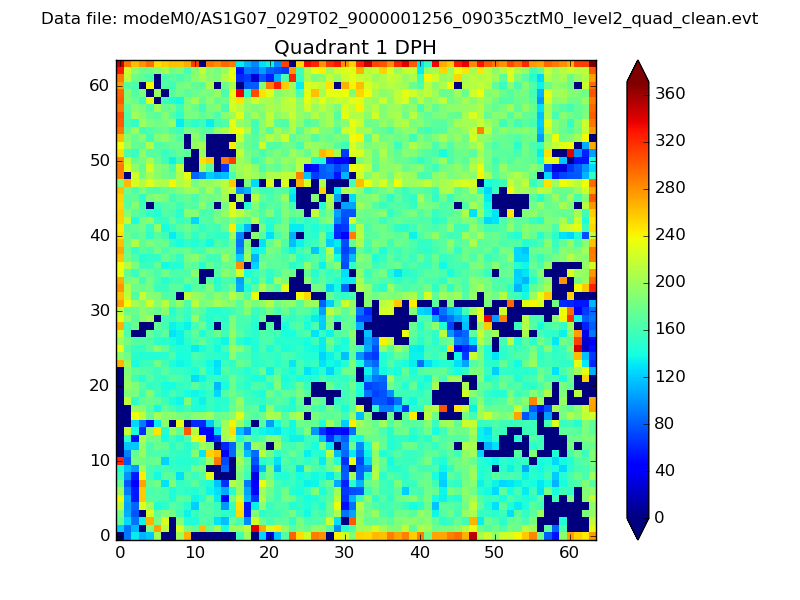 |
Quadrant B |
|---|---|---|---|
| Quadrant D | 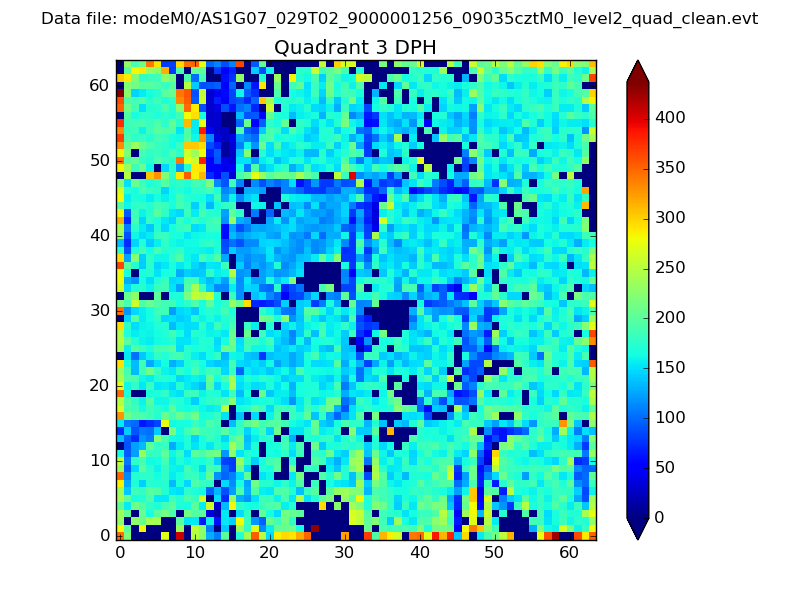 |
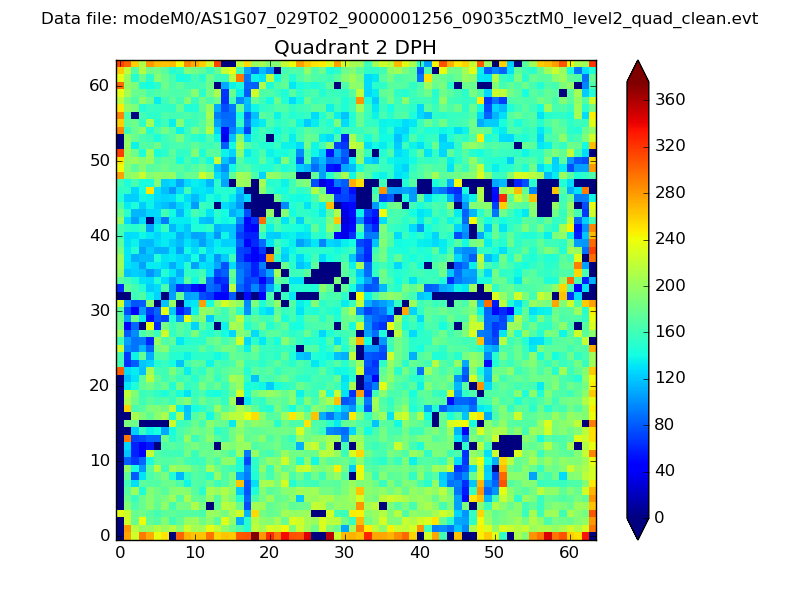 |
Quadrant C |
| Plot type | Count rate plots | Images |
|---|---|---|
| Comparison with Poisson distribution Blue bars denote a histogram of data divided into 1 sec bins. Red curve is a Poisson curve with rate = median count rate of data. |
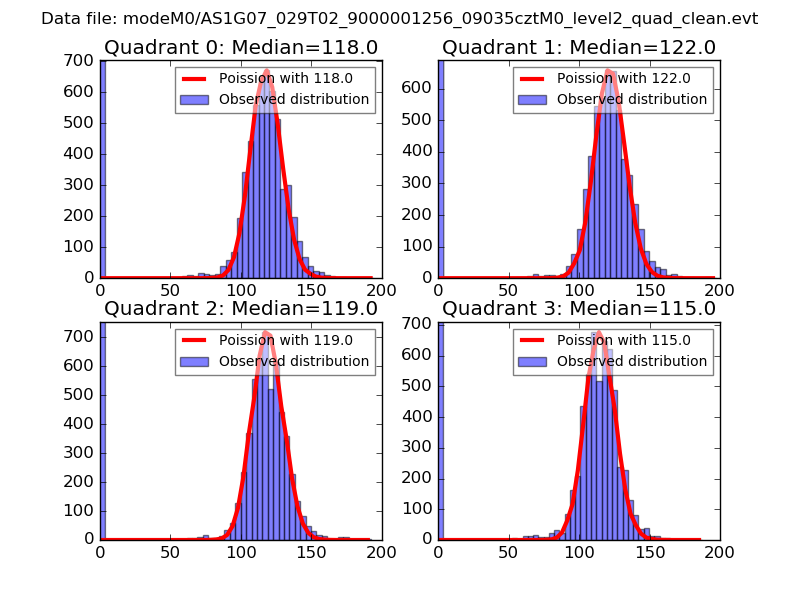 |
 |
| Quadrant-wise count rates Data is divided into 100 sec bins |
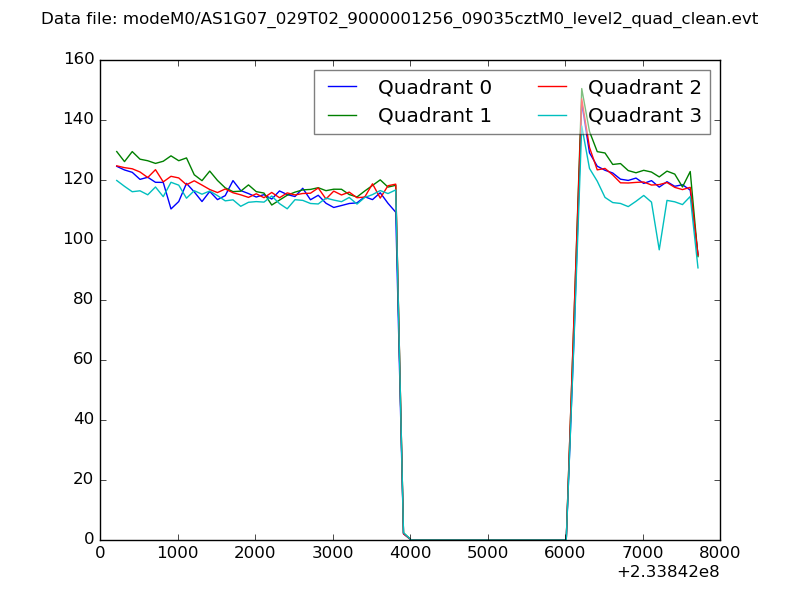 |
|
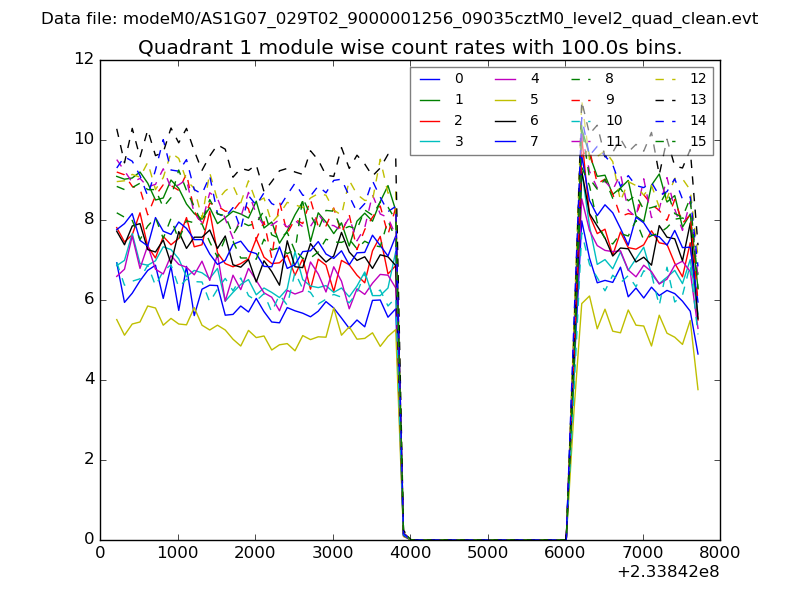
| Module-wise count rates for Quadrant A Data is divided into 100 sec bins |
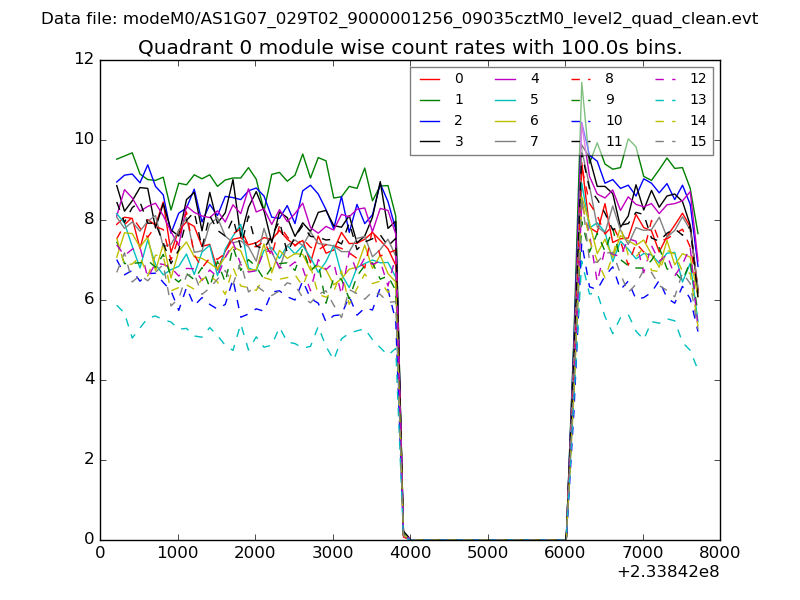 |
 |
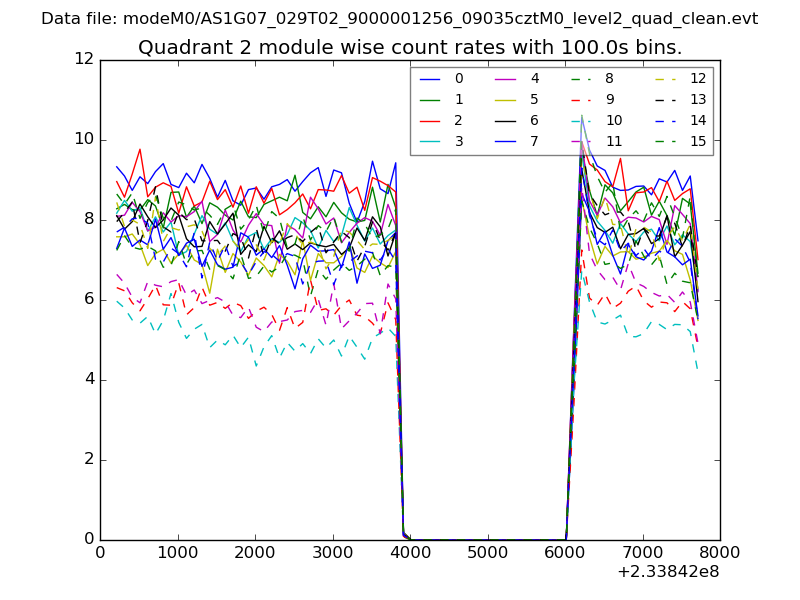
| Module-wise count rates for Quadrant B Data is divided into 100 sec bins |
 |
 |
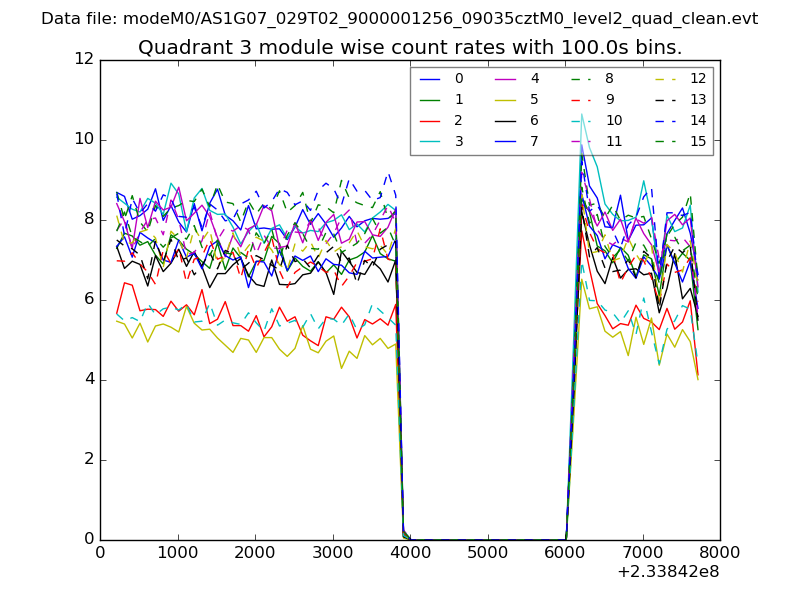
| Module-wise count rates for Quadrant C Data is divided into 100 sec bins |
 |
 |
| Module-wise count rates for Quadrant D Data is divided into 100 sec bins |
 |
 |
| Parameter | Plot |
|---|---|
| CZT HV Monitor | 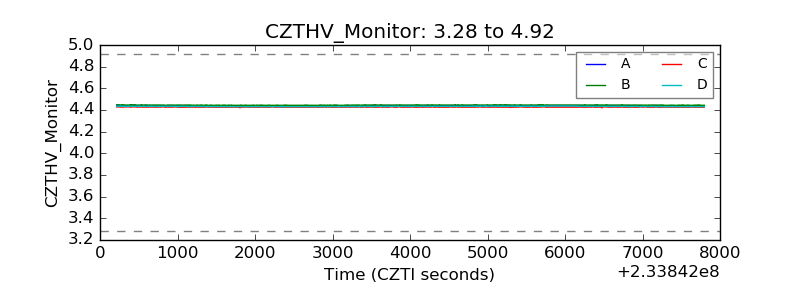 |
| D_VDD |  |
| Temperature 1 | 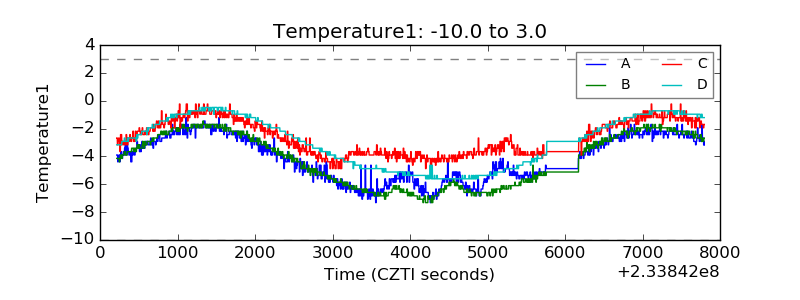 |
| Veto HV Monitor | 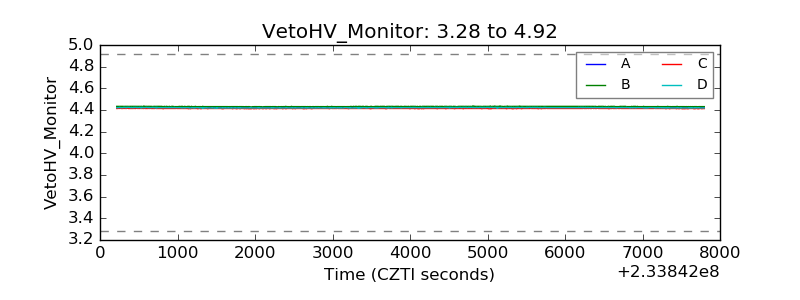 |
| Veto LLD | 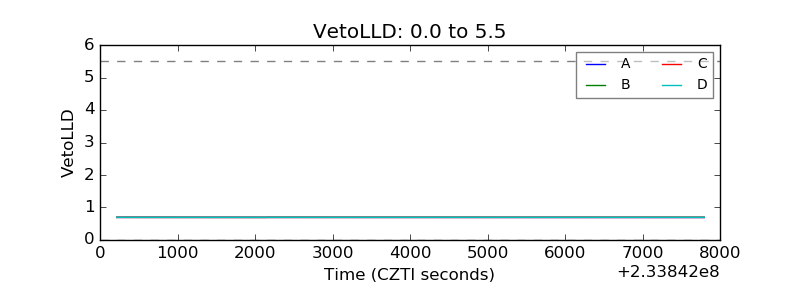 |
| Alpha Counter | 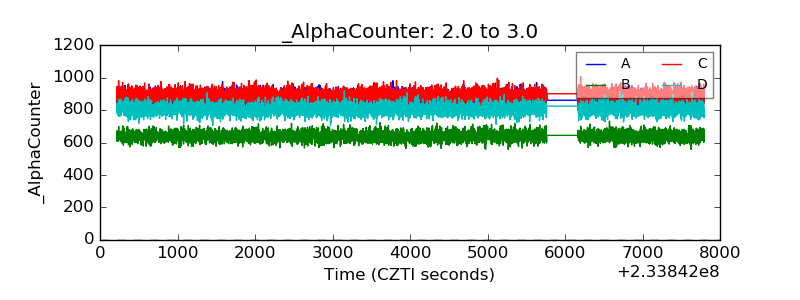 |
| _CPM_Rate | 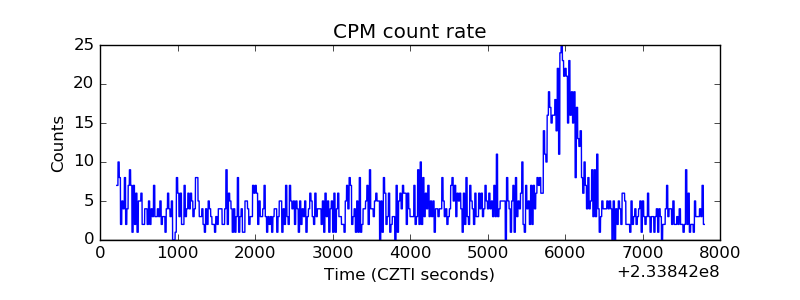 |
| CZT Counter |  |
| +2.5 Volts monitor |  |
| +5 Volts monitor |  |
| _ROLL_ROT | 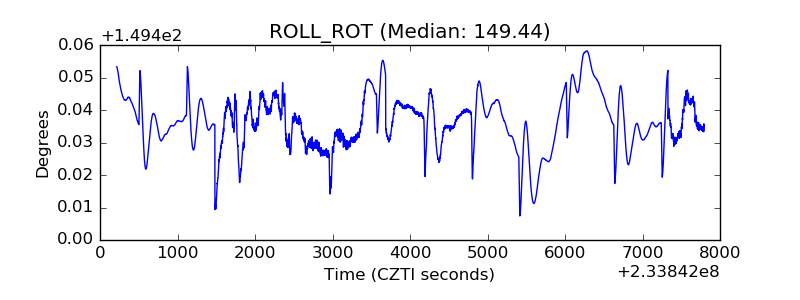 |
| _Roll_DEC | 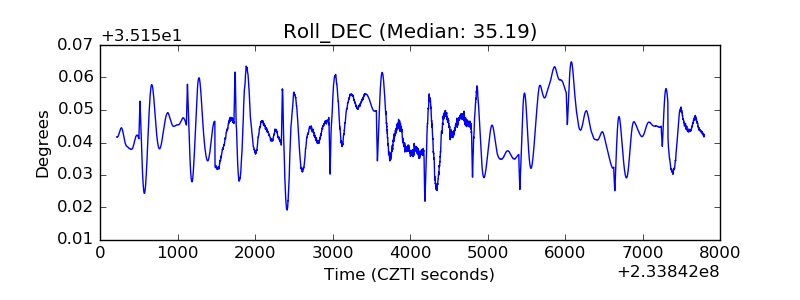 |
| _Roll_RA | 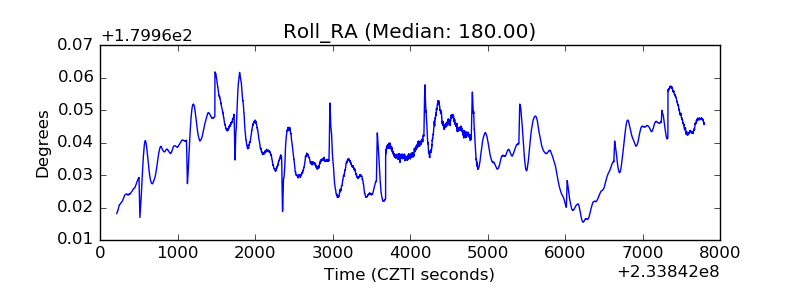 |
| Veto Counter | 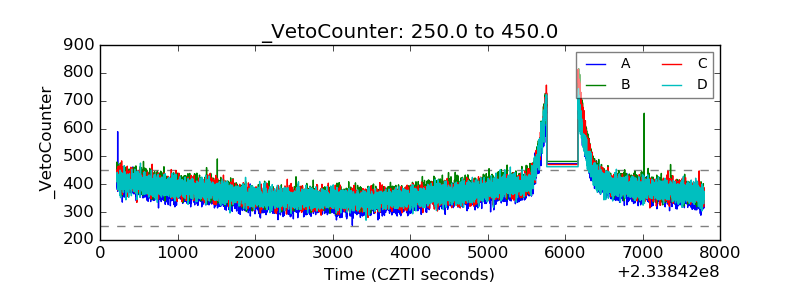 |