| Param | Original file | Final file |
|---|---|---|
| Filename | modeM0/AS1G07_029T02_9000001256_09036cztM0_level2.evt | modeM0/AS1G07_029T02_9000001256_09036cztM0_level2_quad_clean.evt |
| Size (bytes) | 671,480,640 | 96,500,160 |
| Size | 640.4 MB | 92.0 MB |
| Events in quadrant A | 7,941,273 | 588,556 |
| Events in quadrant B | 3,580,328 | 628,421 |
| Events in quadrant C | 3,333,742 | 615,902 |
| Events in quadrant D | 4,987,486 | 581,586 |
| Mode SS | |||
|---|---|---|---|
| Quadrant | BADHDUFLAG | Total packets | Discarded packets |
| A | 0 | 148 | 0 |
| B | 0 | 148 | 0 |
| C | 0 | 148 | 0 |
| D | 0 | 148 | 0 |
| Mode M0 | |||
|---|---|---|---|
| Quadrant | BADHDUFLAG | Total packets | Discarded packets |
| A | 0 | 28764 | 2 |
| B | 0 | 15554 | 1 |
| C | 0 | 15175 | 1 |
| D | 0 | 19761 | 1 |
| Quadrant | Total seconds | Saturated seconds | Saturation percentage |
|---|---|---|---|
| A | 7279 | 994 | 13.655722% |
| B | 7279 | 195 | 2.678939% |
| C | 7279 | 86 | 1.181481% |
| D | 7279 | 404 | 5.550213% |
Noise dominated data is calculated using 1-second bins in cleaned event files. If a bin has >2000 counts, and if more than 50% of those come from <1% of pixels, then it is considered to be noise-dominated and hence unusable.
| Quadrant | # 1 sec bins | Bins with >0 counts | Bins with >2000 counts | High rate bins dominated by noise | Noise dominated (total time) | Noise dominated (detector-on time) | Marked lightcurve |
|---|---|---|---|---|---|---|---|
| A | 7329 | 7280 | 470 | 470 | 6.41% | 6.46% | 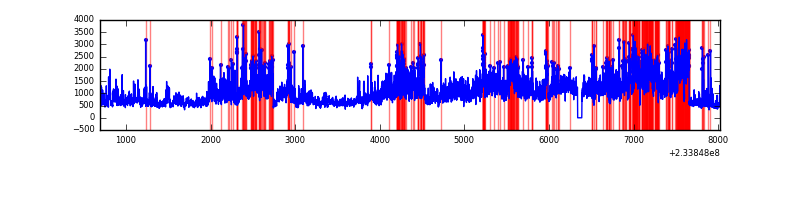 |
| B | 7329 | 7280 | 4 | 4 | 0.05% | 0.05% | 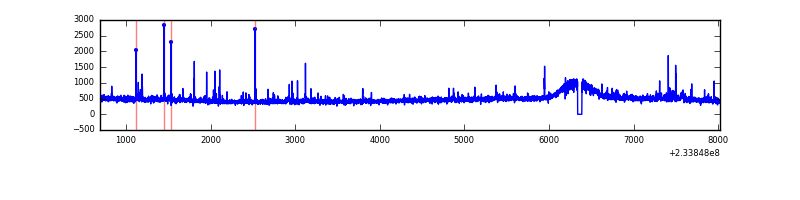 |
| C | 7329 | 7280 | 0 | 0 | 0.00% | 0.00% | 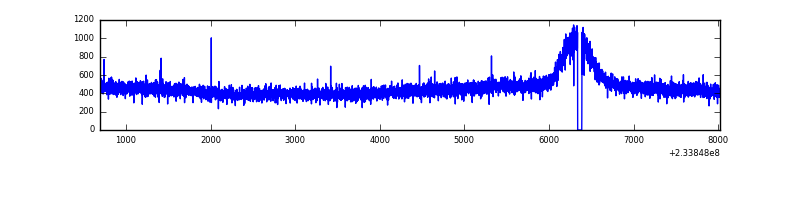 |
| D | 7329 | 7280 | 169 | 169 | 2.31% | 2.32% | 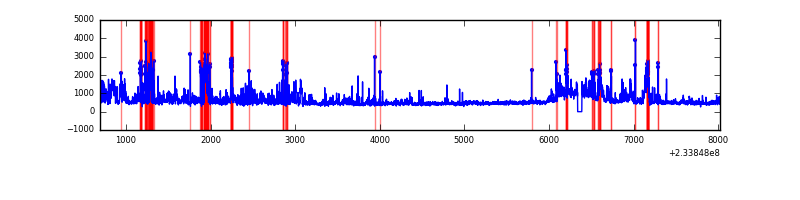 |
Top three noisy pixels from each quadrant. If the there are fewer than three noisy pixels in the level2.evt file, extra rows are filled as -1
| Pixel properties | Quadrant properties | ||||||
|---|---|---|---|---|---|---|---|
| Quadrant | DetID | PixID | Counts | Sigma | Mean | Median | Sigma |
| A | 8 | 5 | 4325919 | 24794.07 | 849 | 829 | 174.4 |
| A | 5 | 16 | 210398 | 1201.38 | 849 | 829 | 174.4 |
| A | 1 | 162 | 57845 | 326.85 | 849 | 829 | 174.4 |
| B | 6 | 51 | 43389 | 249.37 | 878 | 856 | 170.6 |
| B | 0 | 214 | 26319 | 149.29 | 878 | 856 | 170.6 |
| B | 10 | 16 | 23100 | 130.42 | 878 | 856 | 170.6 |
| C | 13 | 61 | 6532 | 28.42 | 853 | 855 | 199.7 |
| C | 8 | 128 | 4251 | 17.0 | 853 | 855 | 199.7 |
| C | 8 | 112 | 2657 | 9.02 | 853 | 855 | 199.7 |
| D | 6 | 225 | 1410475 | 6368.98 | 844 | 821 | 221.3 |
| D | 2 | 14 | 107147 | 480.39 | 844 | 821 | 221.3 |
| D | 1 | 52 | 66208 | 295.43 | 844 | 821 | 221.3 |
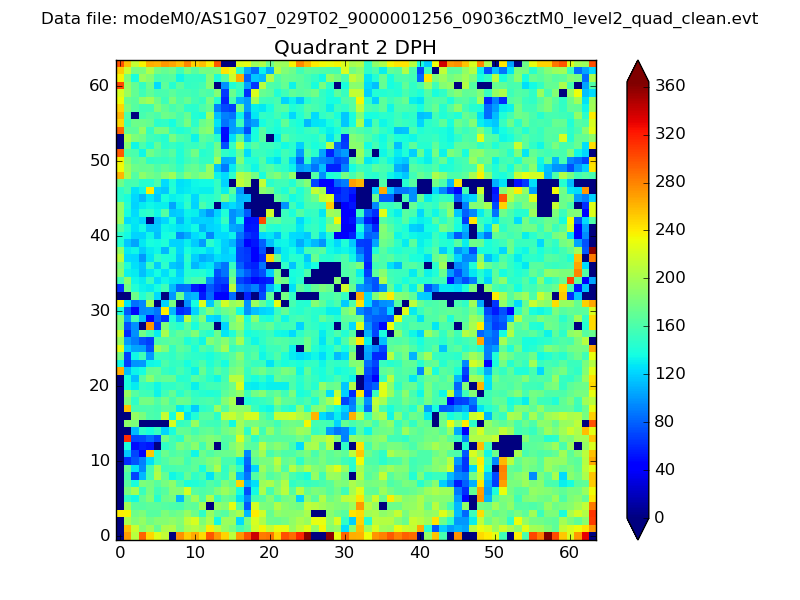
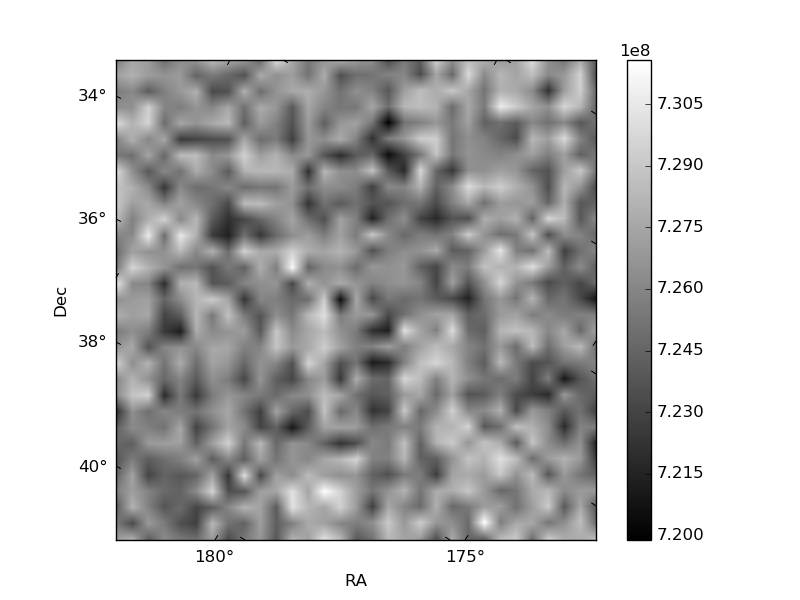
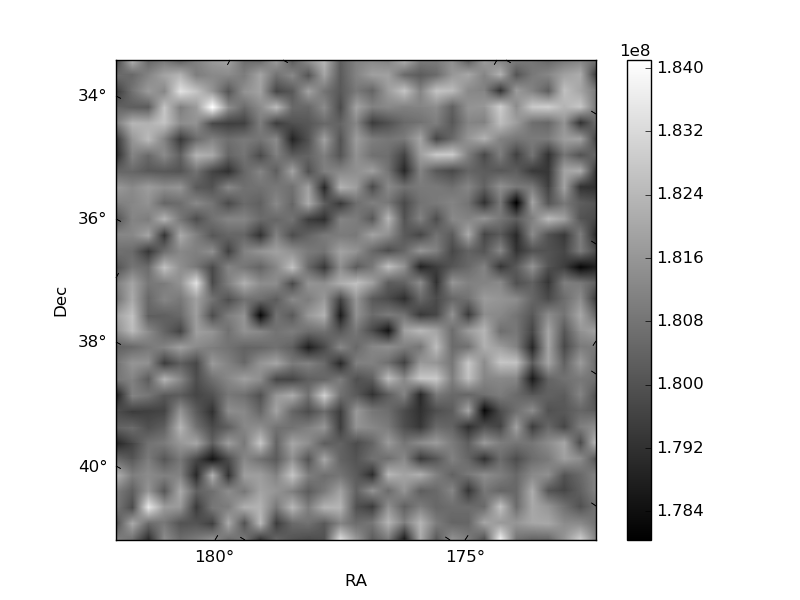
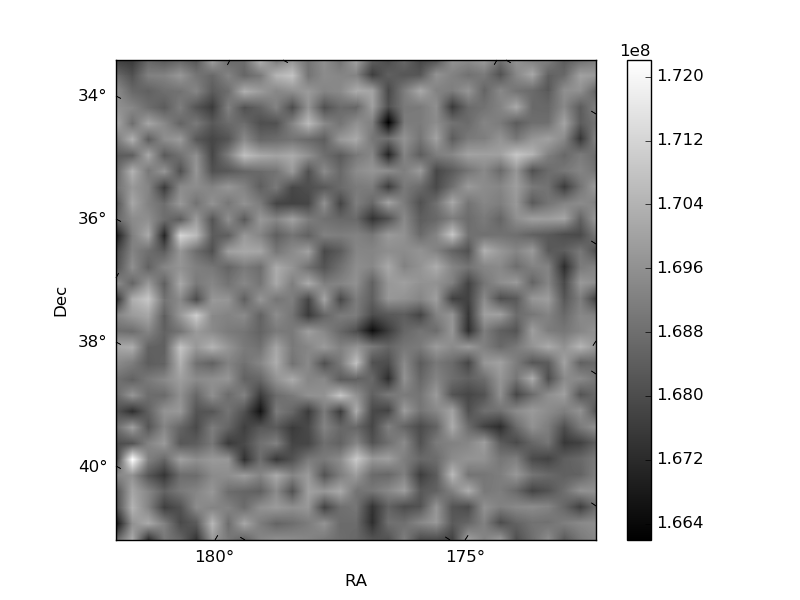
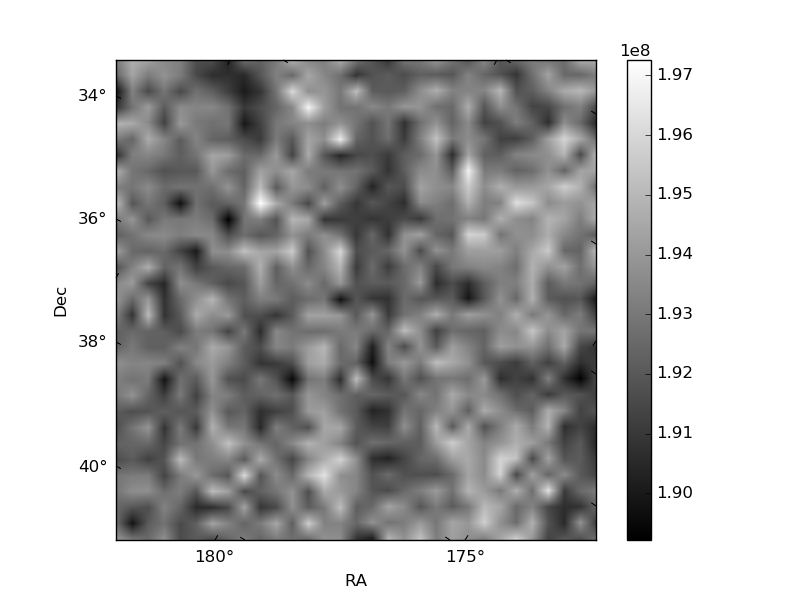
Histogram calculated using DETX and DETY for each event in the final _common_clean file
| Quadrant A | 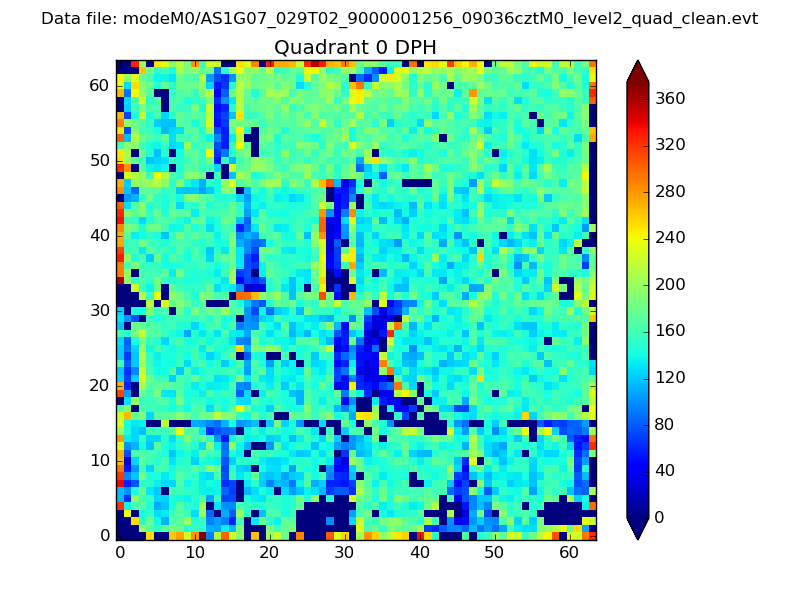 |
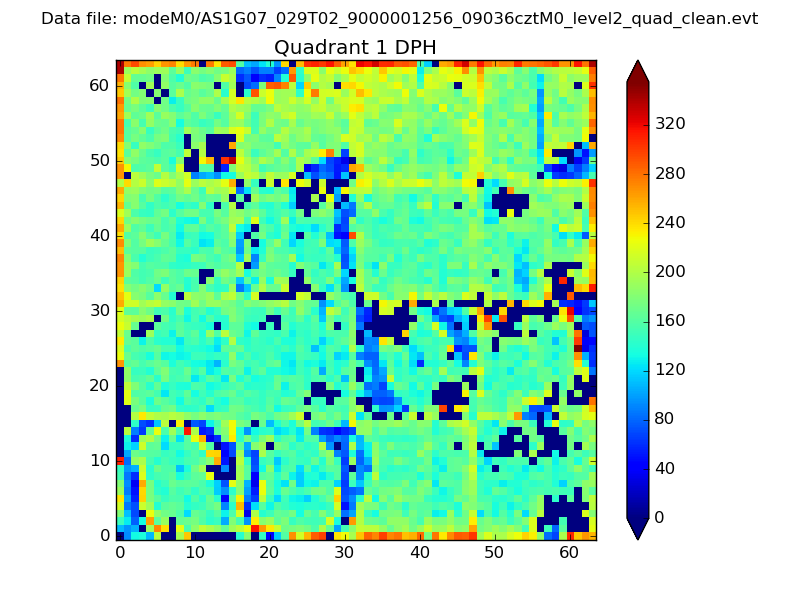 |
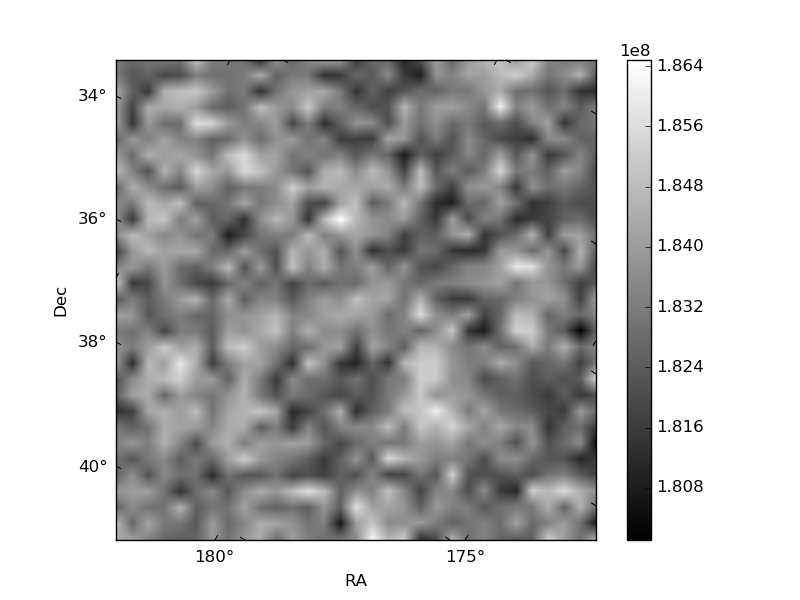
Quadrant B |
|---|---|---|---|
| Quadrant D | 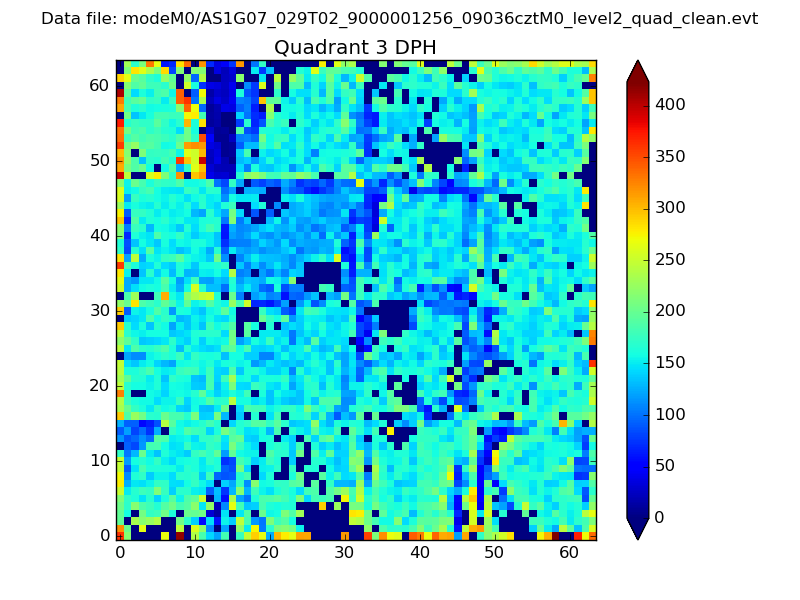 |
 |
Quadrant C |
| Plot type | Count rate plots | Images |
|---|---|---|
| Comparison with Poisson distribution Blue bars denote a histogram of data divided into 1 sec bins. Red curve is a Poisson curve with rate = median count rate of data. |
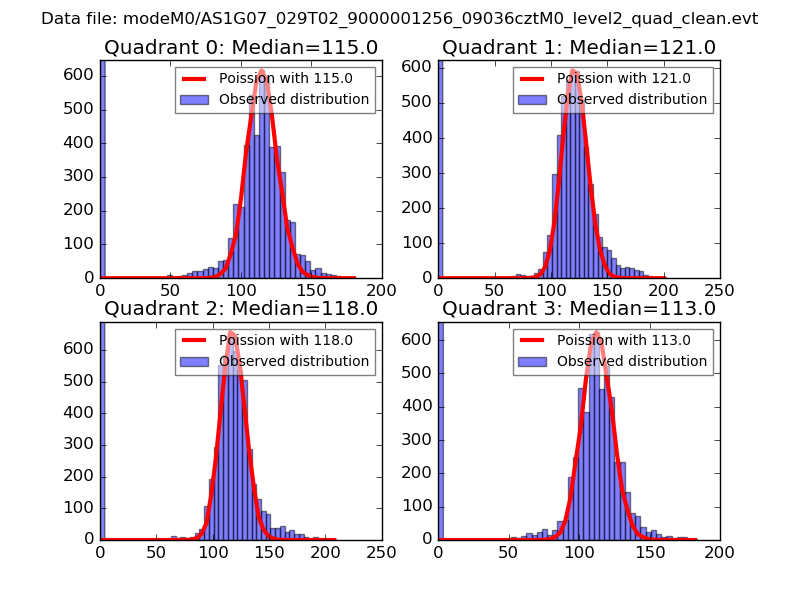 |
 |
| Quadrant-wise count rates Data is divided into 100 sec bins |
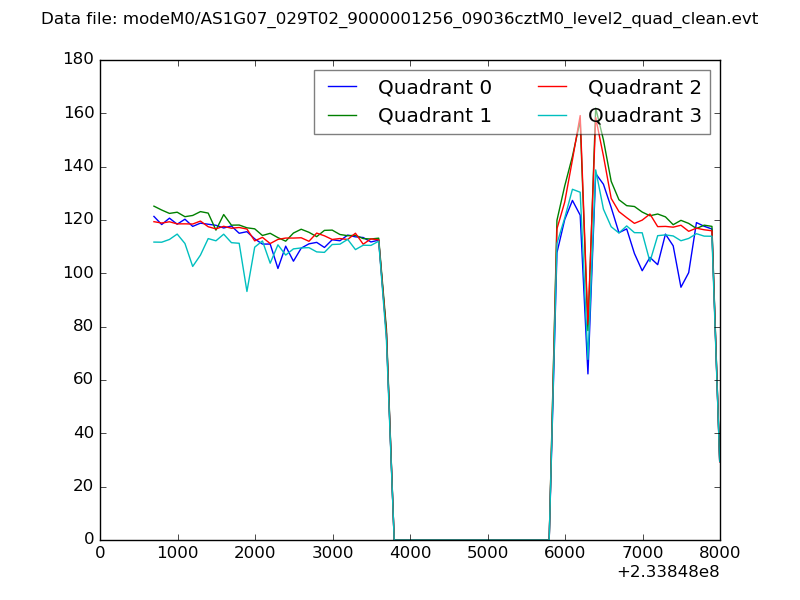 |
|
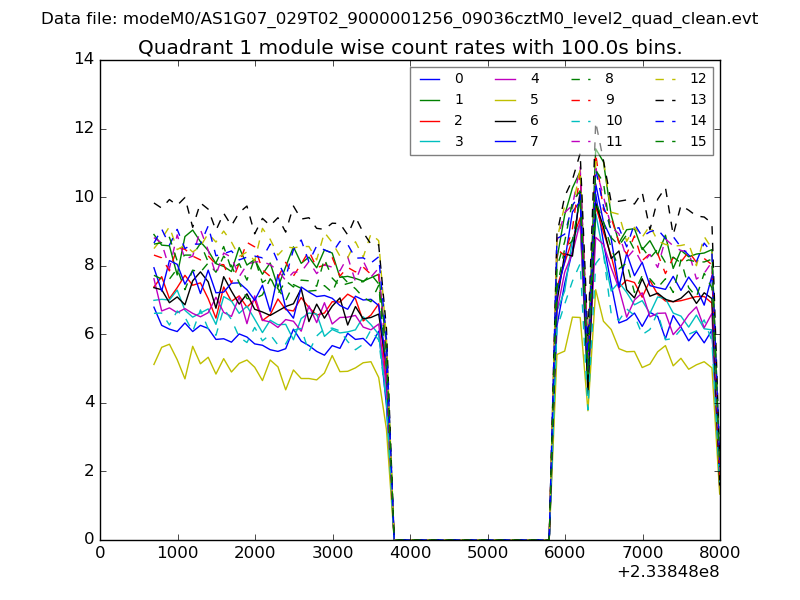
| Module-wise count rates for Quadrant A Data is divided into 100 sec bins |
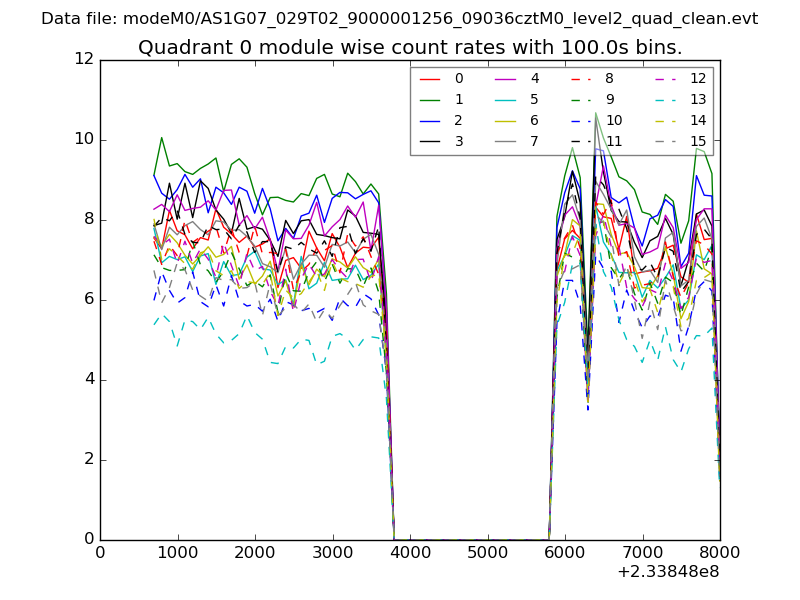 |
 |
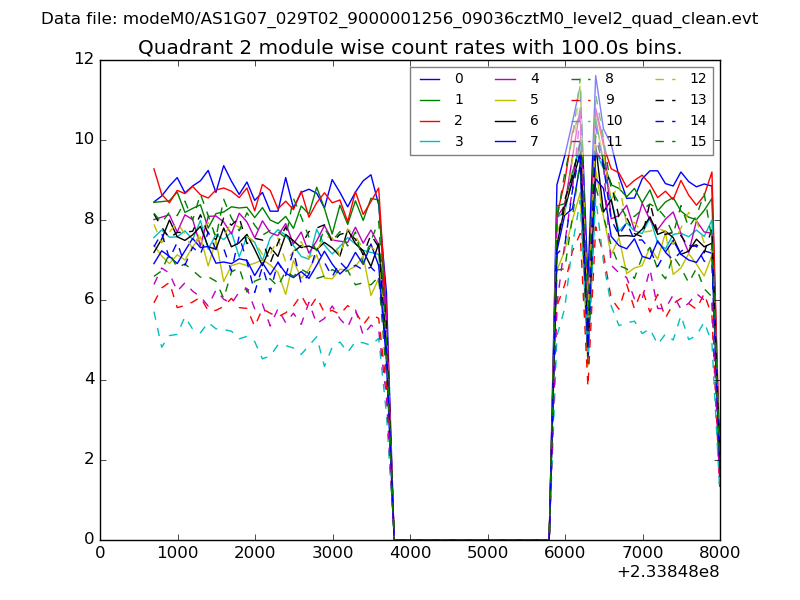
| Module-wise count rates for Quadrant B Data is divided into 100 sec bins |
 |
 |
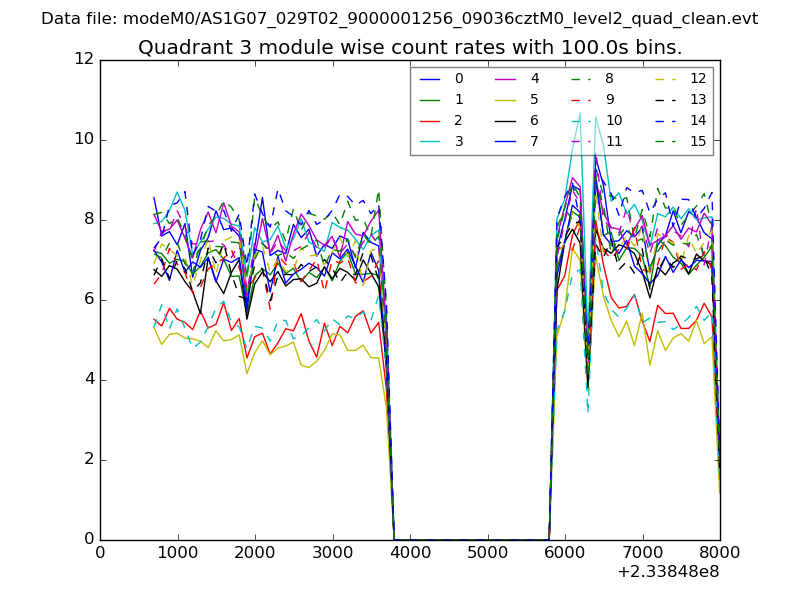
| Module-wise count rates for Quadrant C Data is divided into 100 sec bins |
 |
 |
| Module-wise count rates for Quadrant D Data is divided into 100 sec bins |
 |
 |
| Parameter | Plot |
|---|---|
| CZT HV Monitor | 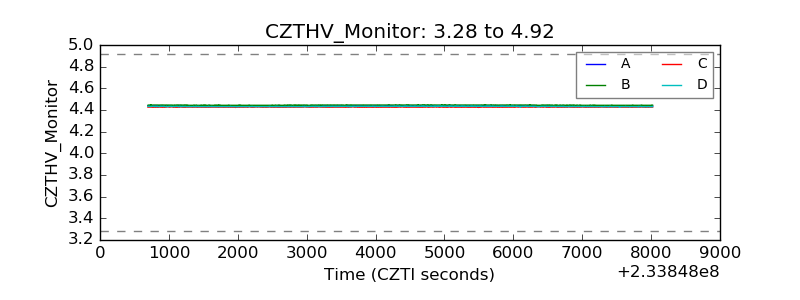 |
| D_VDD | 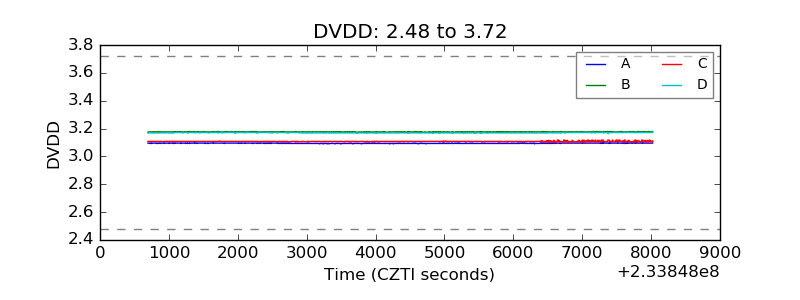 |
| Temperature 1 | 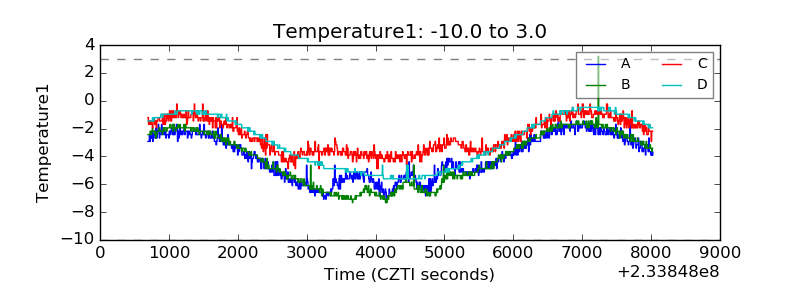 |
| Veto HV Monitor | 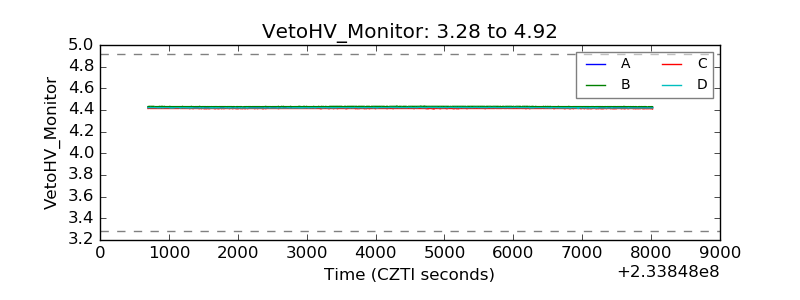 |
| Veto LLD | 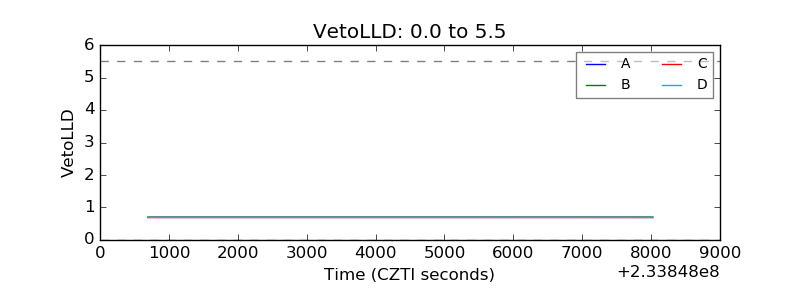 |
| Alpha Counter | 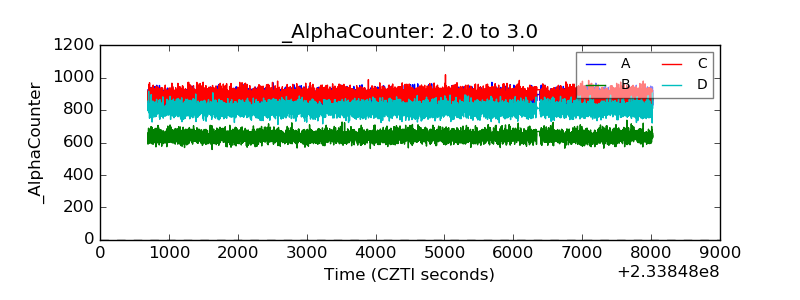 |
| _CPM_Rate | 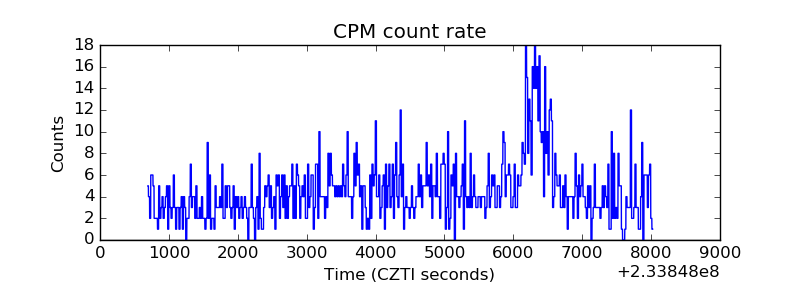 |
| CZT Counter | 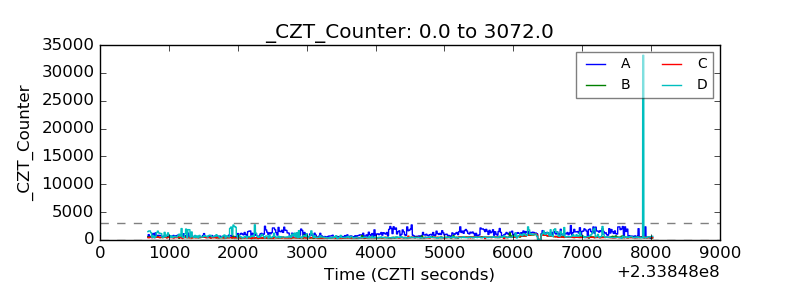 |
| +2.5 Volts monitor |  |
| +5 Volts monitor |  |
| _ROLL_ROT | 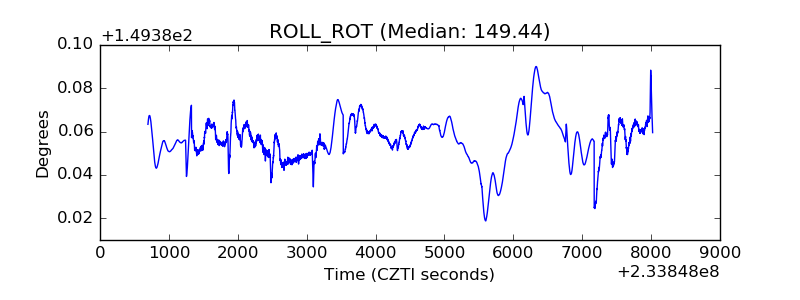 |
| _Roll_DEC | 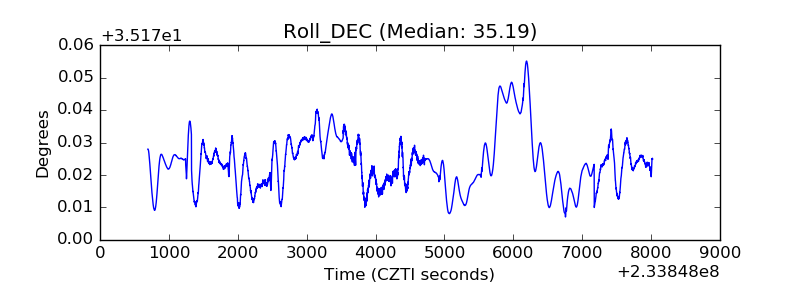 |
| _Roll_RA | 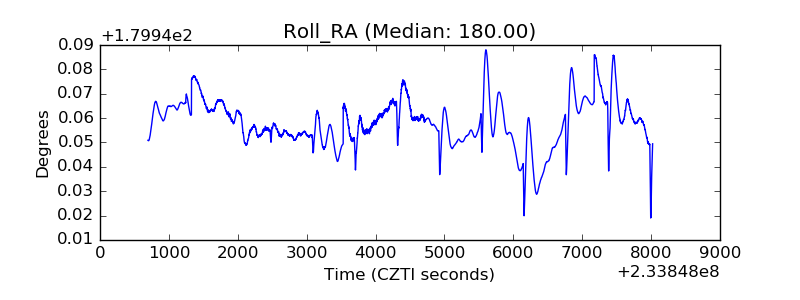 |
| Veto Counter | 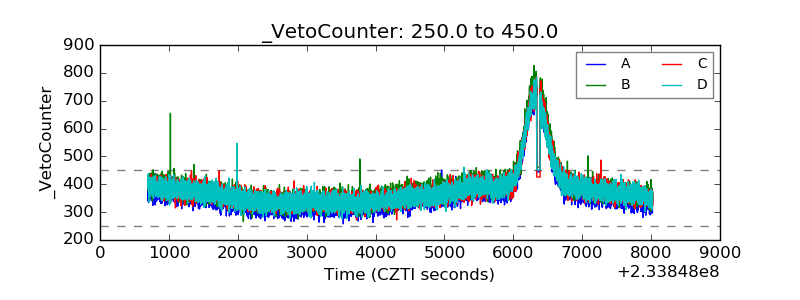 |