| Param | Original file | Final file |
|---|---|---|
| Filename | modeM0/AS1G07_029T02_9000001256_09040cztM0_level2.evt | modeM0/AS1G07_029T02_9000001256_09040cztM0_level2_quad_clean.evt |
| Size (bytes) | 1,221,848,640 | 194,932,800 |
| Size | 1.1 GB | 185.9 MB |
| Events in quadrant A | 11,359,422 | 1,192,409 |
| Events in quadrant B | 8,631,029 | 1,214,334 |
| Events in quadrant C | 7,142,854 | 1,201,884 |
| Events in quadrant D | 8,759,391 | 1,160,838 |
| Mode SS | |||
|---|---|---|---|
| Quadrant | BADHDUFLAG | Total packets | Discarded packets |
| A | 0 | 332 | 2 |
| B | 0 | 332 | 0 |
| C | 0 | 332 | 0 |
| D | 0 | 332 | 2 |
| Mode M9 | |||
|---|---|---|---|
| Quadrant | BADHDUFLAG | Total packets | Discarded packets |
| A | 0 | 12 | 0 |
| B | 0 | 12 | 0 |
| C | 0 | 12 | 0 |
| D | 0 | 12 | 0 |
| Mode M0 | |||
|---|---|---|---|
| Quadrant | BADHDUFLAG | Total packets | Discarded packets |
| A | 0 | 45160 | 290 |
| B | 0 | 36892 | 169 |
| C | 0 | 33490 | 159 |
| D | 0 | 37787 | 164 |
| Quadrant | Total seconds | Saturated seconds | Saturation percentage |
|---|---|---|---|
| A | 16440 | 394 | 2.396594% |
| B | 16453 | 239 | 1.452623% |
| C | 16453 | 46 | 0.279584% |
| D | 16456 | 220 | 1.336898% |
Noise dominated data is calculated using 1-second bins in cleaned event files. If a bin has >2000 counts, and if more than 50% of those come from <1% of pixels, then it is considered to be noise-dominated and hence unusable.
| Quadrant | # 1 sec bins | Bins with >0 counts | Bins with >2000 counts | High rate bins dominated by noise | Noise dominated (total time) | Noise dominated (detector-on time) | Marked lightcurve |
|---|---|---|---|---|---|---|---|
| A | 17677 | 16527 | 244 | 244 | 1.38% | 1.48% | 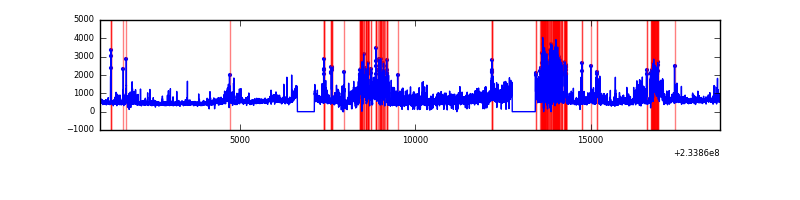 |
| B | 17677 | 16529 | 134 | 134 | 0.76% | 0.81% | 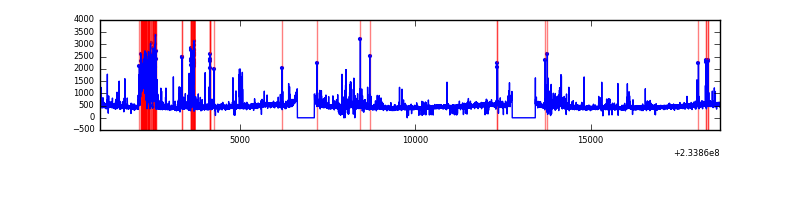 |
| C | 17677 | 16533 | 4 | 4 | 0.02% | 0.02% | 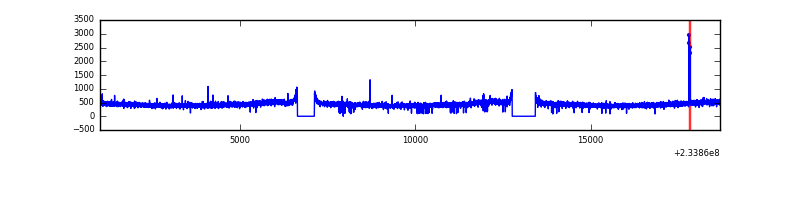 |
| D | 17677 | 16532 | 182 | 182 | 1.03% | 1.10% | 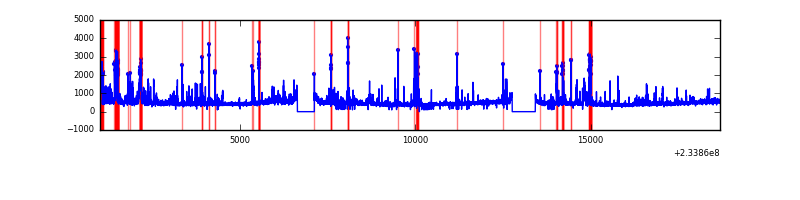 |
Top three noisy pixels from each quadrant. If the there are fewer than three noisy pixels in the level2.evt file, extra rows are filled as -1
| Pixel properties | Quadrant properties | ||||||
|---|---|---|---|---|---|---|---|
| Quadrant | DetID | PixID | Counts | Sigma | Mean | Median | Sigma |
| A | 8 | 5 | 3520268 | 9354.01 | 1864 | 1826 | 376.1 |
| A | 5 | 16 | 275929 | 728.72 | 1864 | 1826 | 376.1 |
| A | 1 | 162 | 144374 | 378.97 | 1864 | 1826 | 376.1 |
| B | 4 | 48 | 511573 | 1419.29 | 1881 | 1832 | 359.2 |
| B | 10 | 16 | 341607 | 946.05 | 1881 | 1832 | 359.2 |
| B | 0 | 230 | 140688 | 386.62 | 1881 | 1832 | 359.2 |
| C | 14 | 234 | 30402 | 67.18 | 1824 | 1828 | 425.3 |
| C | 13 | 61 | 13836 | 28.23 | 1824 | 1828 | 425.3 |
| C | 3 | 202 | 4586 | 6.48 | 1824 | 1828 | 425.3 |
| D | 6 | 225 | 1012532 | 2175.14 | 1806 | 1766 | 464.7 |
| D | 2 | 14 | 215605 | 460.17 | 1806 | 1766 | 464.7 |
| D | 1 | 52 | 188100 | 400.98 | 1806 | 1766 | 464.7 |
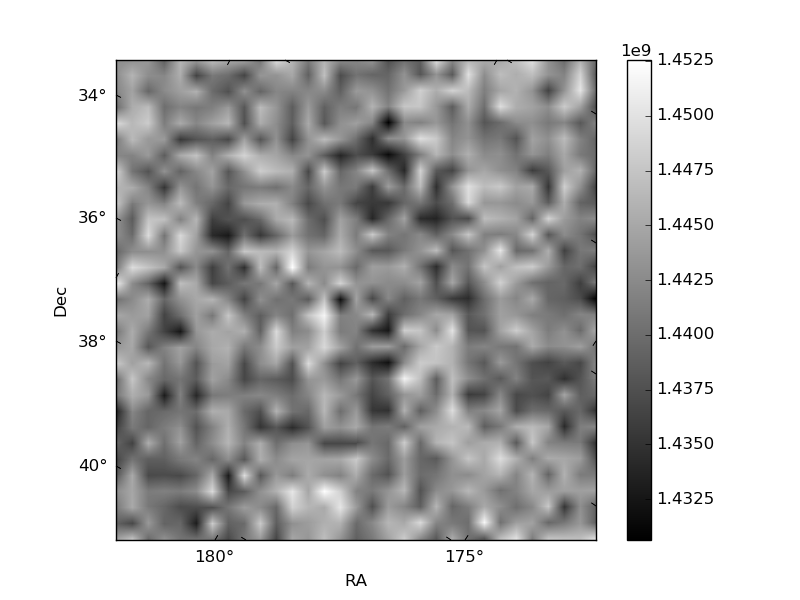
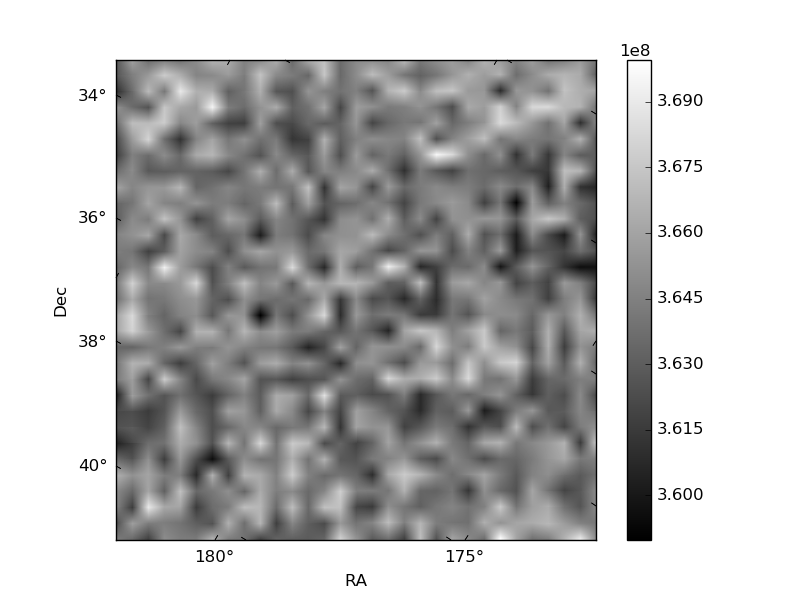
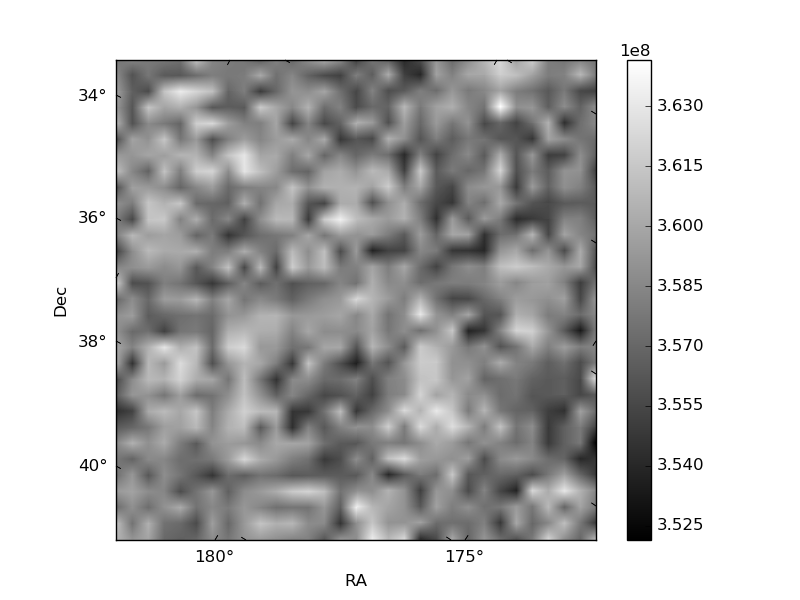
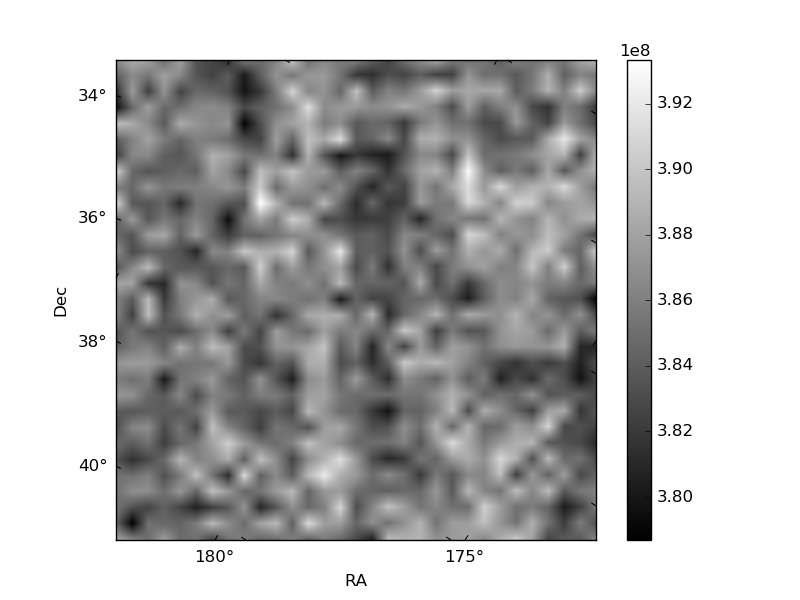
Histogram calculated using DETX and DETY for each event in the final _common_clean file
| Quadrant A | 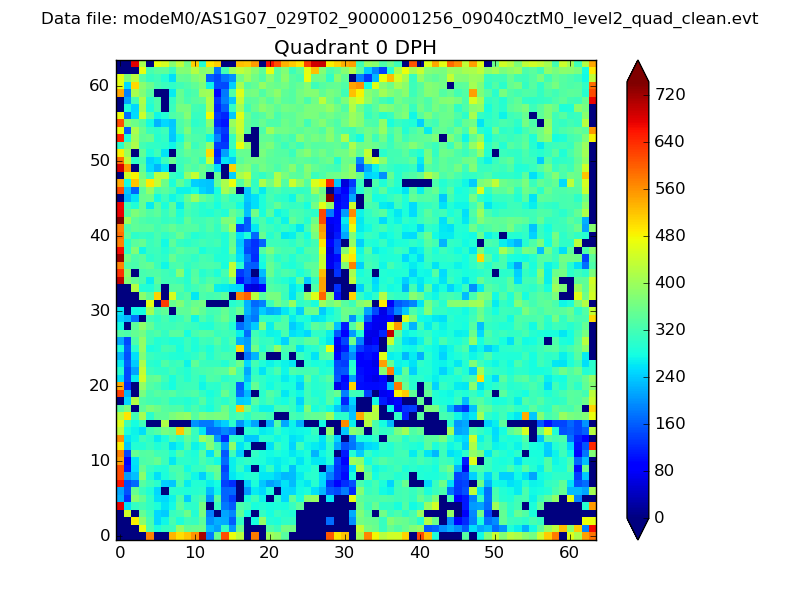 |
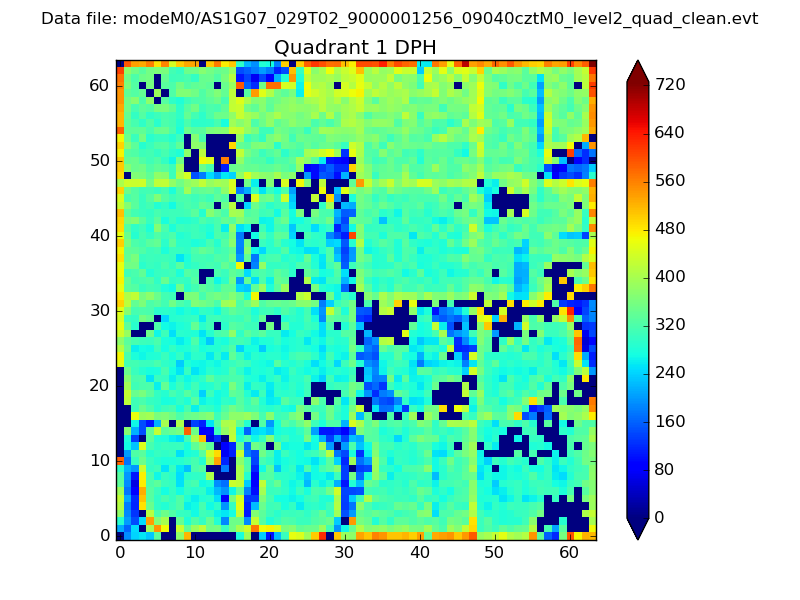 |
Quadrant B |
|---|---|---|---|
| Quadrant D | 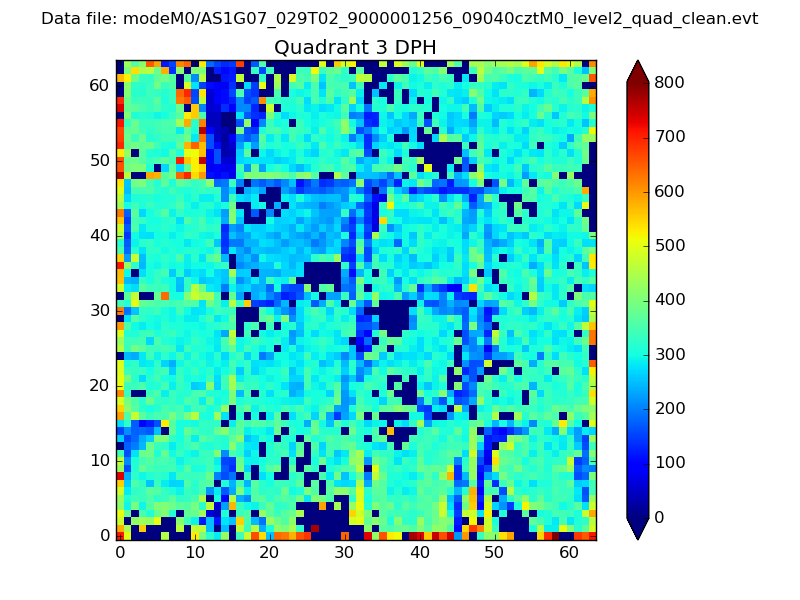 |
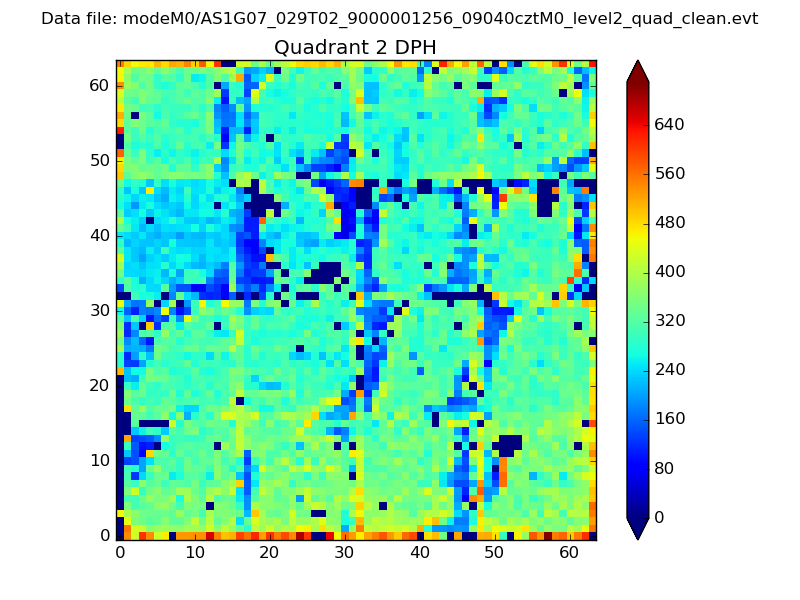 |
Quadrant C |
| Plot type | Count rate plots | Images |
|---|---|---|
| Comparison with Poisson distribution Blue bars denote a histogram of data divided into 1 sec bins. Red curve is a Poisson curve with rate = median count rate of data. |
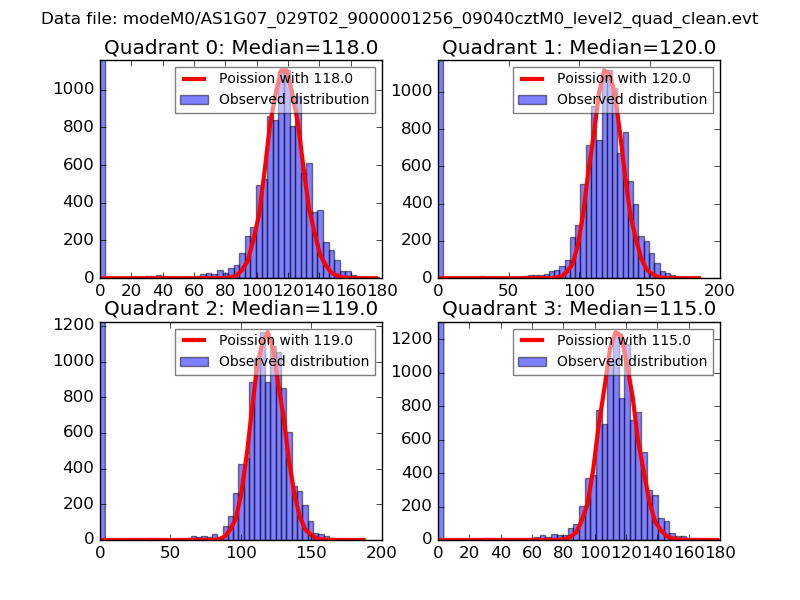 |
 |
| Quadrant-wise count rates Data is divided into 100 sec bins |
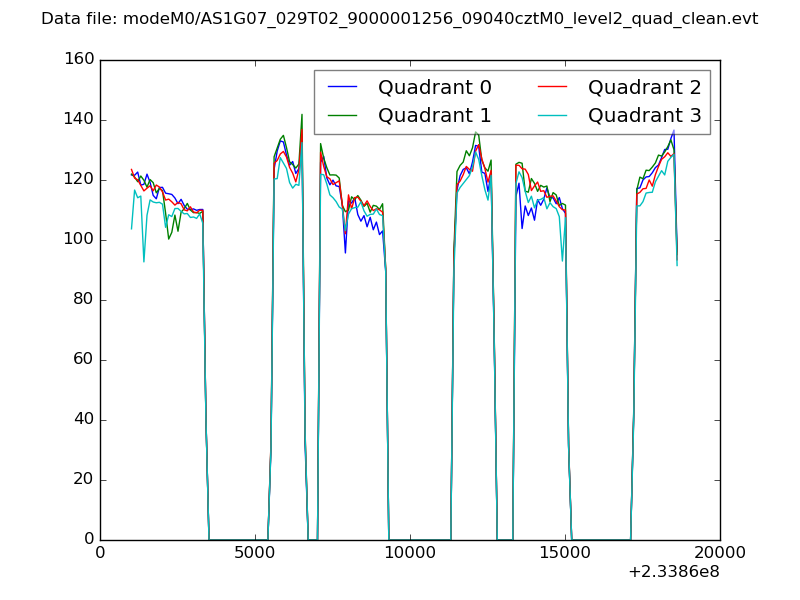 |
|
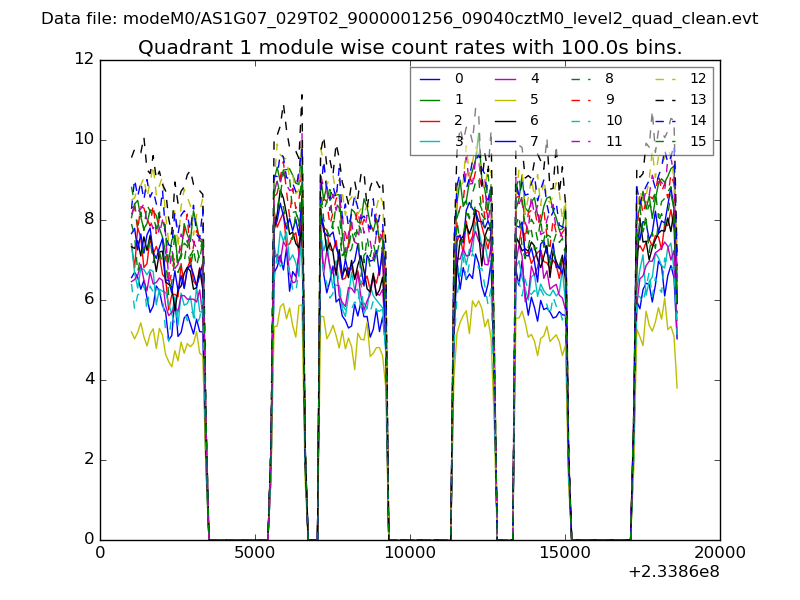
| Module-wise count rates for Quadrant A Data is divided into 100 sec bins |
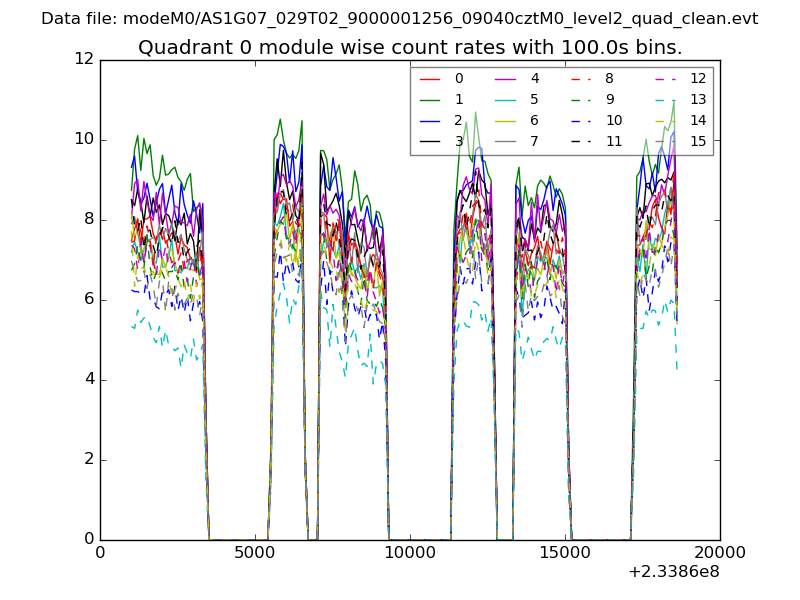 |
 |
| Module-wise count rates for Quadrant B Data is divided into 100 sec bins |
 |
 |
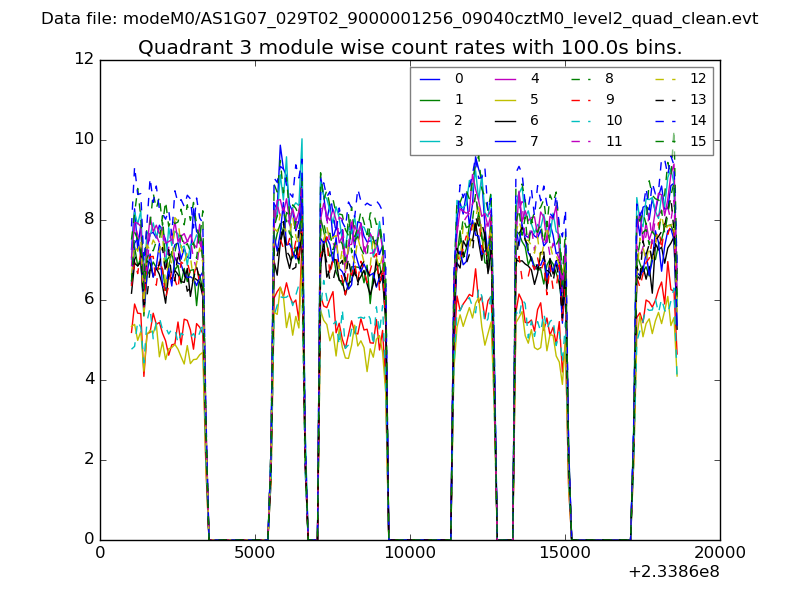
| Module-wise count rates for Quadrant C Data is divided into 100 sec bins |
 |
 |
| Module-wise count rates for Quadrant D Data is divided into 100 sec bins |
 |
 |
| Parameter | Plot |
|---|---|
| CZT HV Monitor | 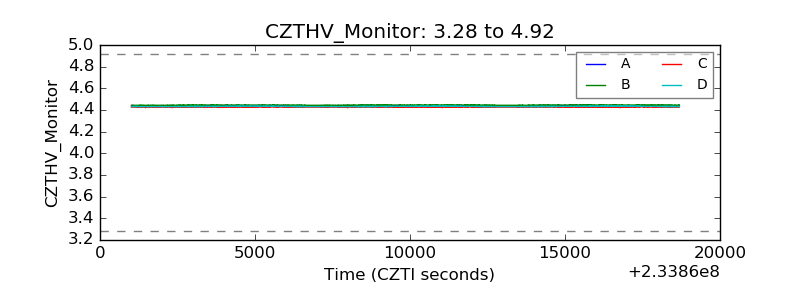 |
| D_VDD | 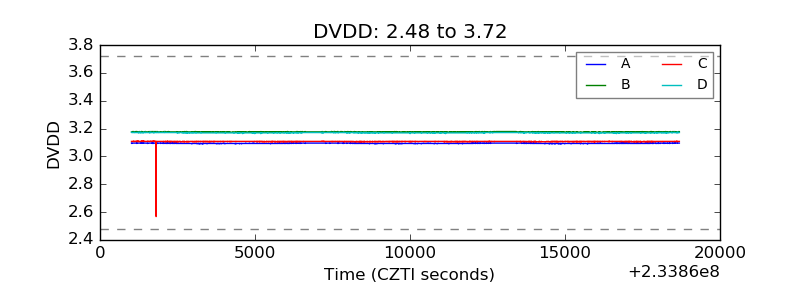 |
| Temperature 1 | 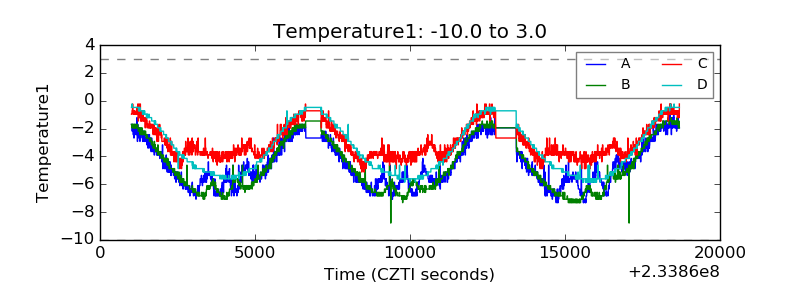 |
| Veto HV Monitor | 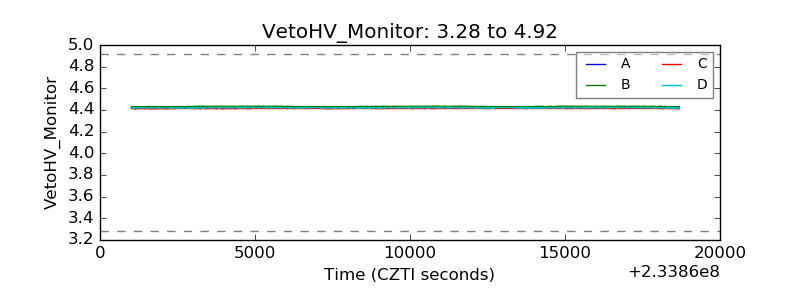 |
| Veto LLD | 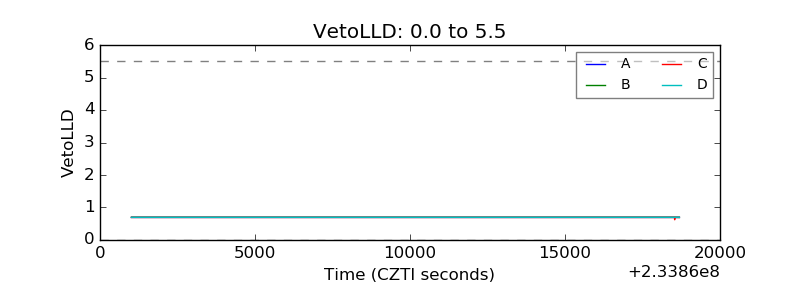 |
| Alpha Counter | 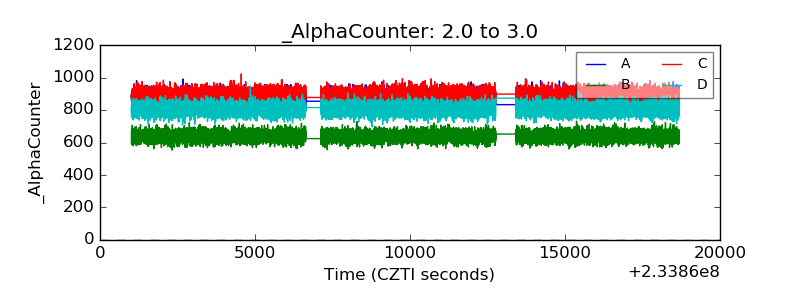 |
| _CPM_Rate | 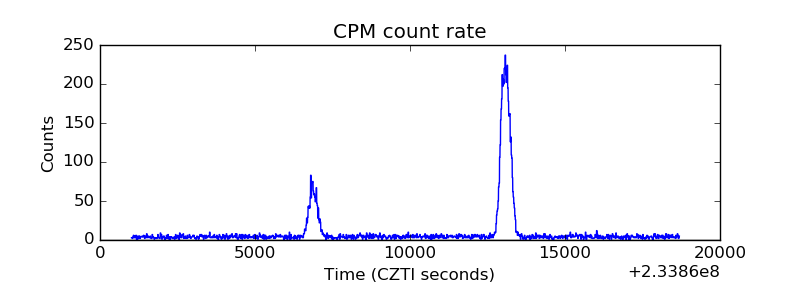 |
| CZT Counter | 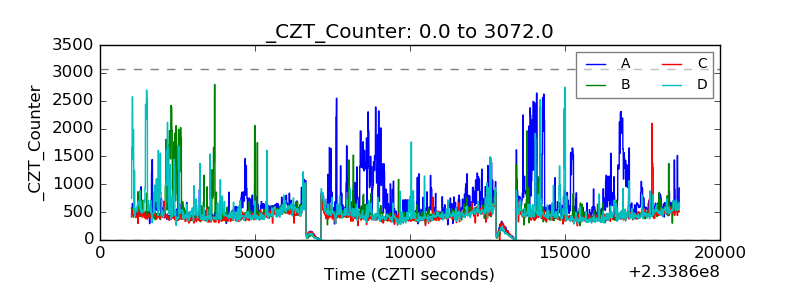 |
| +2.5 Volts monitor |  |
| +5 Volts monitor |  |
| _ROLL_ROT |  |
| _Roll_DEC | 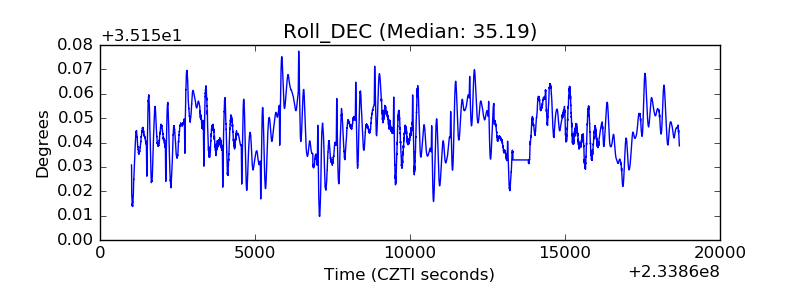 |
| _Roll_RA | 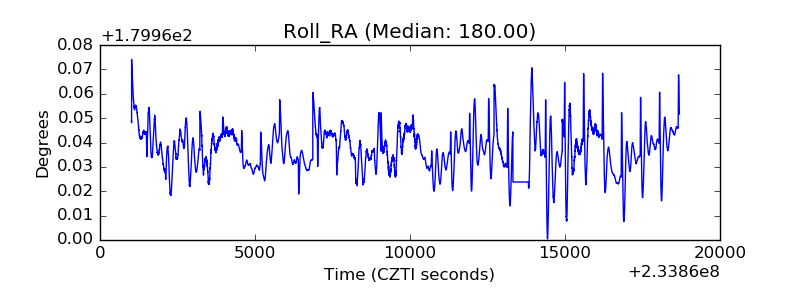 |
| Veto Counter | 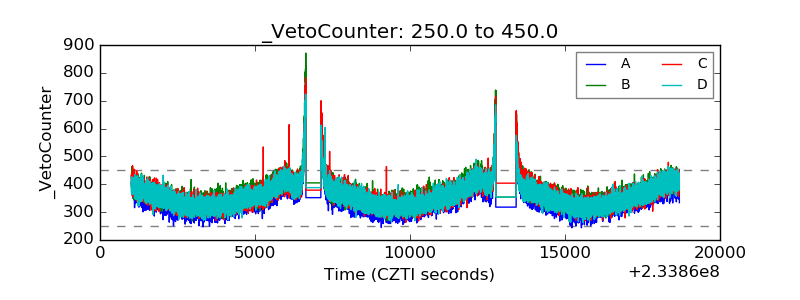 |