| Param | Original file | Final file |
|---|---|---|
| Filename | modeM0/AS1G07_033T01_9000001254_09017cztM0_level2.evt | modeM0/AS1G07_033T01_9000001254_09017cztM0_level2_quad_clean.evt |
| Size (bytes) | 1,545,062,400 | 278,343,360 |
| Size | 1.4 GB | 265.4 MB |
| Events in quadrant A | 13,207,560 | 1,770,478 |
| Events in quadrant B | 11,199,973 | 1,782,586 |
| Events in quadrant C | 9,489,240 | 1,751,867 |
| Events in quadrant D | 11,495,752 | 1,697,792 |
| Mode M9 | |||
|---|---|---|---|
| Quadrant | BADHDUFLAG | Total packets | Discarded packets |
| A | 0 | 49 | 0 |
| B | 0 | 49 | 0 |
| C | 0 | 49 | 0 |
| D | 0 | 49 | 0 |
| Mode M0 | |||
|---|---|---|---|
| Quadrant | BADHDUFLAG | Total packets | Discarded packets |
| A | 0 | 52407 | 13 |
| B | 0 | 46500 | 14 |
| C | 0 | 42421 | 6 |
| D | 0 | 47969 | 11 |
| Mode SS | |||
|---|---|---|---|
| Quadrant | BADHDUFLAG | Total packets | Discarded packets |
| A | 0 | 420 | 0 |
| B | 0 | 420 | 0 |
| C | 0 | 420 | 0 |
| D | 0 | 420 | 0 |
| Quadrant | Total seconds | Saturated seconds | Saturation percentage |
|---|---|---|---|
| A | 20743 | 424 | 2.044063% |
| B | 20740 | 592 | 2.854388% |
| C | 20744 | 159 | 0.766487% |
| D | 20743 | 440 | 2.121198% |
Noise dominated data is calculated using 1-second bins in cleaned event files. If a bin has >2000 counts, and if more than 50% of those come from <1% of pixels, then it is considered to be noise-dominated and hence unusable.
| Quadrant | # 1 sec bins | Bins with >0 counts | Bins with >2000 counts | High rate bins dominated by noise | Noise dominated (total time) | Noise dominated (detector-on time) | Marked lightcurve |
|---|---|---|---|---|---|---|---|
| A | 25594 | 20747 | 104 | 104 | 0.41% | 0.50% | 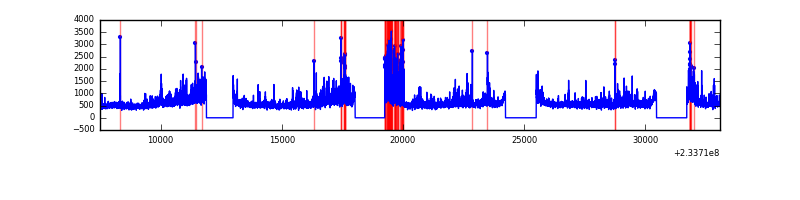 |
| B | 25589 | 20743 | 313 | 313 | 1.22% | 1.51% | 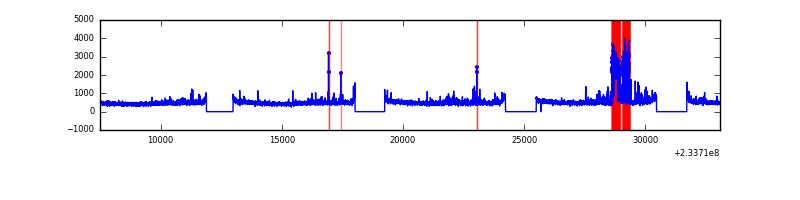 |
| C | 25594 | 20750 | 0 | 0 | 0.00% | 0.00% | 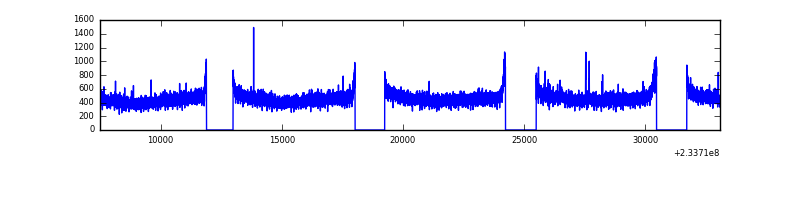 |
| D | 25594 | 20747 | 241 | 241 | 0.94% | 1.16% | 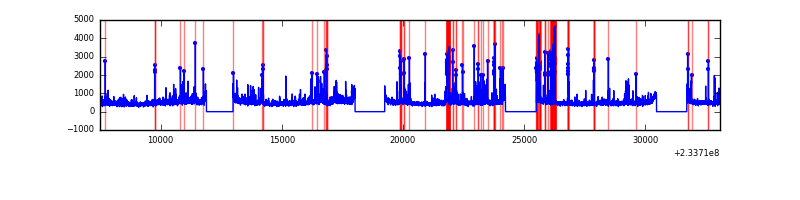 |
Top three noisy pixels from each quadrant. If the there are fewer than three noisy pixels in the level2.evt file, extra rows are filled as -1
| Pixel properties | Quadrant properties | ||||||
|---|---|---|---|---|---|---|---|
| Quadrant | DetID | PixID | Counts | Sigma | Mean | Median | Sigma |
| A | 8 | 5 | 2767402 | 5528.26 | 2522 | 2470 | 500.1 |
| A | 3 | 1 | 380023 | 754.89 | 2522 | 2470 | 500.1 |
| A | 1 | 162 | 149602 | 294.18 | 2522 | 2470 | 500.1 |
| B | 10 | 16 | 989777 | 2102.21 | 2516 | 2457 | 469.7 |
| B | 4 | 48 | 164137 | 344.25 | 2516 | 2457 | 469.7 |
| B | 0 | 214 | 106759 | 222.08 | 2516 | 2457 | 469.7 |
| C | 13 | 61 | 18638 | 29.17 | 2431 | 2442 | 555.3 |
| C | 7 | 223 | 7174 | 8.52 | 2431 | 2442 | 555.3 |
| C | 12 | 4 | 6235 | 6.83 | 2431 | 2442 | 555.3 |
| D | 6 | 225 | 695690 | 1088.48 | 2419 | 2356 | 637.0 |
| D | 1 | 52 | 381953 | 595.93 | 2419 | 2356 | 637.0 |
| D | 4 | 95 | 359815 | 561.18 | 2419 | 2356 | 637.0 |
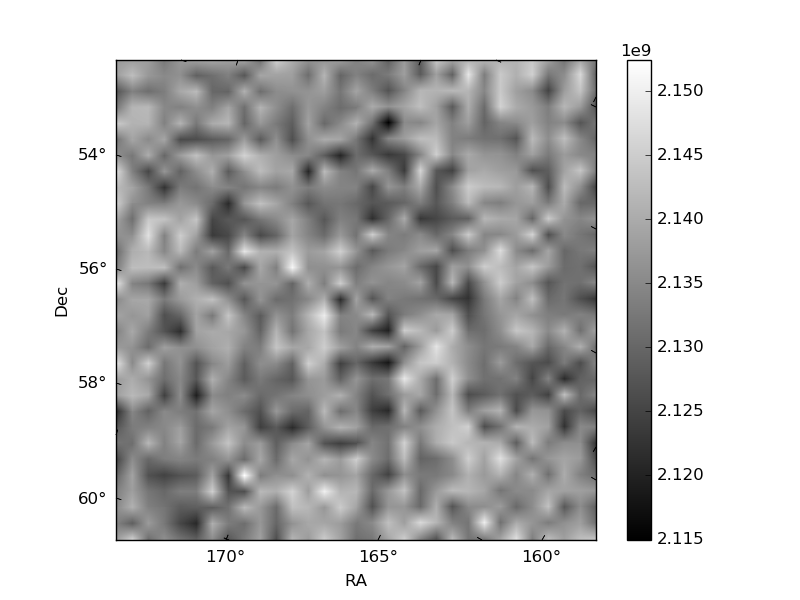
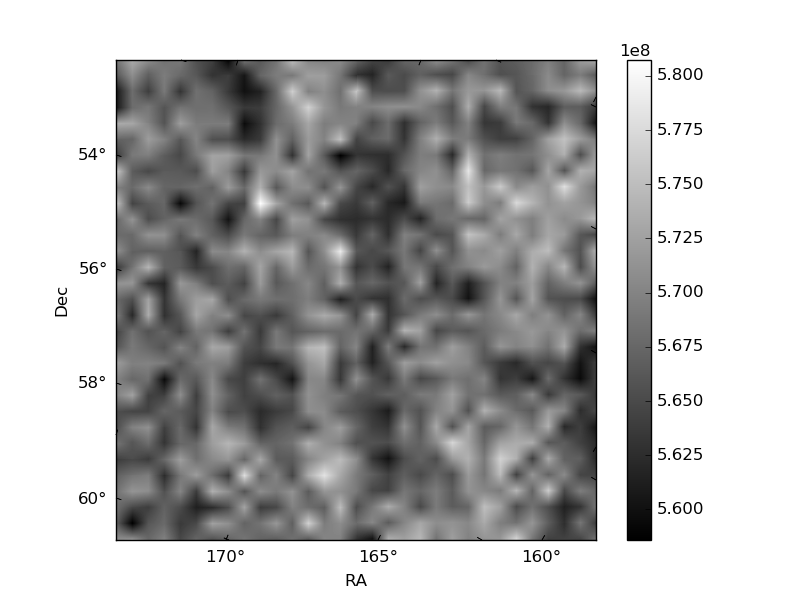
Histogram calculated using DETX and DETY for each event in the final _common_clean file
| Quadrant A | 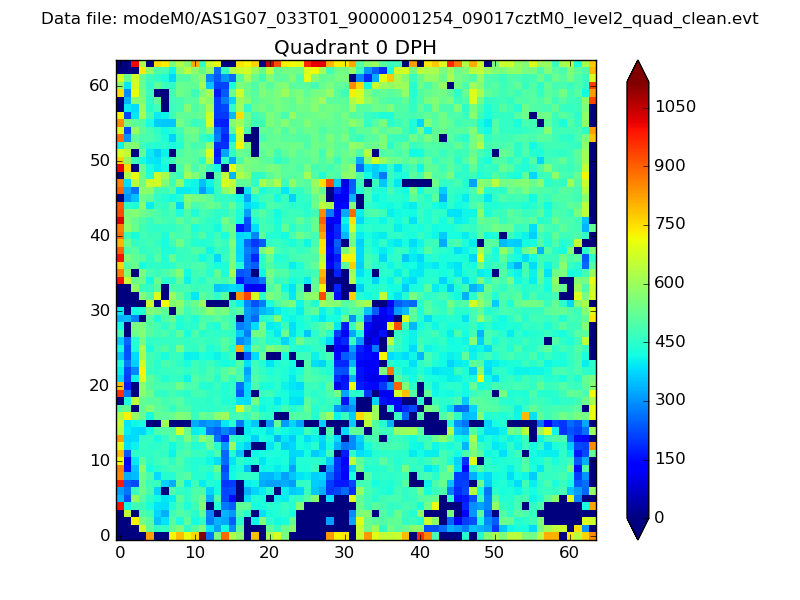 |
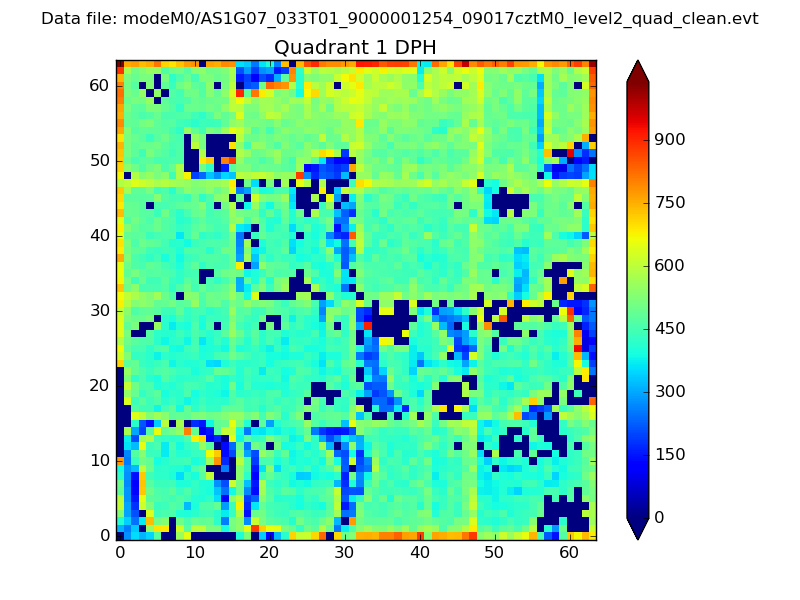 |
Quadrant B |
|---|---|---|---|
| Quadrant D | 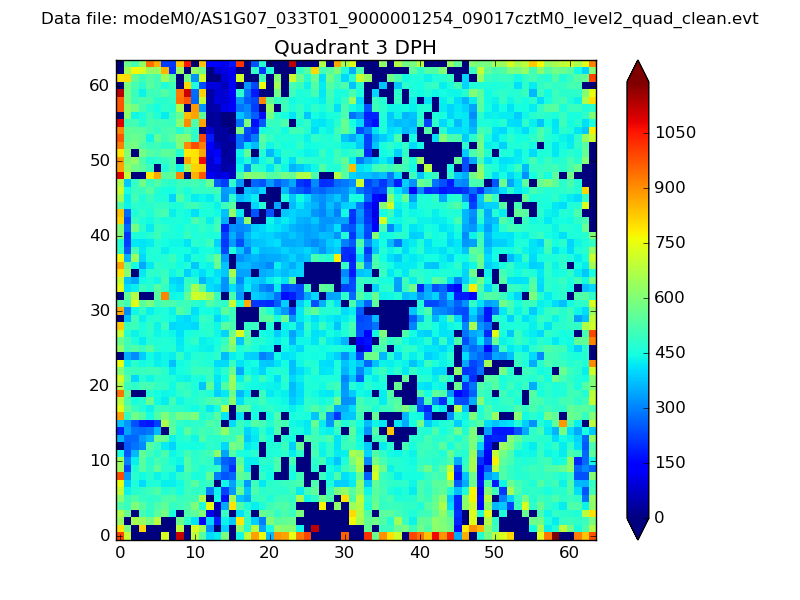 |
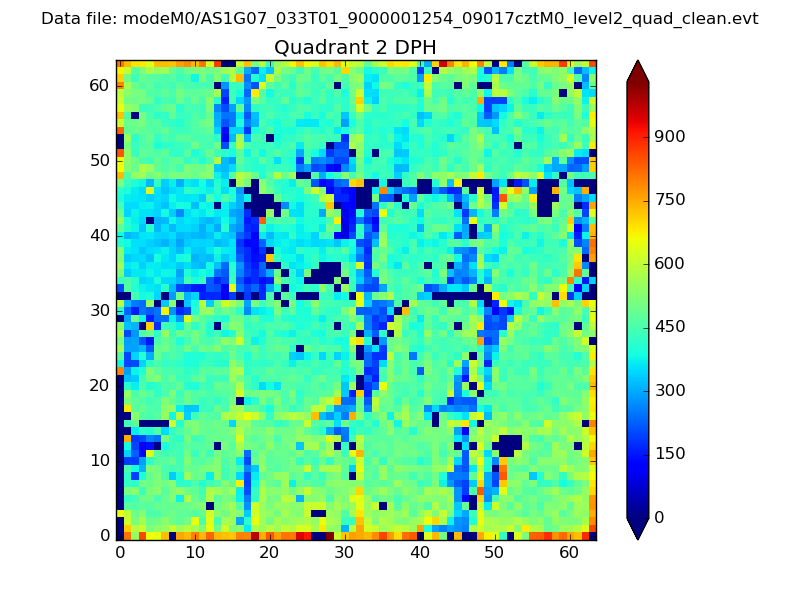 |
Quadrant C |
| Plot type | Count rate plots | Images |
|---|---|---|
| Comparison with Poisson distribution Blue bars denote a histogram of data divided into 1 sec bins. Red curve is a Poisson curve with rate = median count rate of data. |
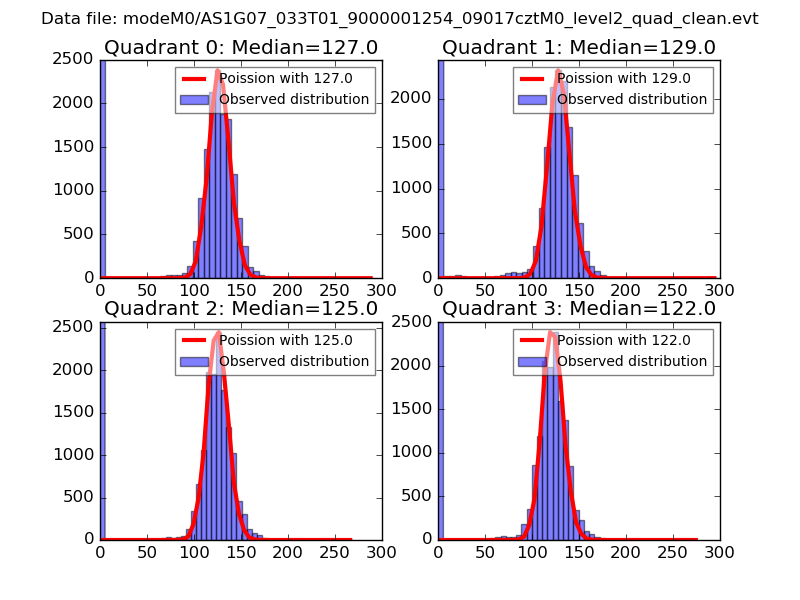 |
 |
| Quadrant-wise count rates Data is divided into 100 sec bins |
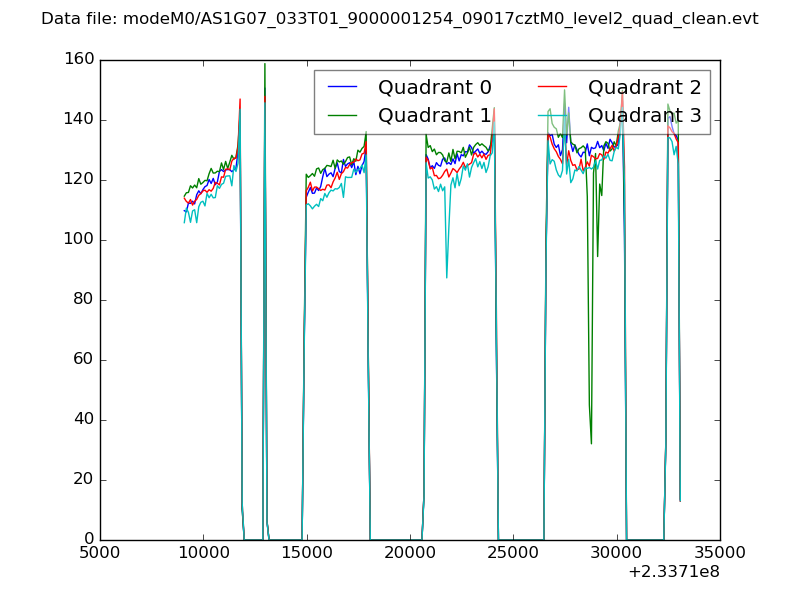 |
|
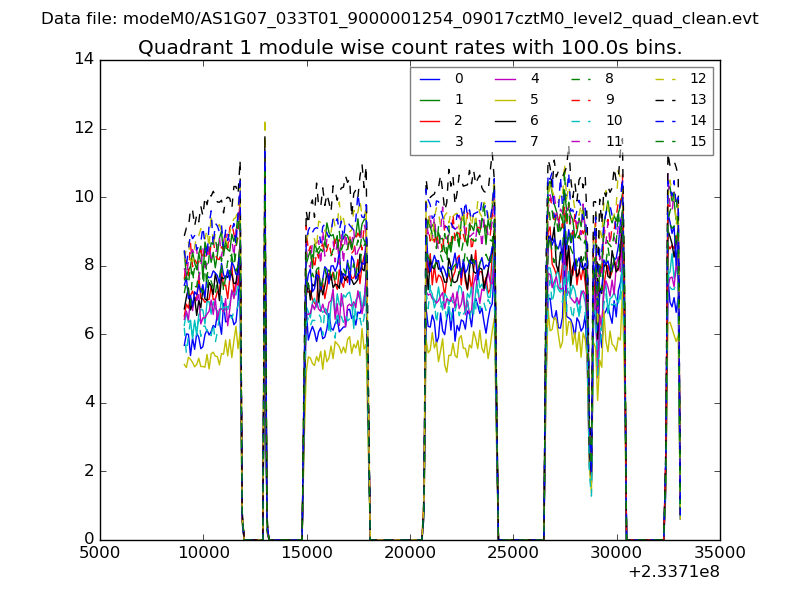
| Module-wise count rates for Quadrant A Data is divided into 100 sec bins |
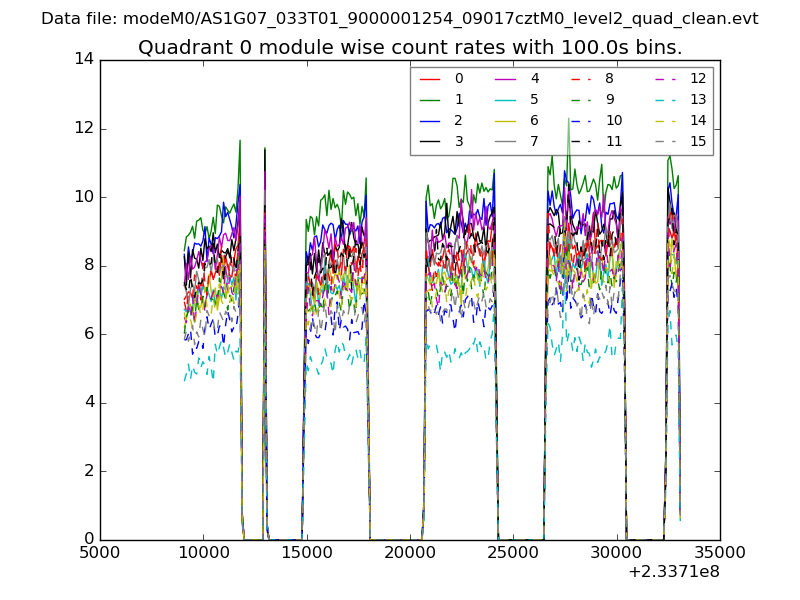 |
 |
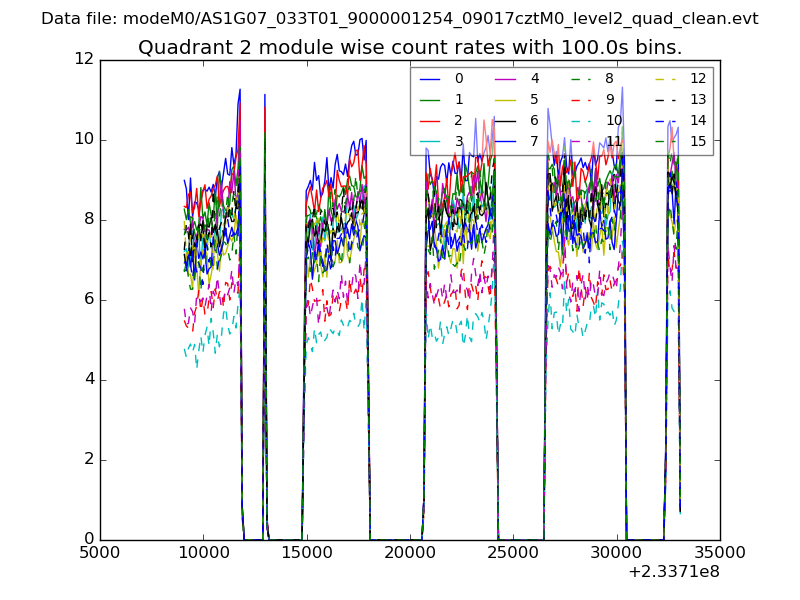
| Module-wise count rates for Quadrant B Data is divided into 100 sec bins |
 |
 |
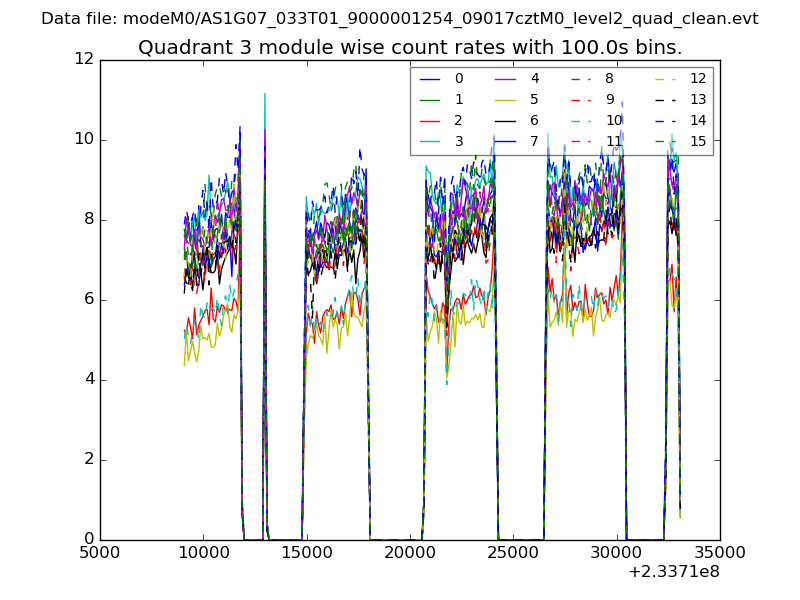
| Module-wise count rates for Quadrant C Data is divided into 100 sec bins |
 |
 |
| Module-wise count rates for Quadrant D Data is divided into 100 sec bins |
 |
 |
| Parameter | Plot |
|---|---|
| CZT HV Monitor | 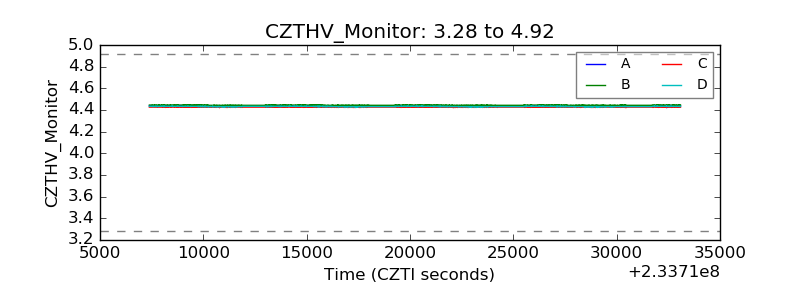 |
| D_VDD | 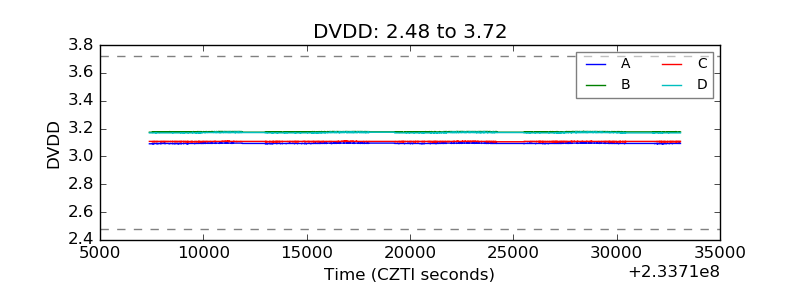 |
| Temperature 1 | 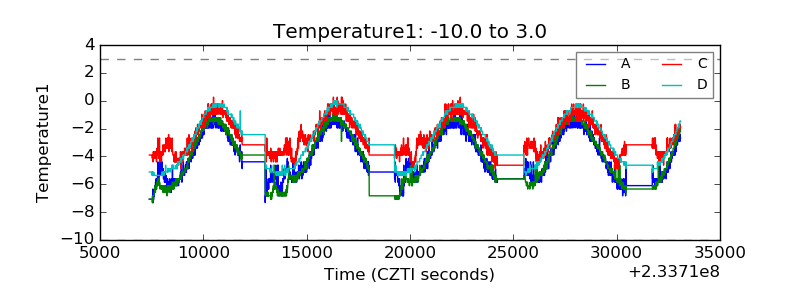 |
| Veto HV Monitor | 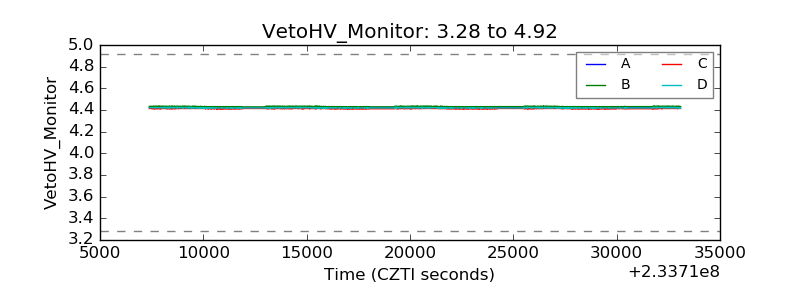 |
| Veto LLD | 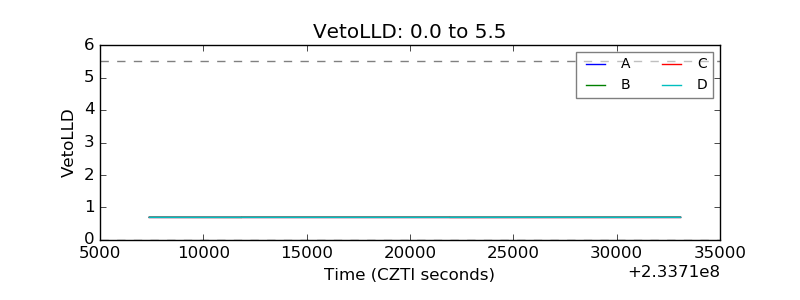 |
| Alpha Counter | 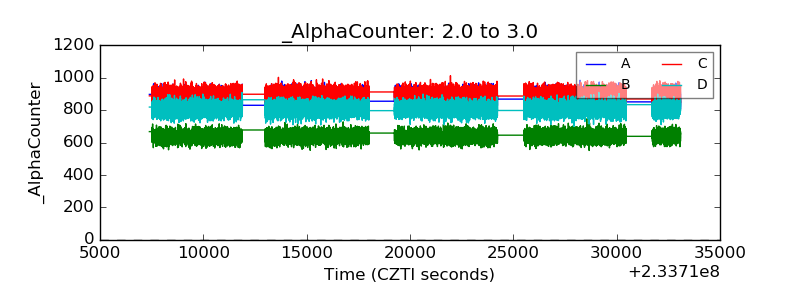 |
| _CPM_Rate | 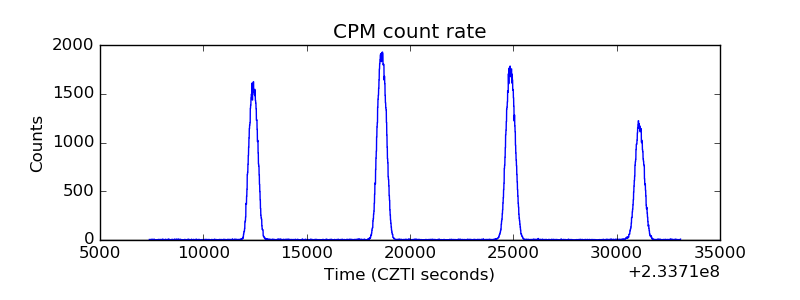 |
| CZT Counter | 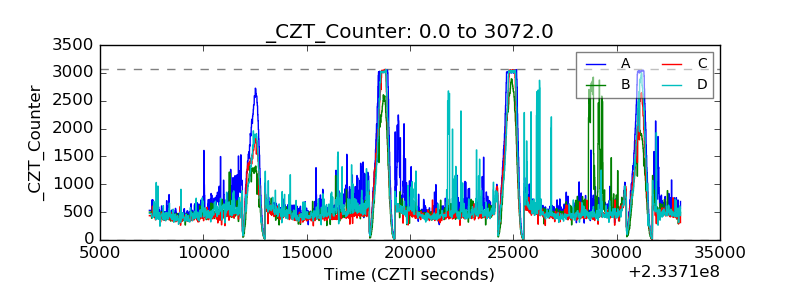 |
| +2.5 Volts monitor |  |
| +5 Volts monitor |  |
| _ROLL_ROT | 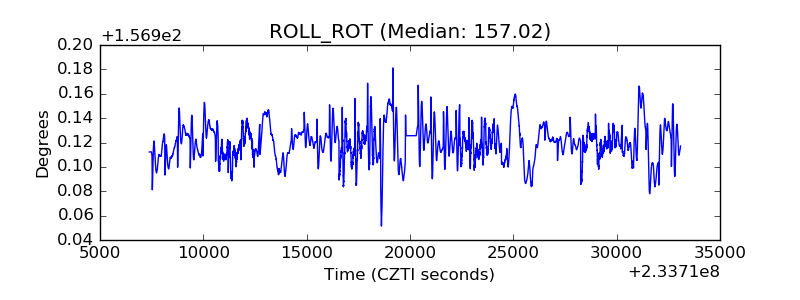 |
| _Roll_DEC |  |
| _Roll_RA | 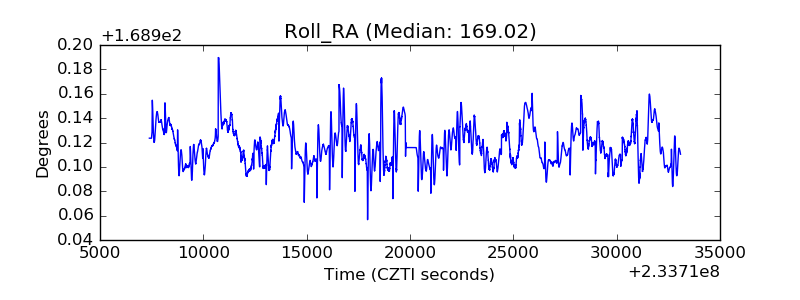 |
| Veto Counter | 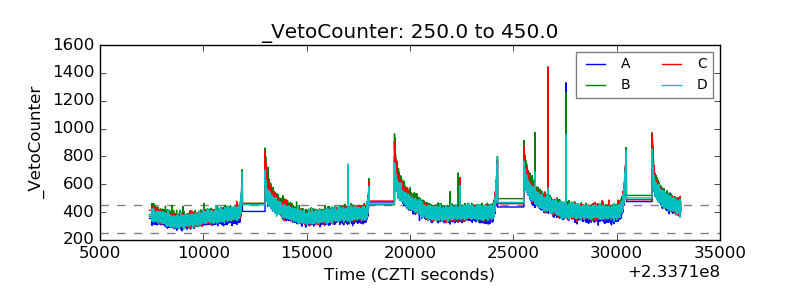 |