| Param | Original file | Final file |
|---|---|---|
| Filename | modeM0/AS1G07_033T01_9000001254_09018cztM0_level2.evt | modeM0/AS1G07_033T01_9000001254_09018cztM0_level2_quad_clean.evt |
| Size (bytes) | 1,800,593,280 | 338,538,240 |
| Size | 1.7 GB | 322.9 MB |
| Events in quadrant A | 15,227,935 | 2,179,024 |
| Events in quadrant B | 13,047,636 | 2,188,224 |
| Events in quadrant C | 11,001,708 | 2,148,220 |
| Events in quadrant D | 13,626,278 | 2,079,083 |
| Mode M9 | |||
|---|---|---|---|
| Quadrant | BADHDUFLAG | Total packets | Discarded packets |
| A | 0 | 54 | 0 |
| B | 0 | 54 | 0 |
| C | 0 | 54 | 0 |
| D | 0 | 54 | 0 |
| Mode M0 | |||
|---|---|---|---|
| Quadrant | BADHDUFLAG | Total packets | Discarded packets |
| A | 0 | 60627 | 83 |
| B | 0 | 54172 | 69 |
| C | 0 | 49322 | 45 |
| D | 0 | 56559 | 64 |
| Mode SS | |||
|---|---|---|---|
| Quadrant | BADHDUFLAG | Total packets | Discarded packets |
| A | 0 | 488 | 2 |
| B | 0 | 488 | 0 |
| C | 0 | 488 | 0 |
| D | 0 | 488 | 0 |
| Quadrant | Total seconds | Saturated seconds | Saturation percentage |
|---|---|---|---|
| A | 24122 | 443 | 1.836498% |
| B | 24125 | 663 | 2.748187% |
| C | 24129 | 164 | 0.679680% |
| D | 24129 | 497 | 2.059762% |
Noise dominated data is calculated using 1-second bins in cleaned event files. If a bin has >2000 counts, and if more than 50% of those come from <1% of pixels, then it is considered to be noise-dominated and hence unusable.
| Quadrant | # 1 sec bins | Bins with >0 counts | Bins with >2000 counts | High rate bins dominated by noise | Noise dominated (total time) | Noise dominated (detector-on time) | Marked lightcurve |
|---|---|---|---|---|---|---|---|
| A | 28994 | 24150 | 110 | 110 | 0.38% | 0.46% | 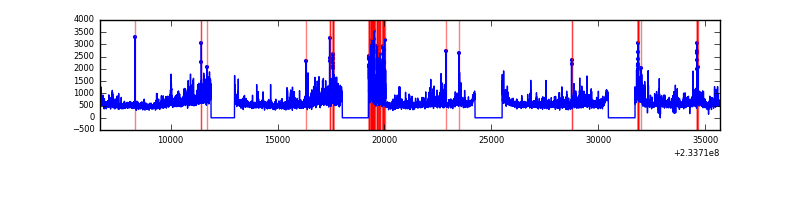 |
| B | 28994 | 24149 | 347 | 347 | 1.20% | 1.44% | 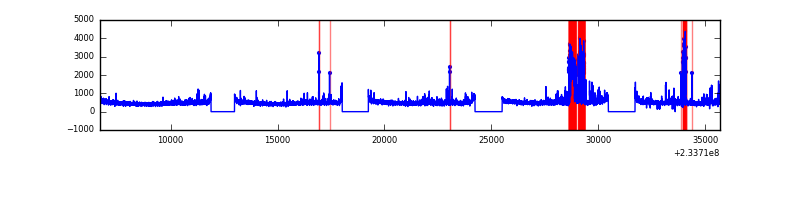 |
| C | 28994 | 24151 | 0 | 0 | 0.00% | 0.00% | 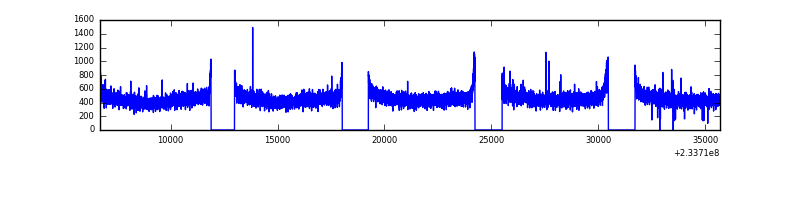 |
| D | 28994 | 24149 | 284 | 284 | 0.98% | 1.18% | 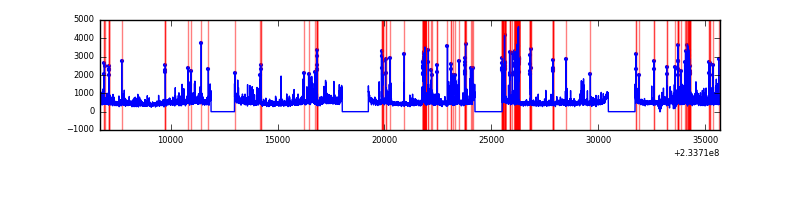 |
Top three noisy pixels from each quadrant. If the there are fewer than three noisy pixels in the level2.evt file, extra rows are filled as -1
| Pixel properties | Quadrant properties | ||||||
|---|---|---|---|---|---|---|---|
| Quadrant | DetID | PixID | Counts | Sigma | Mean | Median | Sigma |
| A | 8 | 5 | 3162883 | 5461.13 | 2921 | 2865 | 578.6 |
| A | 3 | 1 | 396026 | 679.46 | 2921 | 2865 | 578.6 |
| A | 1 | 162 | 188013 | 319.97 | 2921 | 2865 | 578.6 |
| B | 10 | 16 | 1135290 | 2087.18 | 2912 | 2845 | 542.6 |
| B | 4 | 48 | 264572 | 482.38 | 2912 | 2845 | 542.6 |
| B | 0 | 214 | 141748 | 256.01 | 2912 | 2845 | 542.6 |
| C | 13 | 61 | 21635 | 29.36 | 2815 | 2827 | 640.5 |
| C | 14 | 67 | 8336 | 8.6 | 2815 | 2827 | 640.5 |
| C | 1 | 3 | 7785 | 7.74 | 2815 | 2827 | 640.5 |
| D | 6 | 225 | 976796 | 1310.32 | 2803 | 2731 | 743.4 |
| D | 4 | 95 | 555202 | 743.19 | 2803 | 2731 | 743.4 |
| D | 1 | 52 | 419404 | 560.51 | 2803 | 2731 | 743.4 |
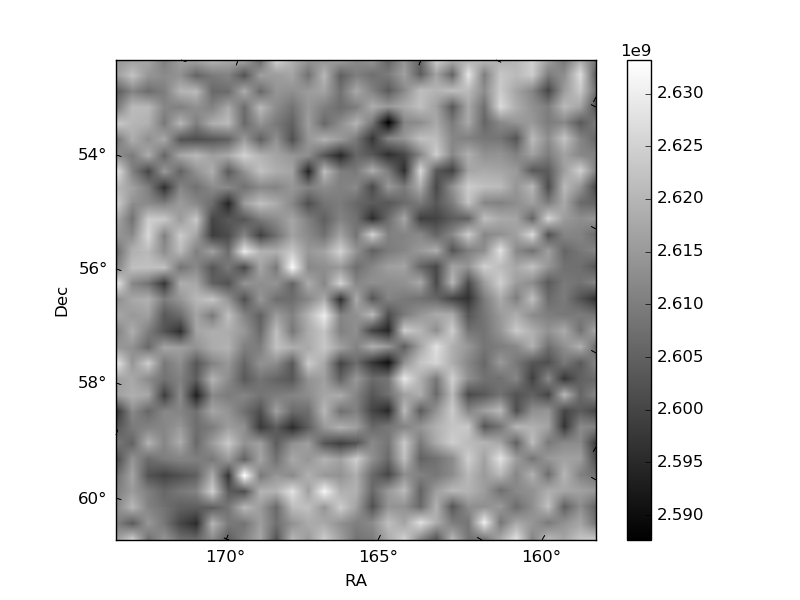
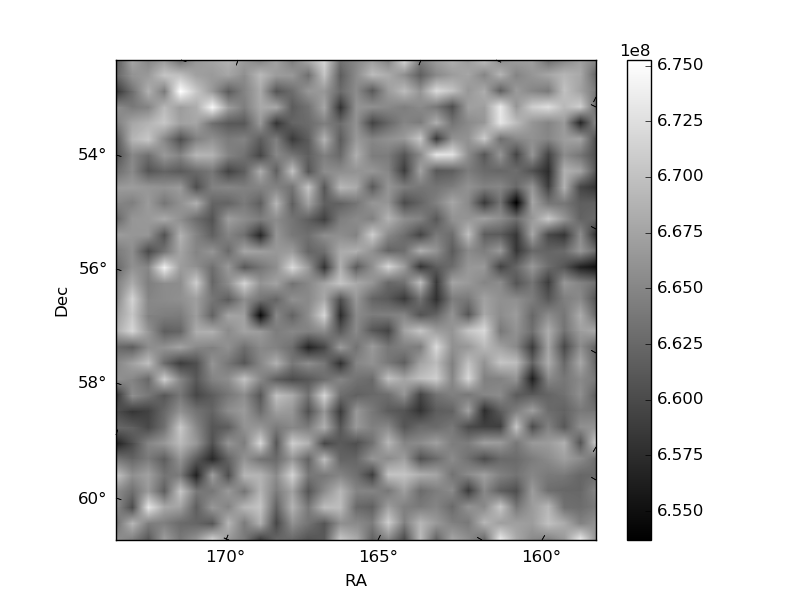
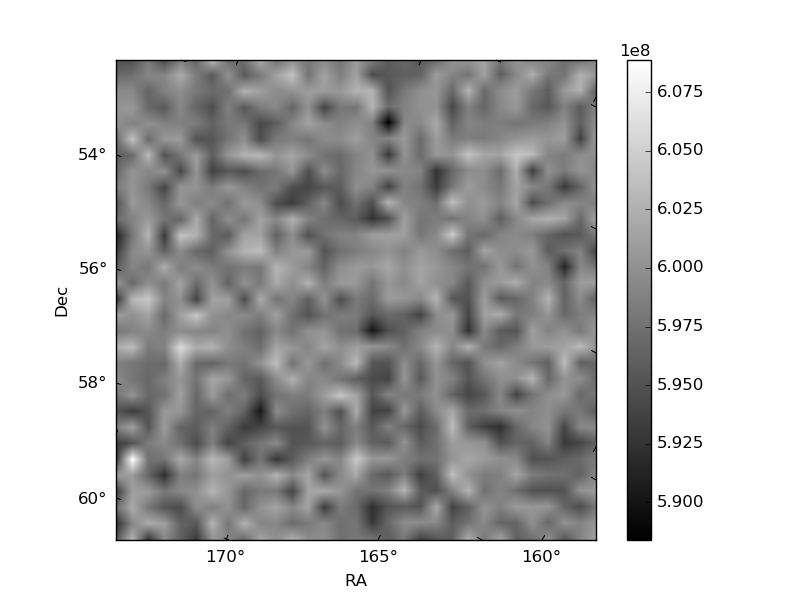
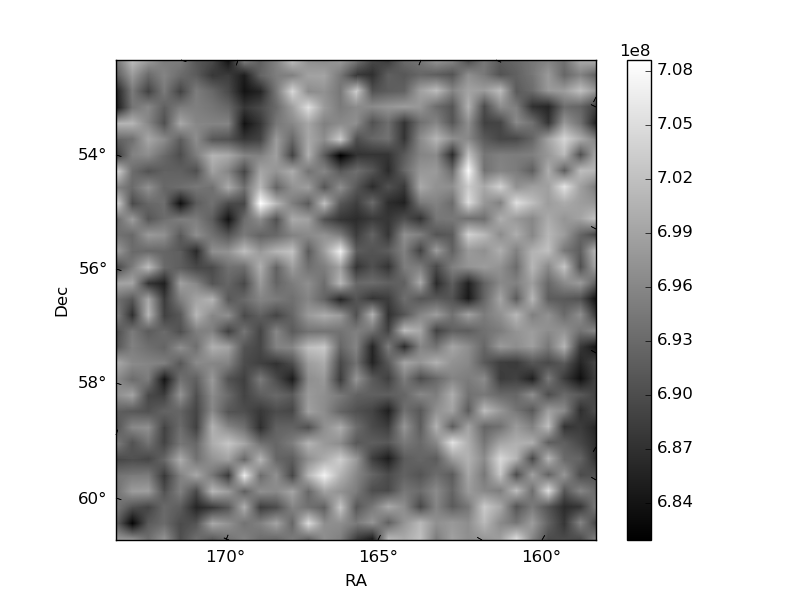
Histogram calculated using DETX and DETY for each event in the final _common_clean file
| Quadrant A | 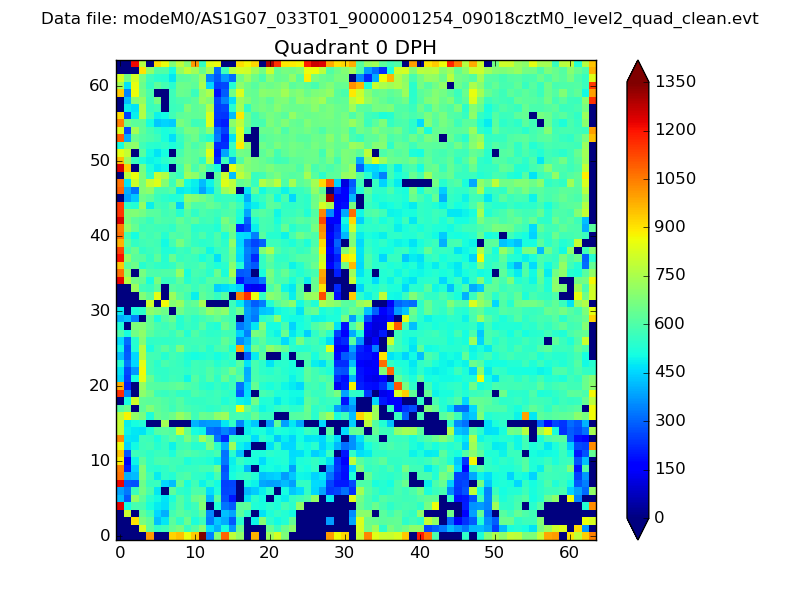 |
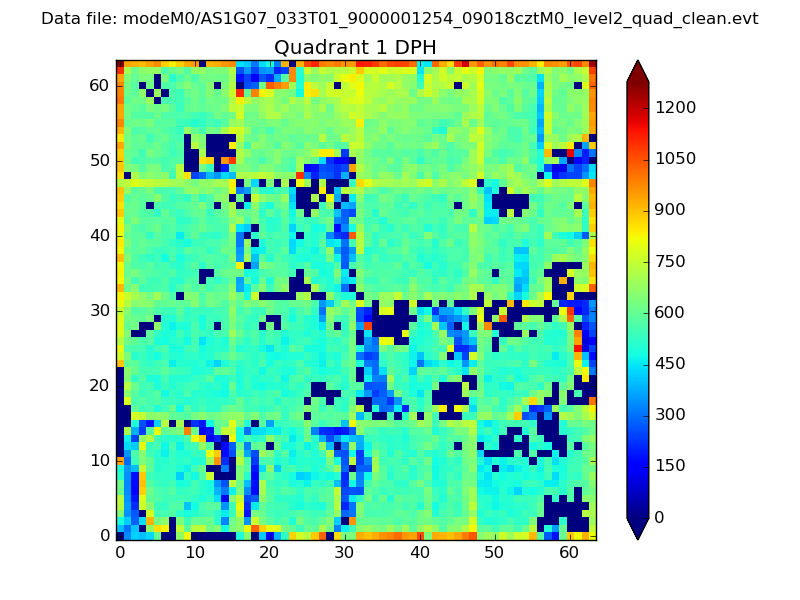 |
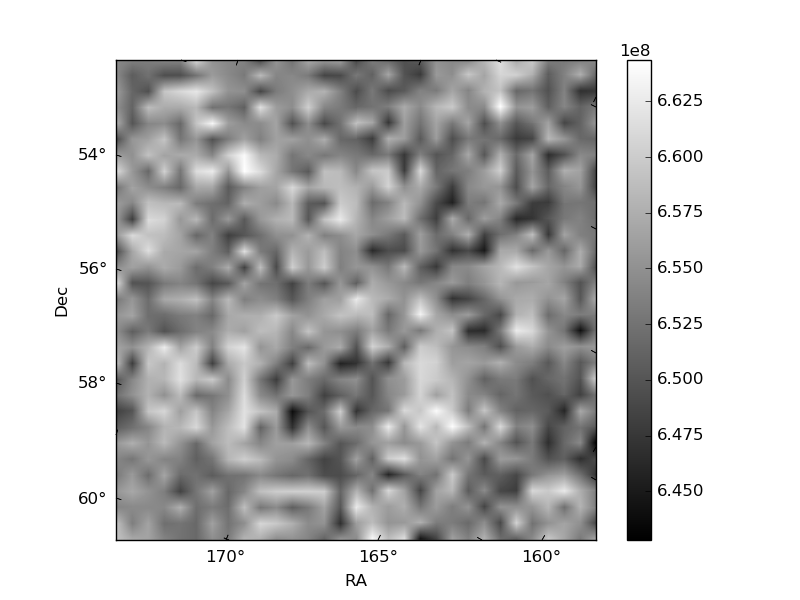
Quadrant B |
|---|---|---|---|
| Quadrant D | 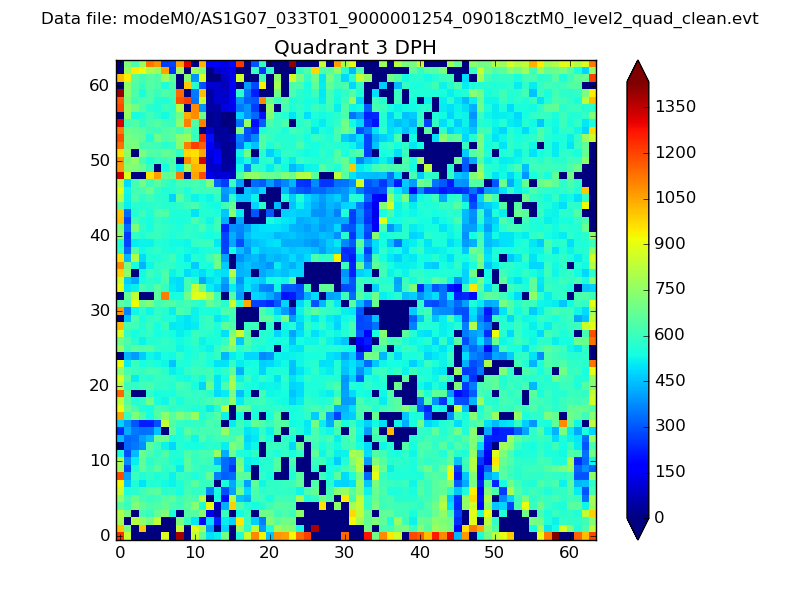 |
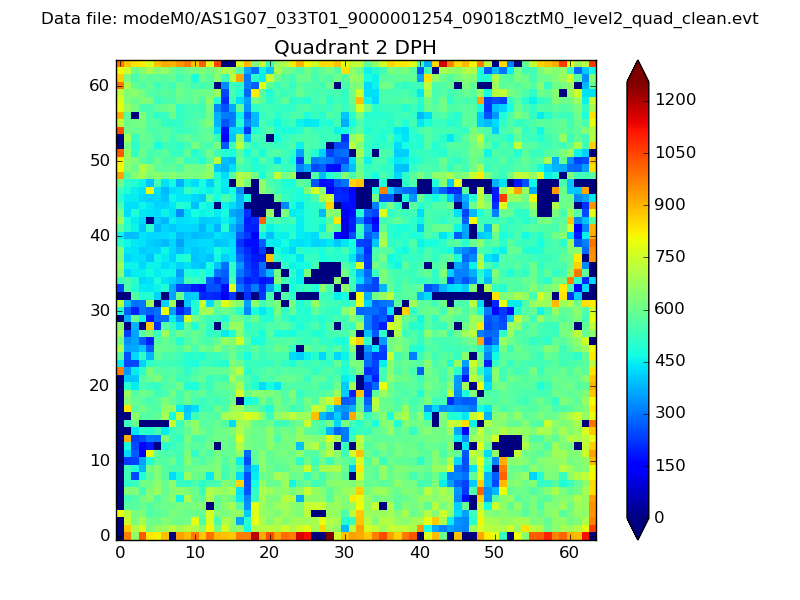 |
Quadrant C |
| Plot type | Count rate plots | Images |
|---|---|---|
| Comparison with Poisson distribution Blue bars denote a histogram of data divided into 1 sec bins. Red curve is a Poisson curve with rate = median count rate of data. |
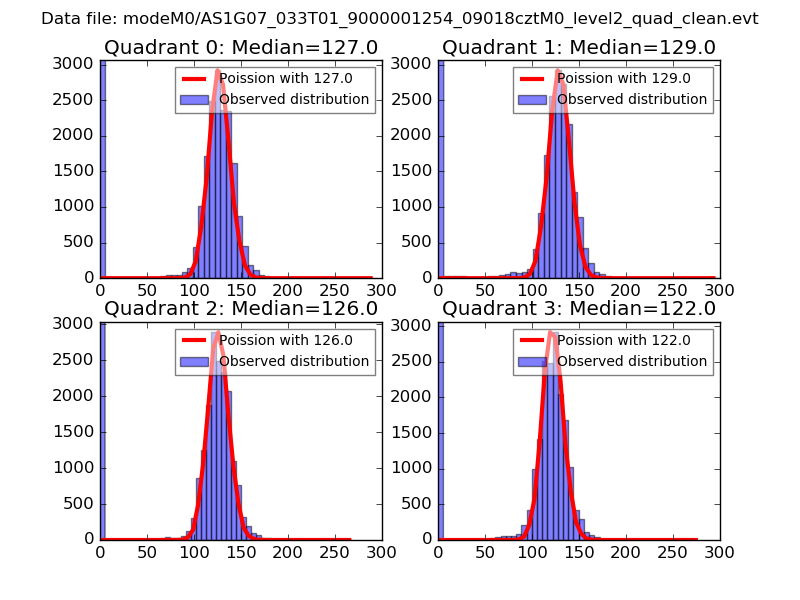 |
 |
| Quadrant-wise count rates Data is divided into 100 sec bins |
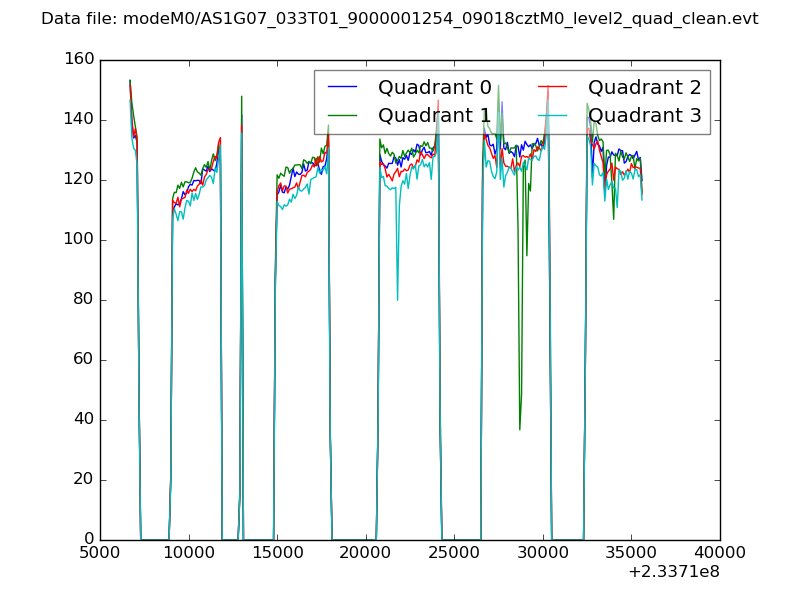 |
|
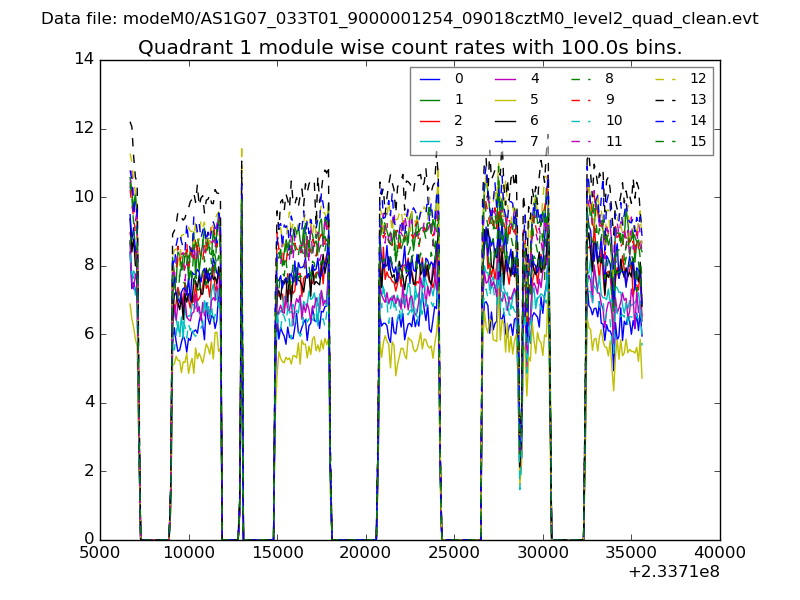
| Module-wise count rates for Quadrant A Data is divided into 100 sec bins |
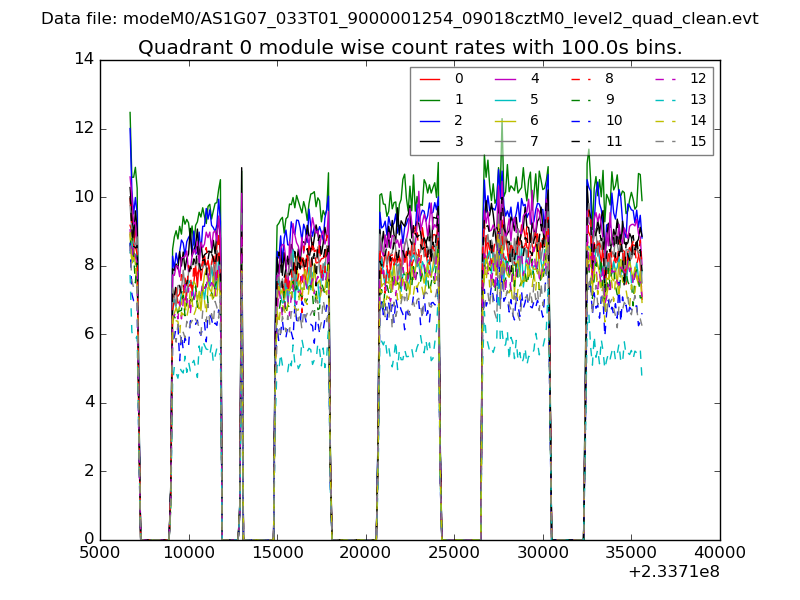 |
 |
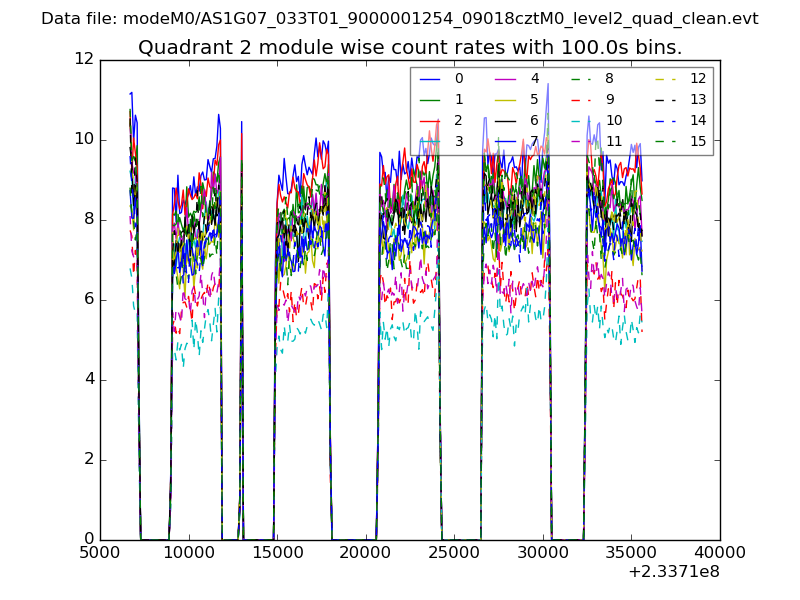
| Module-wise count rates for Quadrant B Data is divided into 100 sec bins |
 |
 |
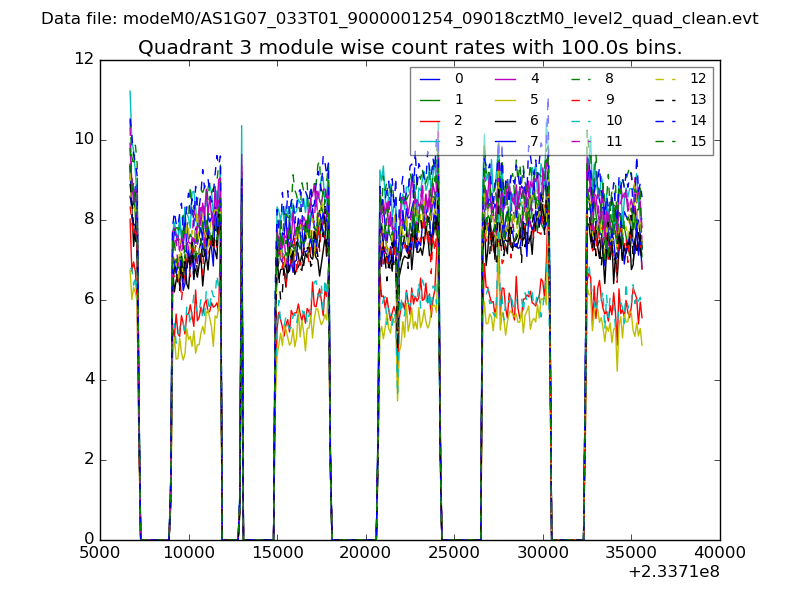
| Module-wise count rates for Quadrant C Data is divided into 100 sec bins |
 |
 |
| Module-wise count rates for Quadrant D Data is divided into 100 sec bins |
 |
 |
| Parameter | Plot |
|---|---|
| CZT HV Monitor | 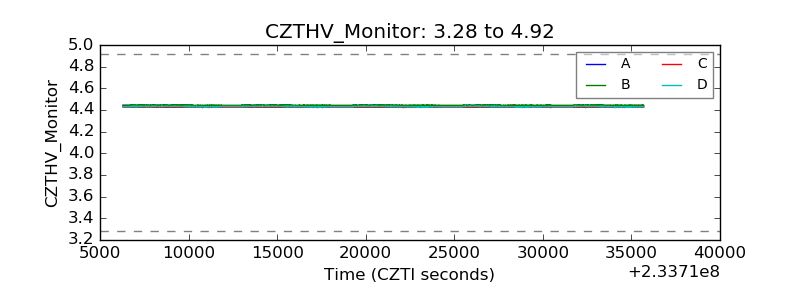 |
| D_VDD | 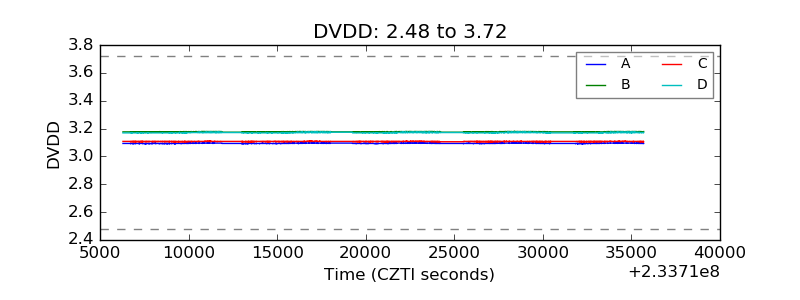 |
| Temperature 1 | 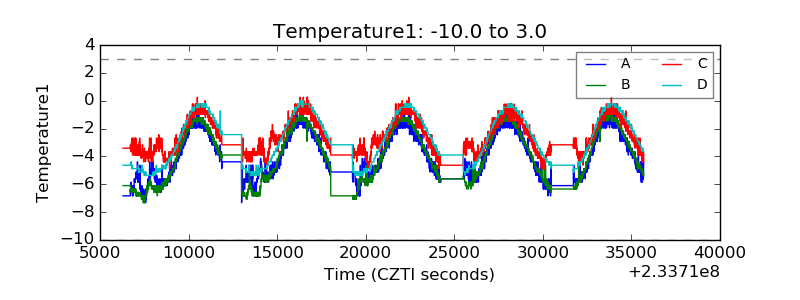 |
| Veto HV Monitor |  |
| Veto LLD | 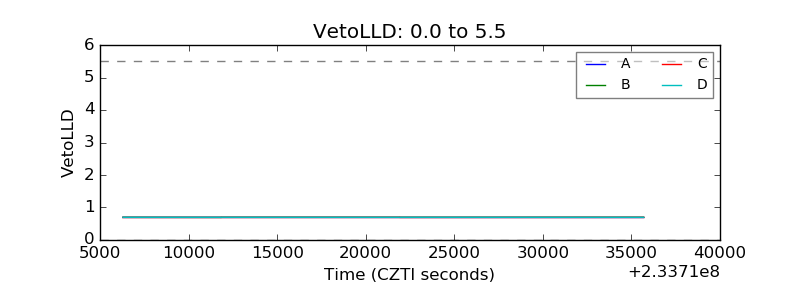 |
| Alpha Counter | 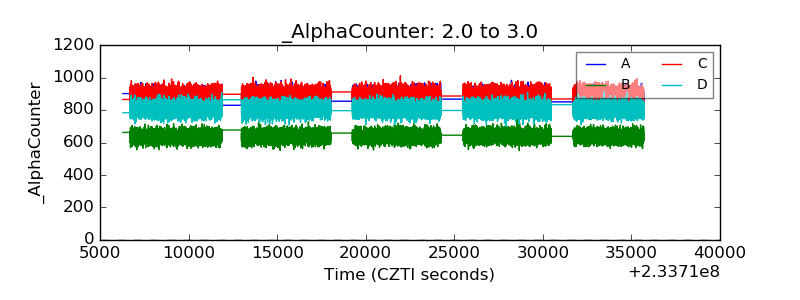 |
| _CPM_Rate | 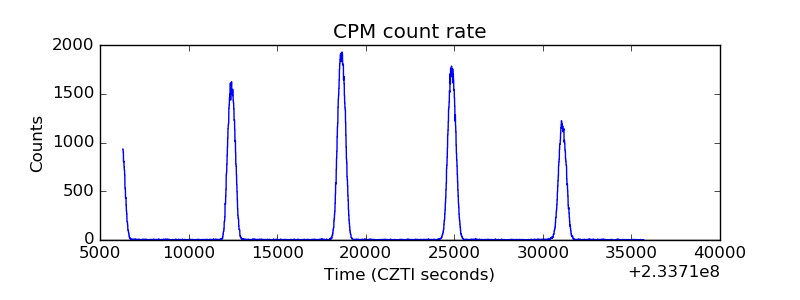 |
| CZT Counter | 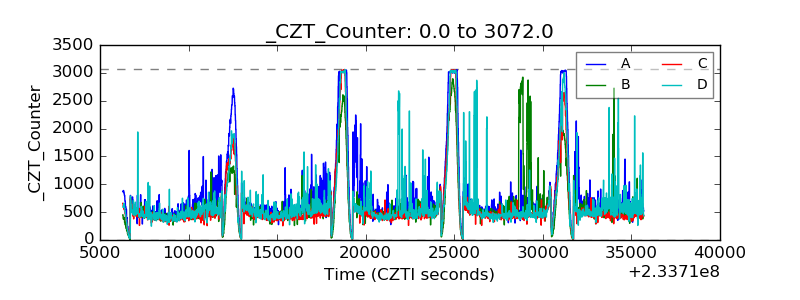 |
| +2.5 Volts monitor |  |
| +5 Volts monitor |  |
| _ROLL_ROT | 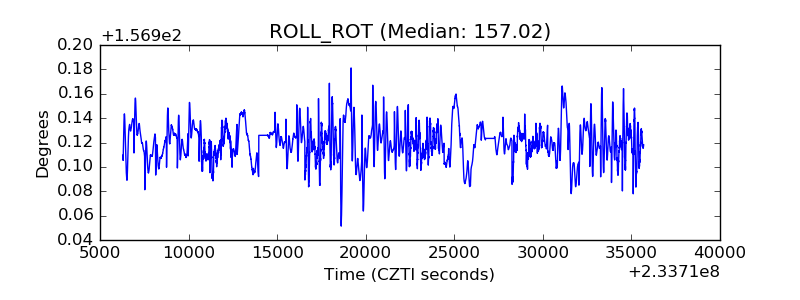 |
| _Roll_DEC | 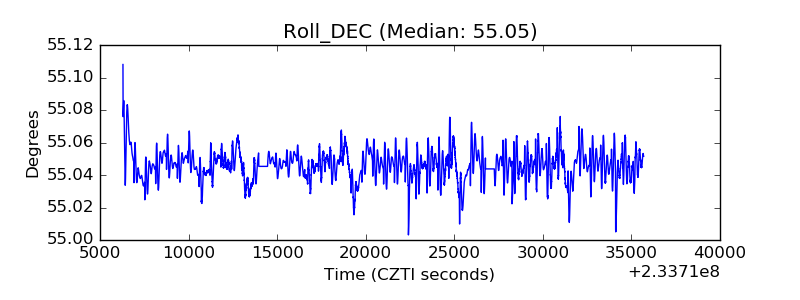 |
| _Roll_RA | 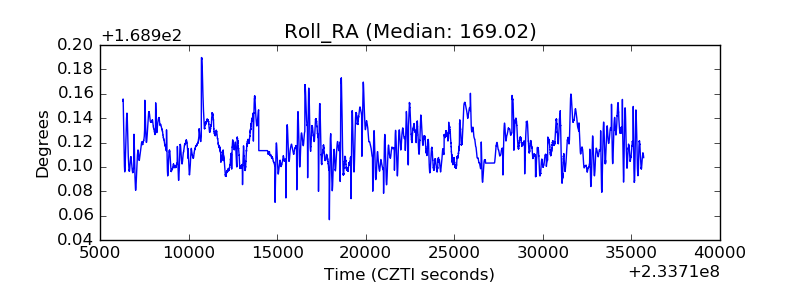 |
| Veto Counter | 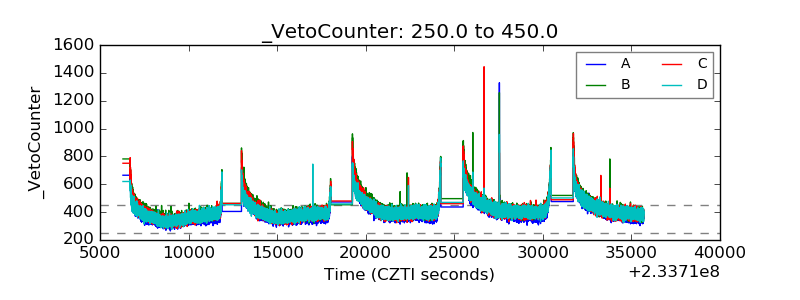 |