| Param | Original file | Final file |
|---|---|---|
| Filename | modeM0/AS1G07_033T01_9000001254_09192cztM0_level2.evt | modeM0/AS1G07_033T01_9000001254_09192cztM0_level2_quad_clean.evt |
| Size (bytes) | 35,683,200 | 10,388,160 |
| Size | 34.0 MB | 9.9 MB |
| Events in quadrant A | 298,989 | 67,274 |
| Events in quadrant B | 256,035 | 69,750 |
| Events in quadrant C | 248,394 | 67,295 |
| Events in quadrant D | 237,273 | 64,323 |
| Mode M0 | |||
|---|---|---|---|
| Quadrant | BADHDUFLAG | Total packets | Discarded packets |
| A | 0 | 1203 | 1 |
| B | 0 | 1081 | 0 |
| C | 0 | 1078 | 0 |
| D | 0 | 1079 | 0 |
| Mode SS | |||
|---|---|---|---|
| Quadrant | BADHDUFLAG | Total packets | Discarded packets |
| A | 0 | 10 | 0 |
| B | 0 | 10 | 0 |
| C | 0 | 10 | 0 |
| D | 0 | 10 | 0 |
| Quadrant | Total seconds | Saturated seconds | Saturation percentage |
|---|---|---|---|
| A | 538 | 0 | 0.000000% |
| B | 538 | 3 | 0.557621% |
| C | 538 | 0 | 0.000000% |
| D | 538 | 0 | 0.000000% |
Noise dominated data is calculated using 1-second bins in cleaned event files. If a bin has >2000 counts, and if more than 50% of those come from <1% of pixels, then it is considered to be noise-dominated and hence unusable.
| Quadrant | # 1 sec bins | Bins with >0 counts | Bins with >2000 counts | High rate bins dominated by noise | Noise dominated (total time) | Noise dominated (detector-on time) | Marked lightcurve |
|---|---|---|---|---|---|---|---|
| A | 538 | 538 | 0 | 0 | 0.00% | 0.00% | 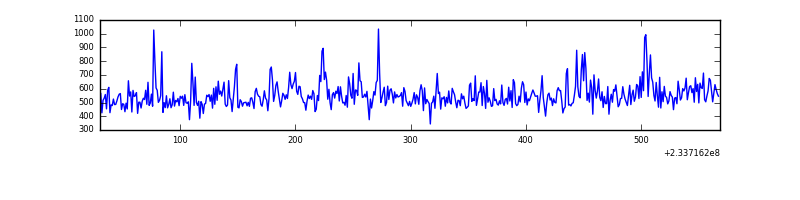 |
| B | 538 | 538 | 0 | 0 | 0.00% | 0.00% | 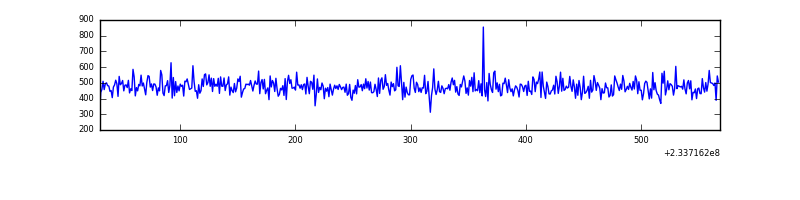 |
| C | 538 | 538 | 0 | 0 | 0.00% | 0.00% | 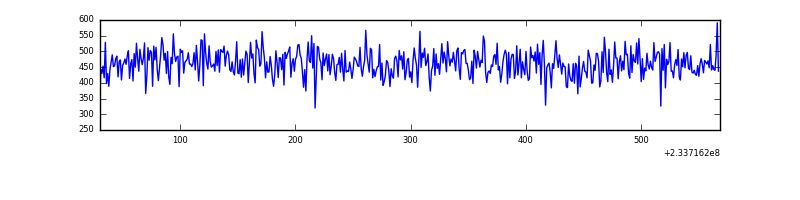 |
| D | 538 | 538 | 0 | 0 | 0.00% | 0.00% | 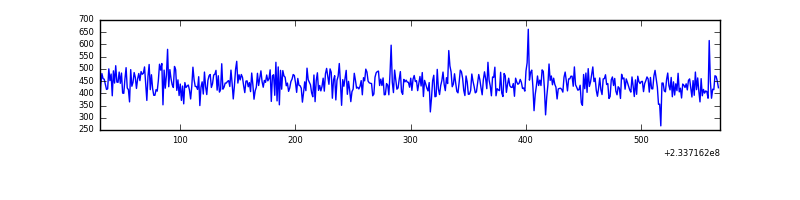 |
Top three noisy pixels from each quadrant. If the there are fewer than three noisy pixels in the level2.evt file, extra rows are filled as -1
| Pixel properties | Quadrant properties | ||||||
|---|---|---|---|---|---|---|---|
| Quadrant | DetID | PixID | Counts | Sigma | Mean | Median | Sigma |
| A | 8 | 5 | 34753 | 2225.51 | 64 | 62 | 15.6 |
| A | 1 | 162 | 10608 | 676.55 | 64 | 62 | 15.6 |
| A | 1 | 178 | 2335 | 145.82 | 64 | 62 | 15.6 |
| B | 12 | 111 | 1418 | 93.37 | 65 | 64 | 14.5 |
| B | 11 | 111 | 1160 | 75.58 | 65 | 64 | 14.5 |
| B | 14 | 111 | 849 | 54.13 | 65 | 64 | 14.5 |
| C | 13 | 61 | 492 | 25.75 | 63 | 63 | 16.7 |
| C | 8 | 222 | 231 | 10.09 | 63 | 63 | 16.7 |
| C | 12 | 4 | 200 | 8.22 | 63 | 63 | 16.7 |
| D | 2 | 234 | 2493 | 140.52 | 62 | 59 | 17.3 |
| D | 1 | 52 | 1628 | 90.58 | 62 | 59 | 17.3 |
| D | 2 | 14 | 879 | 47.34 | 62 | 59 | 17.3 |
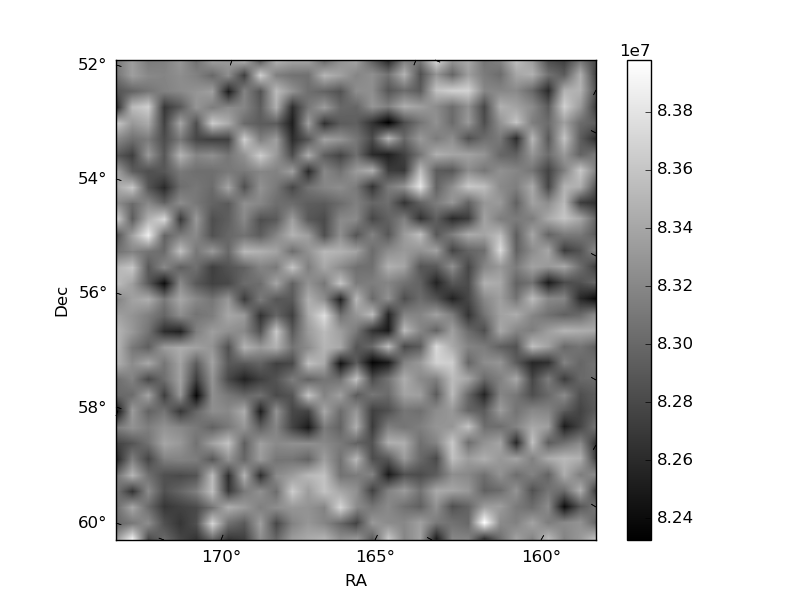
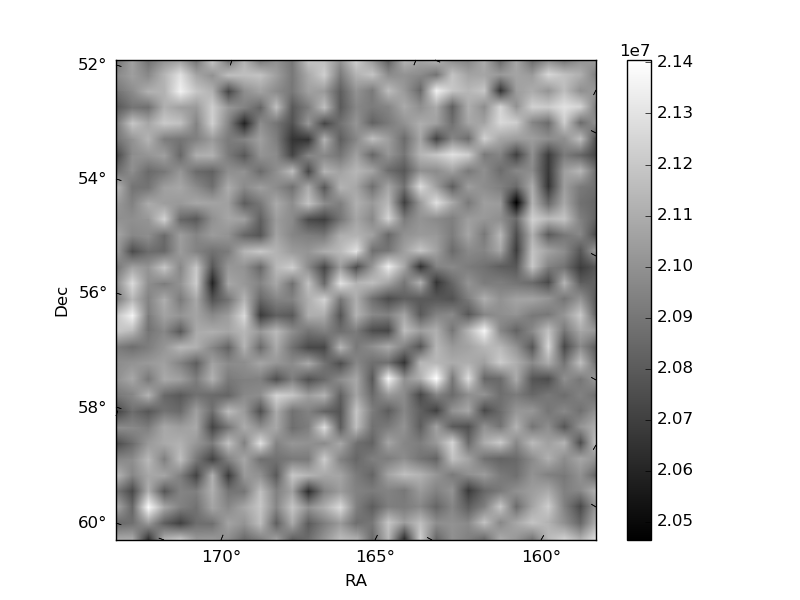
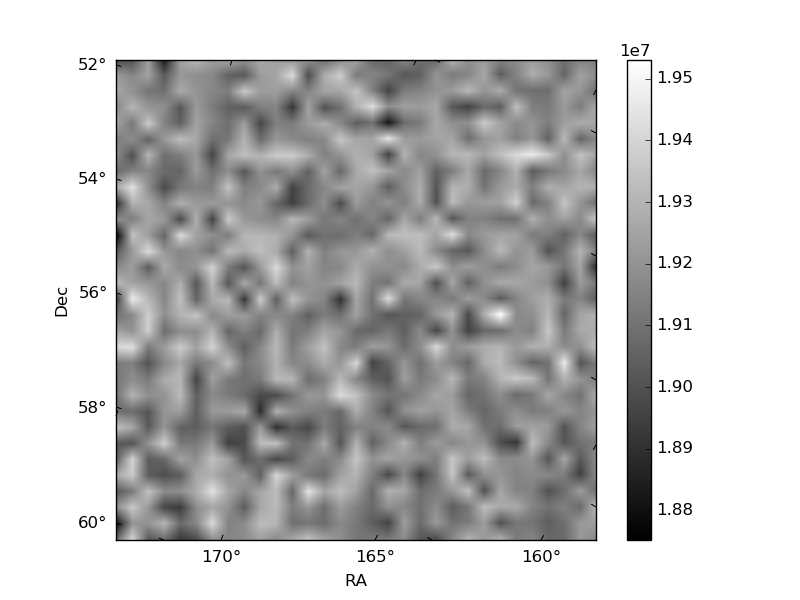
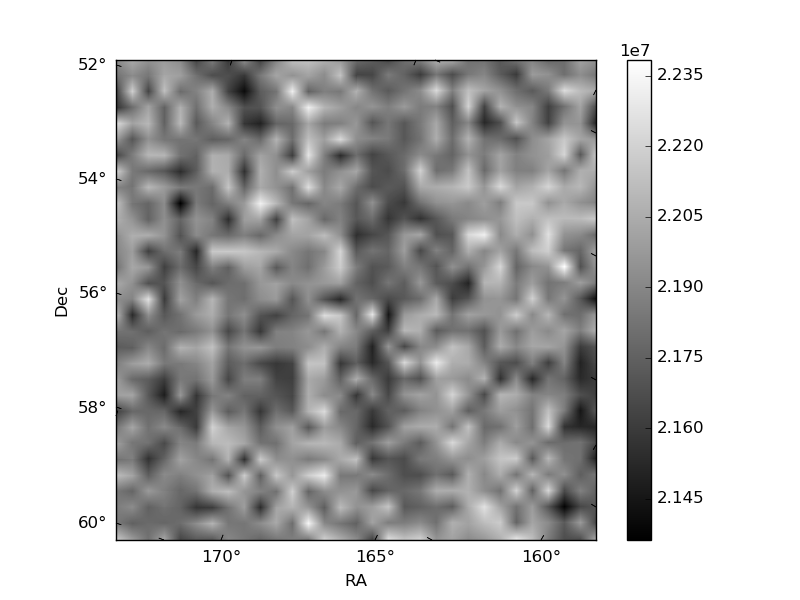
Histogram calculated using DETX and DETY for each event in the final _common_clean file
| Quadrant A | 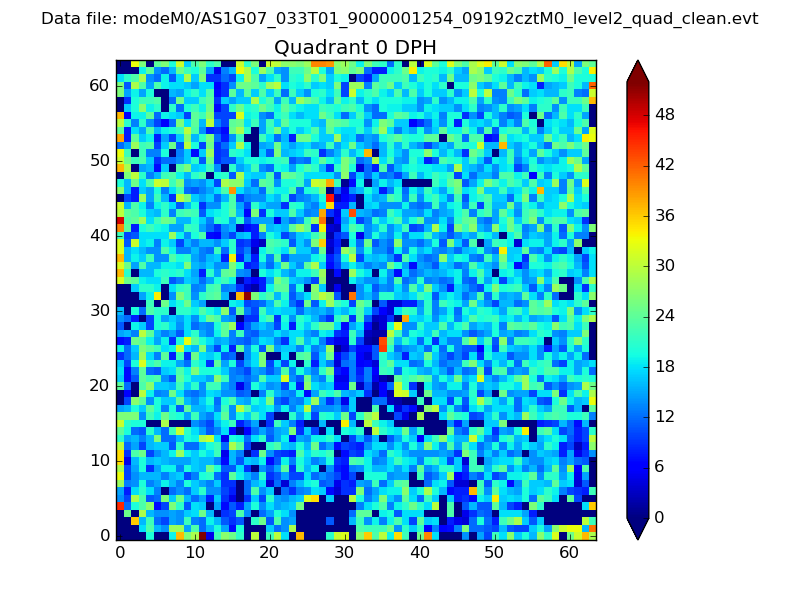 |
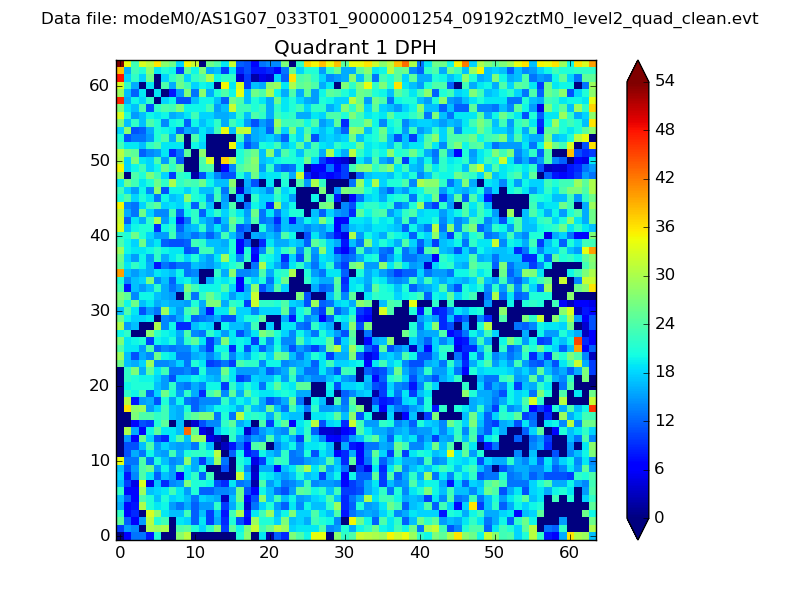 |
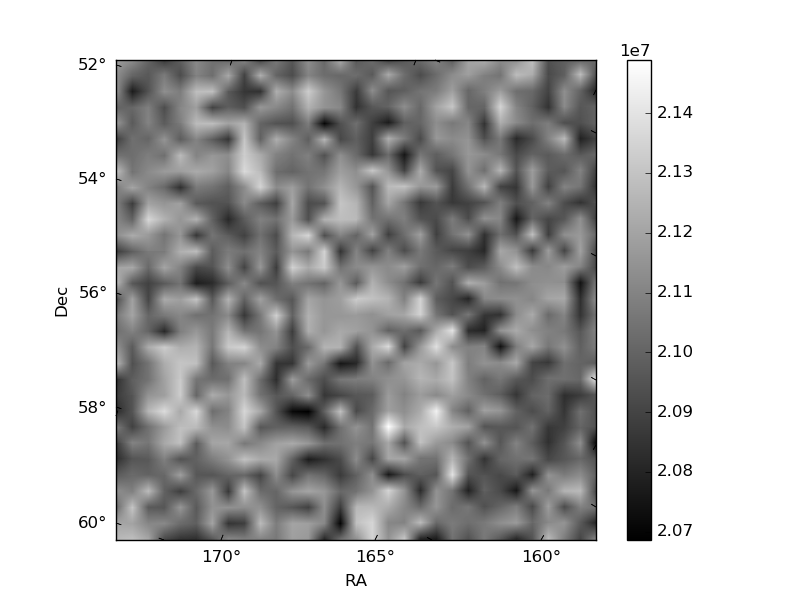
Quadrant B |
|---|---|---|---|
| Quadrant D | 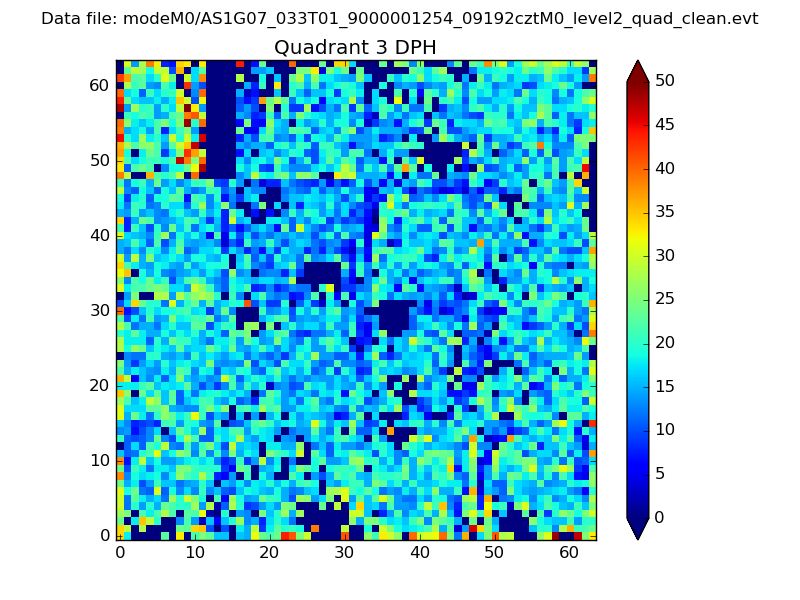 |
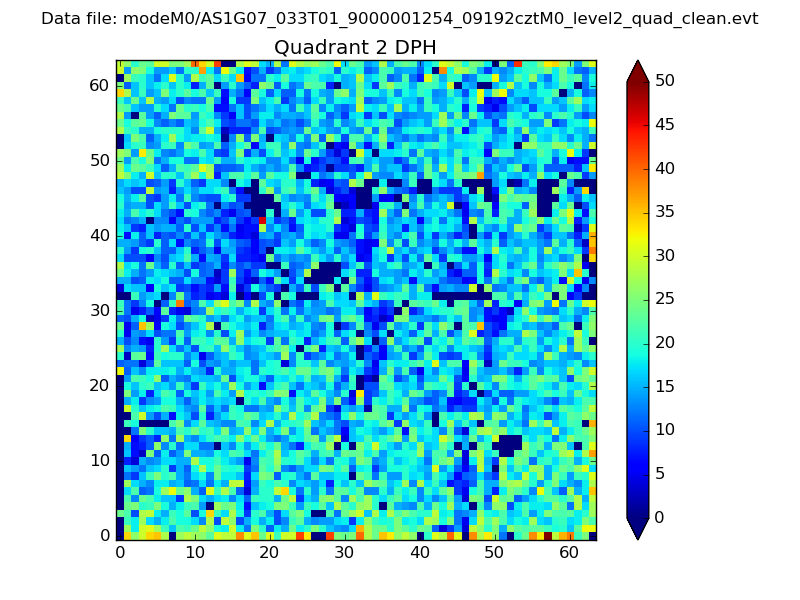 |
Quadrant C |
| Plot type | Count rate plots | Images |
|---|---|---|
| Comparison with Poisson distribution Blue bars denote a histogram of data divided into 1 sec bins. Red curve is a Poisson curve with rate = median count rate of data. |
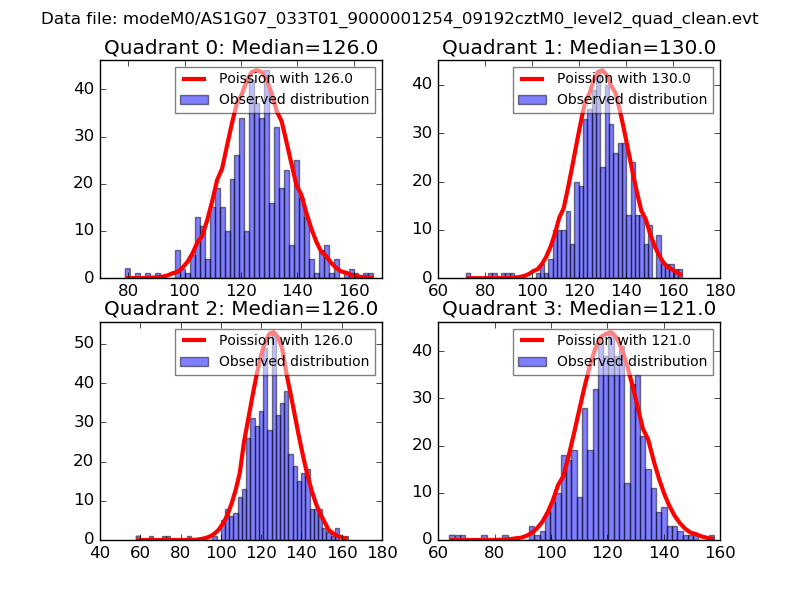 |
 |
| Quadrant-wise count rates Data is divided into 100 sec bins |
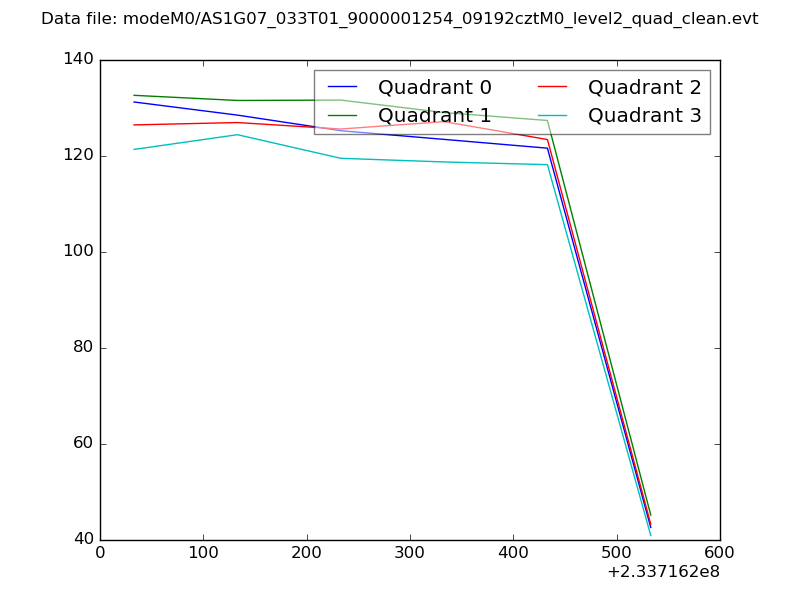 |
|
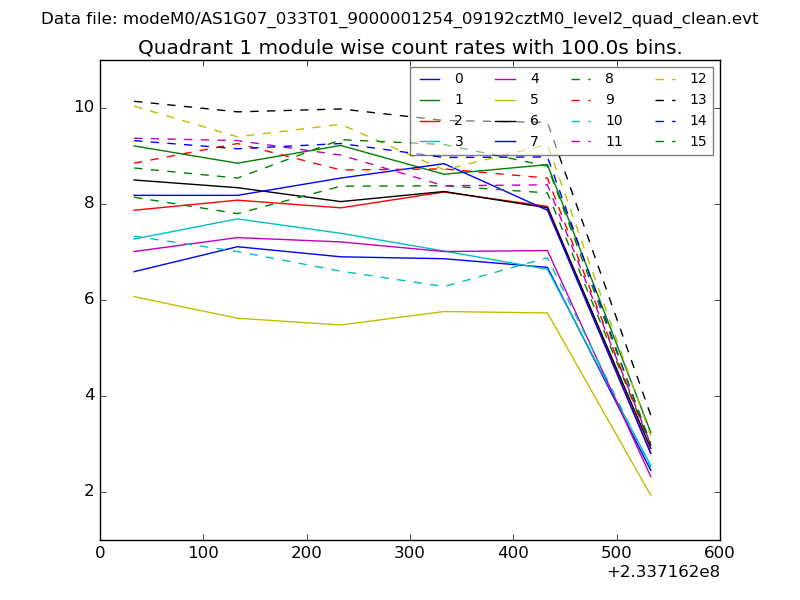
| Module-wise count rates for Quadrant A Data is divided into 100 sec bins |
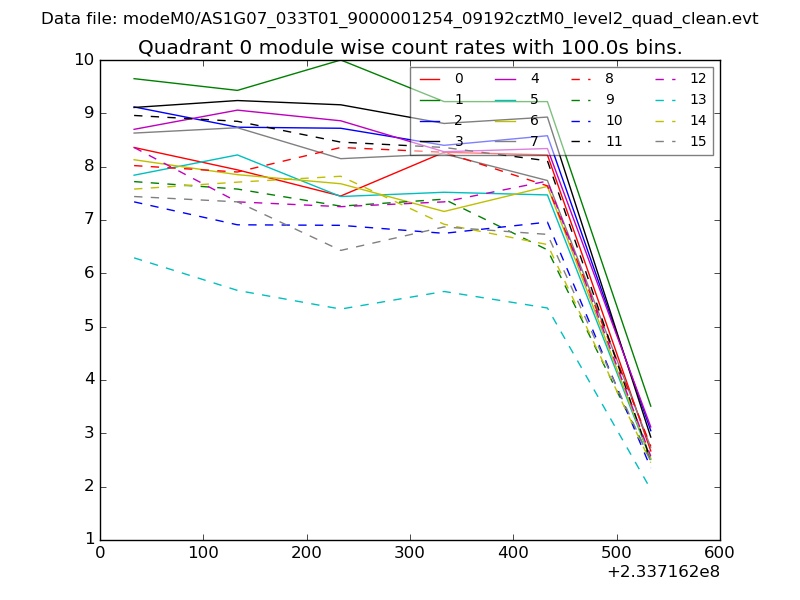 |
 |
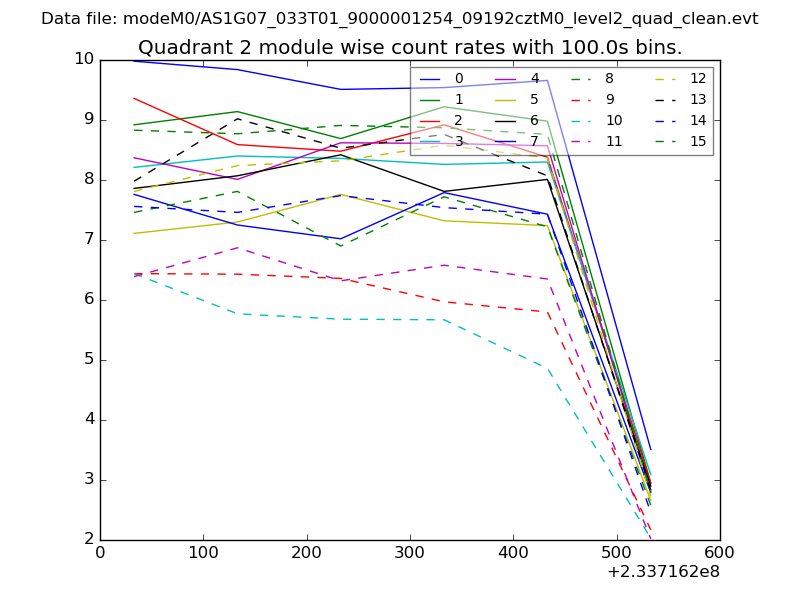
| Module-wise count rates for Quadrant B Data is divided into 100 sec bins |
 |
 |
| Module-wise count rates for Quadrant C Data is divided into 100 sec bins |
 |
 |
| Module-wise count rates for Quadrant D Data is divided into 100 sec bins |
 |
 |
| Parameter | Plot |
|---|---|
| CZT HV Monitor | 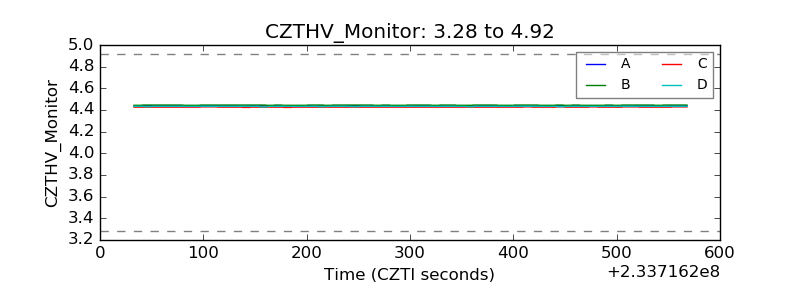 |
| D_VDD | 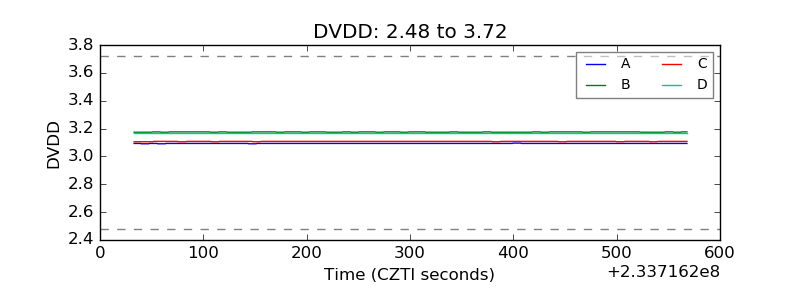 |
| Temperature 1 | 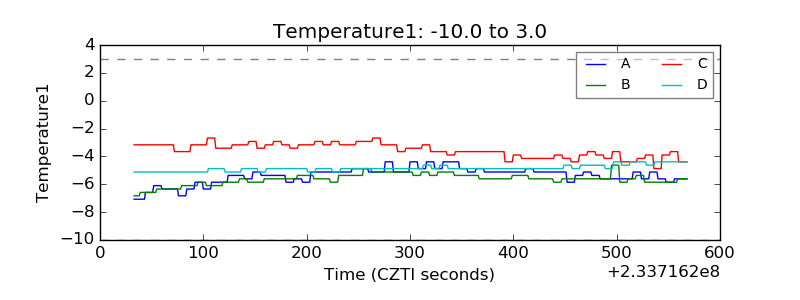 |
| Veto HV Monitor | 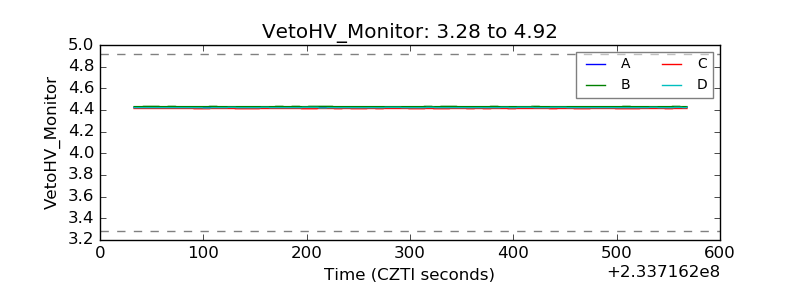 |
| Veto LLD | 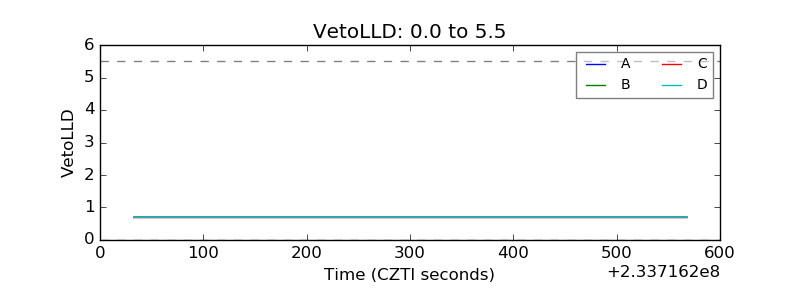 |
| Alpha Counter | 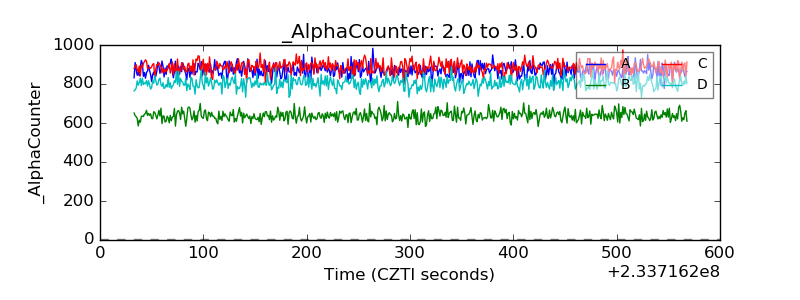 |
| _CPM_Rate | 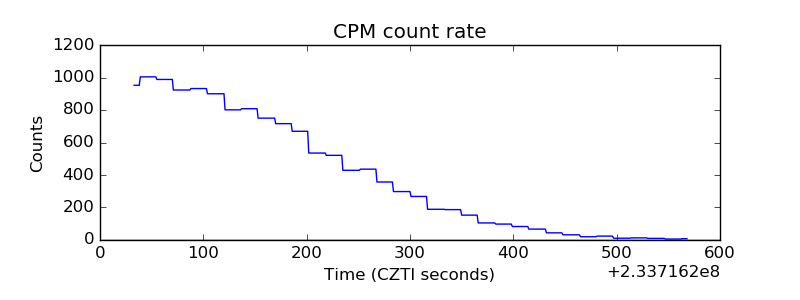 |
| CZT Counter | 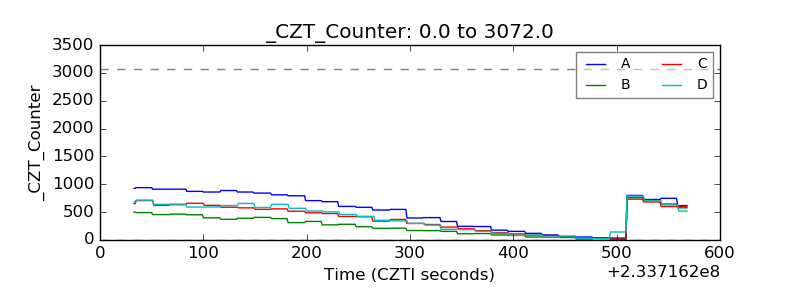 |
| +2.5 Volts monitor | 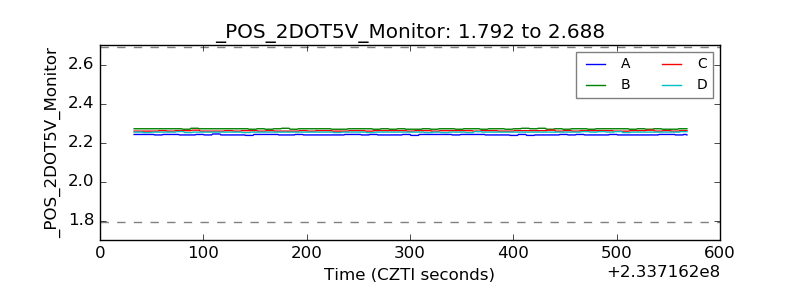 |
| +5 Volts monitor |  |
| _ROLL_ROT | 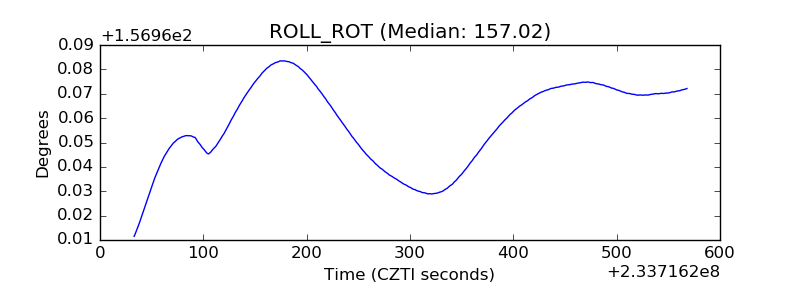 |
| _Roll_DEC |  |
| _Roll_RA | 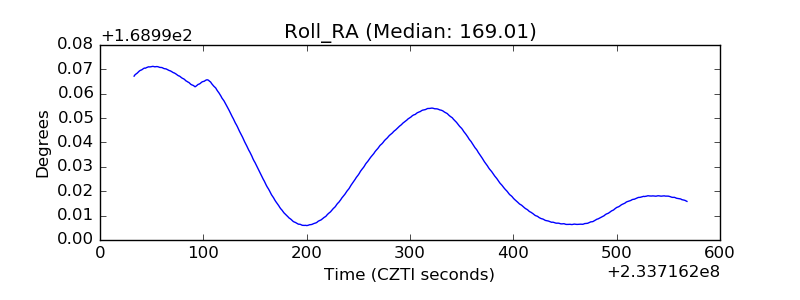 |
| Veto Counter | 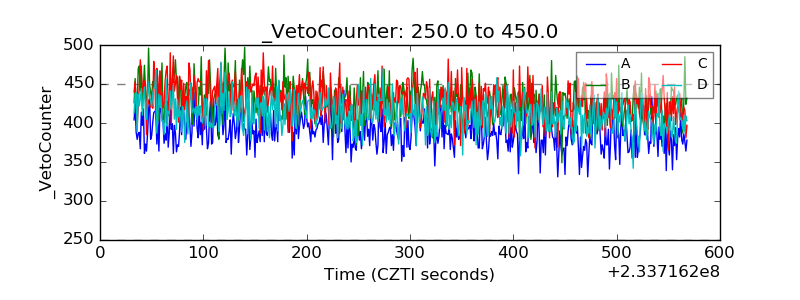 |