| Param | Original file | Final file |
|---|---|---|
| Filename | modeM0/AS1G07_027T01_9000001258cztM0_level2.fits | modeM0/AS1G07_027T01_9000001258cztM0_level2_quad_clean.evt |
| Size (bytes) | 195,816,960 | 139,720,320 |
| Size | 186.7 MB | 133.2 MB |
| Events in quadrant A | 1,189,138 | 731,742 |
| Events in quadrant B | 1,148,992 | 734,341 |
| Events in quadrant C | 1,166,642 | 701,719 |
| Events in quadrant D | 1,008,120 | 644,790 |
| Mode M0 | |||
|---|---|---|---|
| Quadrant | BADHDUFLAG | Total packets | Discarded packets |
| A | 0 | 45589 | 0 |
| B | 0 | 43435 | 0 |
| C | 0 | 42235 | 0 |
| D | 0 | 48523 | 0 |
| Mode M9 | |||
|---|---|---|---|
| Quadrant | BADHDUFLAG | Total packets | Discarded packets |
| A | 0 | 46 | 0 |
| B | 0 | 46 | 0 |
| C | 0 | 46 | 0 |
| D | 0 | 46 | 0 |
| Mode SS | |||
|---|---|---|---|
| Quadrant | BADHDUFLAG | Total packets | Discarded packets |
| A | 0 | 420 | 0 |
| B | 0 | 416 | 0 |
| C | 0 | 418 | 0 |
| D | 0 | 416 | 0 |
| Quadrant | Total seconds | Saturated seconds | Saturation percentage |
|---|---|---|---|
| A | 20585 | 118 | 0.573233% |
| B | 20587 | 153 | 0.743187% |
| C | 20580 | 58 | 0.281827% |
| D | 20580 | 340 | 1.652089% |
Noise dominated data is calculated using 1-second bins in cleaned event files. If a bin has >2000 counts, and if more than 50% of those come from <1% of pixels, then it is considered to be noise-dominated and hence unusable.
| Quadrant | # 1 sec bins | Bins with >0 counts | Bins with >2000 counts | High rate bins dominated by noise | Noise dominated (total time) | Noise dominated (detector-on time) | Marked lightcurve |
|---|---|---|---|---|---|---|---|
| A | 25642 | 20890 | 0 | 0 | 0.00% | 0.00% |  |
| B | 25643 | 20901 | 0 | 0 | 0.00% | 0.00% | 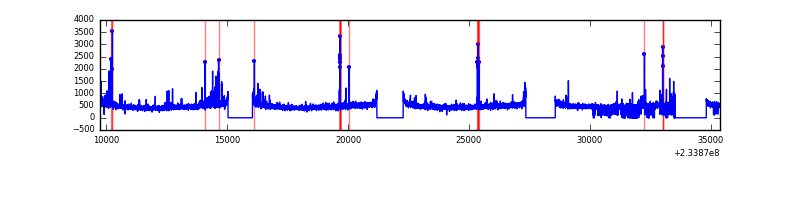 |
| C | 25642 | 20902 | 0 | 0 | 0.00% | 0.00% |  |
| D | 25642 | 20895 | 0 | 0 | 0.00% | 0.00% |  |
Top three noisy pixels from each quadrant. If the there are fewer than three noisy pixels in the level2.evt file, extra rows are filled as -1
| Pixel properties | Quadrant properties | ||||||
|---|---|---|---|---|---|---|---|
| Quadrant | DetID | PixID | Counts | Sigma | Mean | Median | Sigma |
| A | 14 | 188 | 1171 | 11.25 | 308 | 290 | 78.3 |
| A | 0 | 29 | 1159 | 11.09 | 308 | 290 | 78.3 |
| A | 14 | 204 | 1018 | 9.29 | 308 | 290 | 78.3 |
| B | 2 | 9 | 1025 | 11.89 | 303 | 289 | 61.9 |
| B | 5 | 128 | 816 | 8.52 | 303 | 289 | 61.9 |
| B | 12 | 226 | 804 | 8.32 | 303 | 289 | 61.9 |
| C | 1 | 81 | 933 | 7.82 | 307 | 286 | 82.8 |
| C | 1 | 80 | 924 | 7.71 | 307 | 286 | 82.8 |
| C | 9 | 188 | 822 | 6.48 | 307 | 286 | 82.8 |
| D | 6 | 231 | 800 | 6.89 | 286 | 260 | 78.4 |
| D | 3 | 31 | 771 | 6.52 | 286 | 260 | 78.4 |
| D | 3 | 14 | 759 | 6.37 | 286 | 260 | 78.4 |
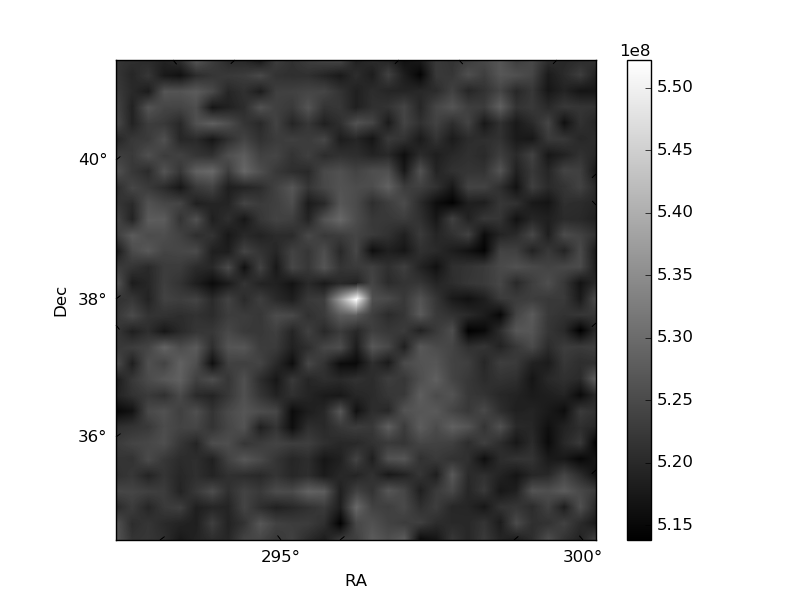
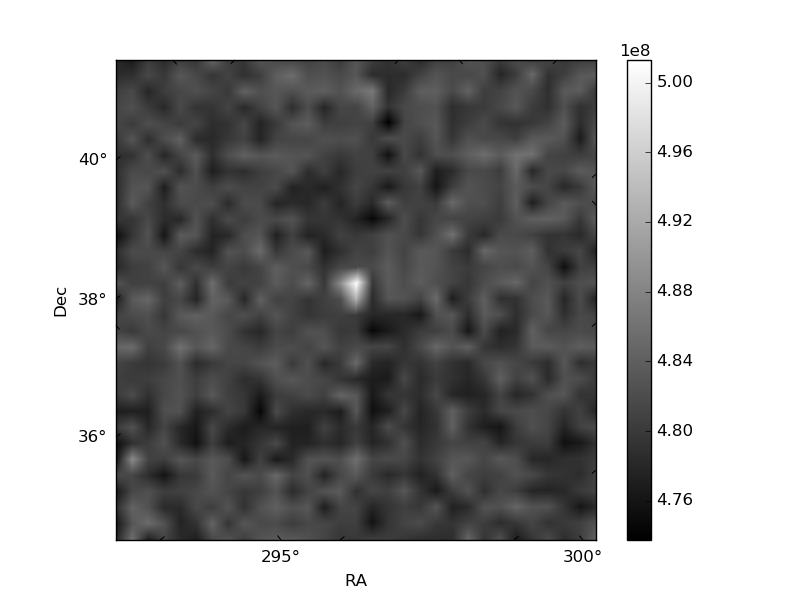
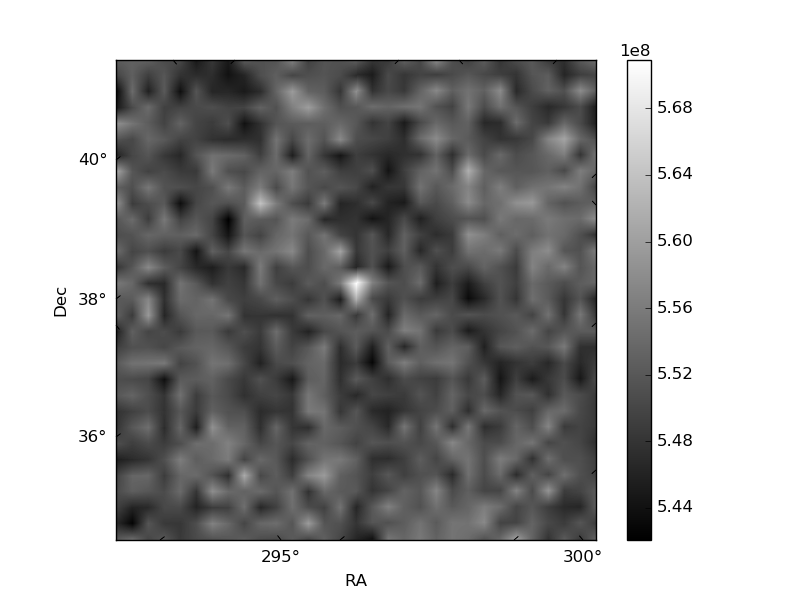
Histogram calculated using DETX and DETY for each event in the final _common_clean file
| Quadrant A | 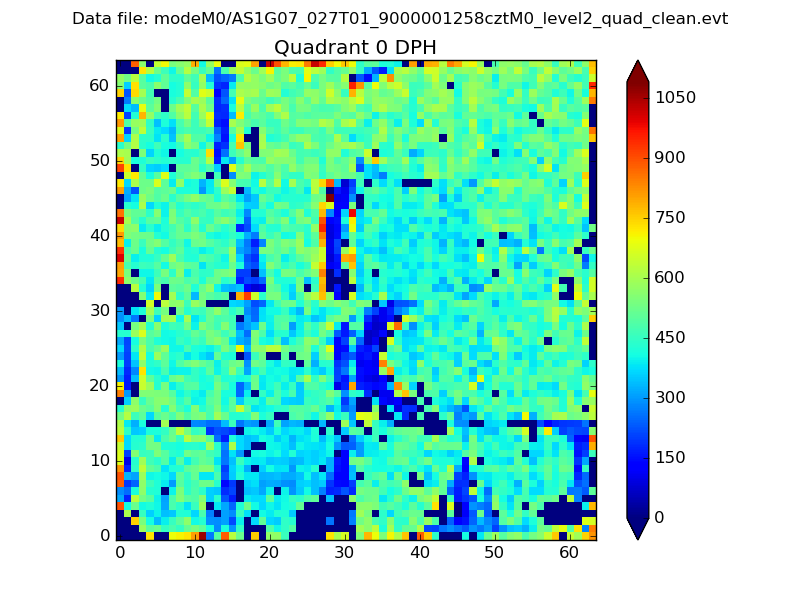 |
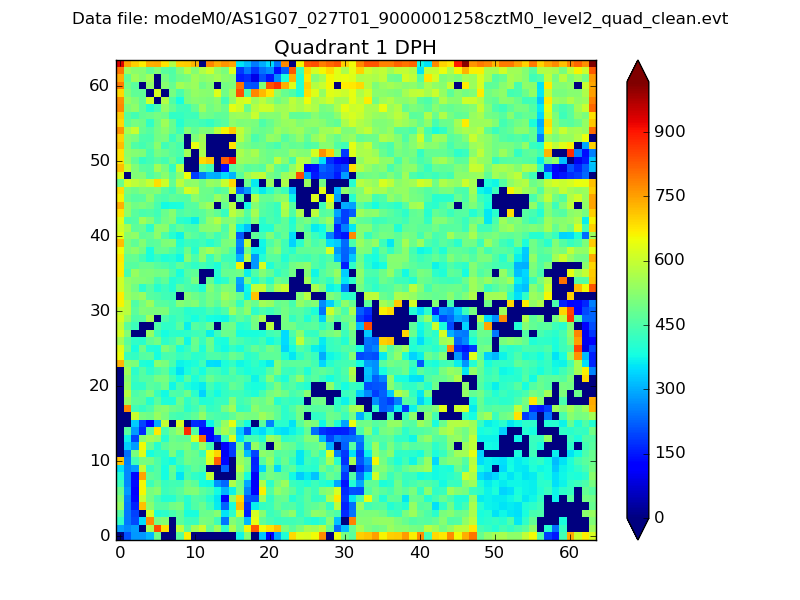 |
Quadrant B |
|---|---|---|---|
| Quadrant D |  |
 |
Quadrant C |
| Plot type | Count rate plots | Images |
|---|---|---|
| Comparison with Poisson distribution Blue bars denote a histogram of data divided into 1 sec bins. Red curve is a Poisson curve with rate = median count rate of data. |
 |
 |
| Quadrant-wise count rates Data is divided into 100 sec bins |
 |
|
| Module-wise count rates for Quadrant A Data is divided into 100 sec bins |
 |
 |
| Module-wise count rates for Quadrant B Data is divided into 100 sec bins |
 |
 |
| Module-wise count rates for Quadrant C Data is divided into 100 sec bins |
 |
 |
| Module-wise count rates for Quadrant D Data is divided into 100 sec bins |
 |
 |
| Parameter | Plot |
|---|---|
| CZT HV Monitor |  |
| D_VDD |  |
| Temperature 1 |  |
| Veto HV Monitor | 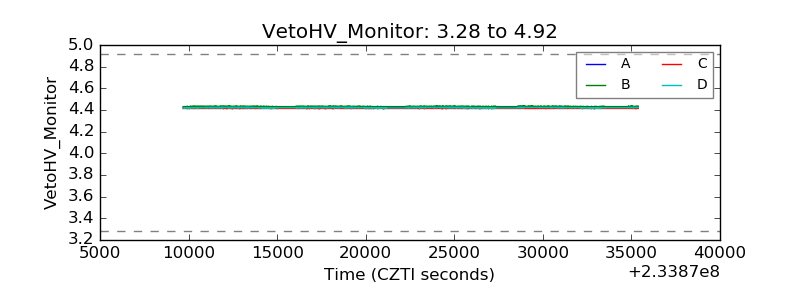 |
| Veto LLD | 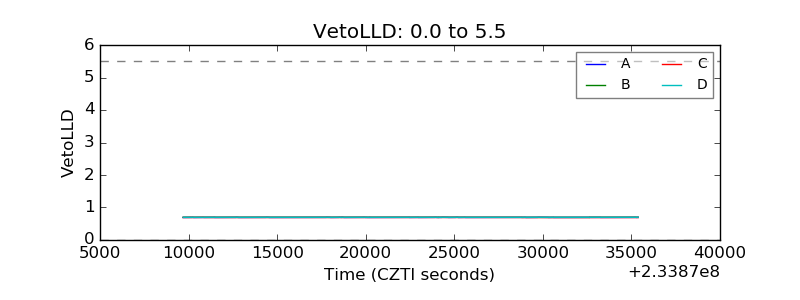 |
| Alpha Counter | 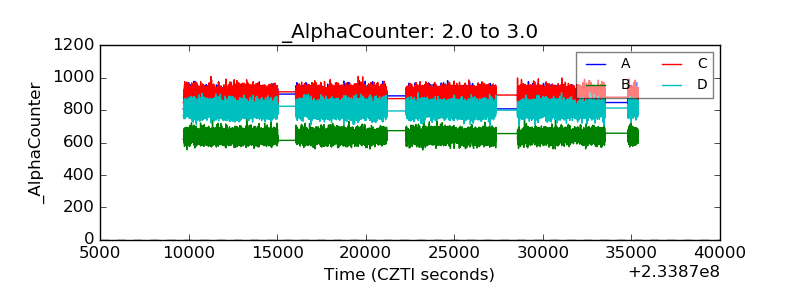 |
| _CPM_Rate | 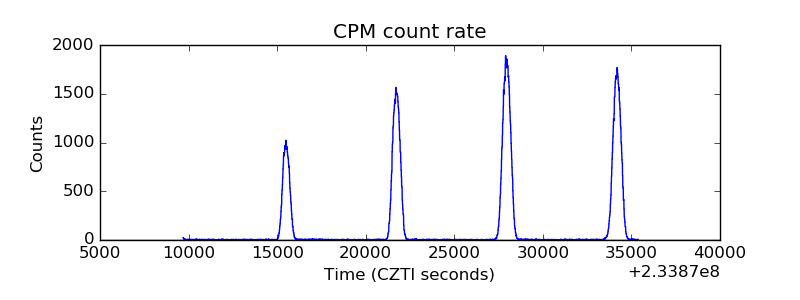 |
| CZT Counter | 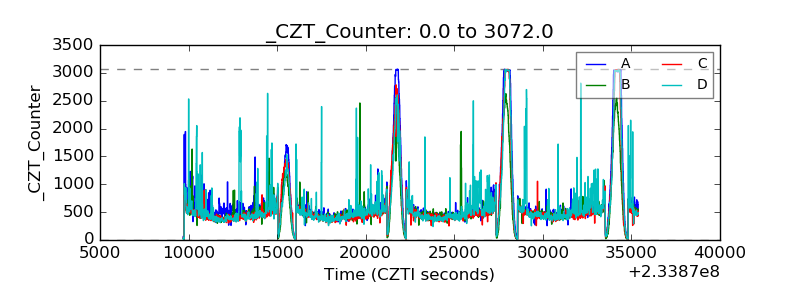 |
| +2.5 Volts monitor |  |
| +5 Volts monitor |  |
| _ROLL_ROT | 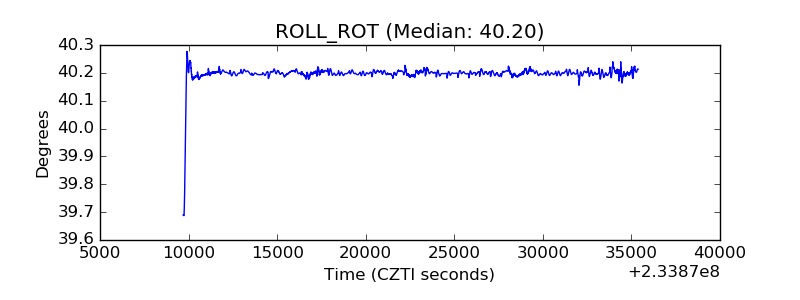 |
| _Roll_DEC |  |
| _Roll_RA |  |
| Veto Counter |  |