| Param | Original file | Final file |
|---|---|---|
| Filename | modeM0/AS1G07_027T01_9000001258_09043cztM0_level2.evt | modeM0/AS1G07_027T01_9000001258_09043cztM0_level2_quad_clean.evt |
| Size (bytes) | 435,692,160 | 96,727,680 |
| Size | 415.5 MB | 92.2 MB |
| Events in quadrant A | 3,281,938 | 624,226 |
| Events in quadrant B | 3,151,189 | 632,351 |
| Events in quadrant C | 2,945,250 | 622,302 |
| Events in quadrant D | 3,374,342 | 596,870 |
| Mode M0 | |||
|---|---|---|---|
| Quadrant | BADHDUFLAG | Total packets | Discarded packets |
| A | 0 | 13991 | 3 |
| B | 0 | 13652 | 2 |
| C | 0 | 13325 | 2 |
| D | 0 | 14654 | 2 |
| Mode M9 | |||
|---|---|---|---|
| Quadrant | BADHDUFLAG | Total packets | Discarded packets |
| A | 0 | 19 | 0 |
| B | 0 | 19 | 0 |
| C | 0 | 19 | 0 |
| D | 0 | 20 | 0 |
| Mode SS | |||
|---|---|---|---|
| Quadrant | BADHDUFLAG | Total packets | Discarded packets |
| A | 0 | 132 | 0 |
| B | 0 | 132 | 0 |
| C | 0 | 132 | 0 |
| D | 0 | 132 | 0 |
| Quadrant | Total seconds | Saturated seconds | Saturation percentage |
|---|---|---|---|
| A | 6504 | 42 | 0.645756% |
| B | 6504 | 54 | 0.830258% |
| C | 6504 | 16 | 0.246002% |
| D | 6504 | 79 | 1.214637% |
Noise dominated data is calculated using 1-second bins in cleaned event files. If a bin has >2000 counts, and if more than 50% of those come from <1% of pixels, then it is considered to be noise-dominated and hence unusable.
| Quadrant | # 1 sec bins | Bins with >0 counts | Bins with >2000 counts | High rate bins dominated by noise | Noise dominated (total time) | Noise dominated (detector-on time) | Marked lightcurve |
|---|---|---|---|---|---|---|---|
| A | 7594 | 6505 | 3 | 3 | 0.04% | 0.05% | 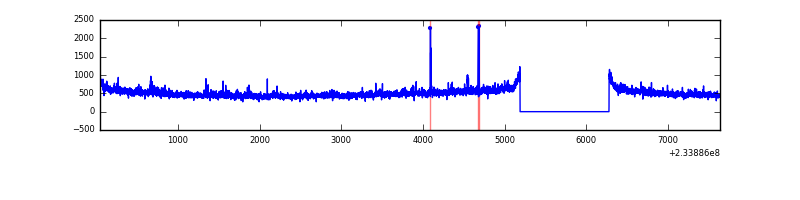 |
| B | 7594 | 6505 | 10 | 10 | 0.13% | 0.15% | 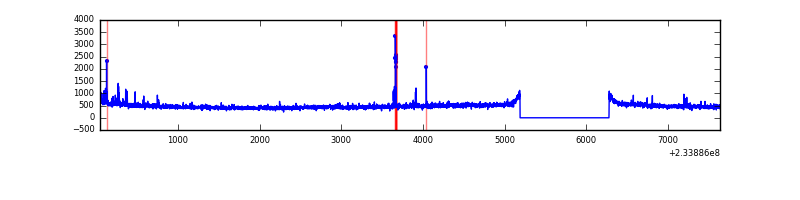 |
| C | 7594 | 6505 | 0 | 0 | 0.00% | 0.00% | 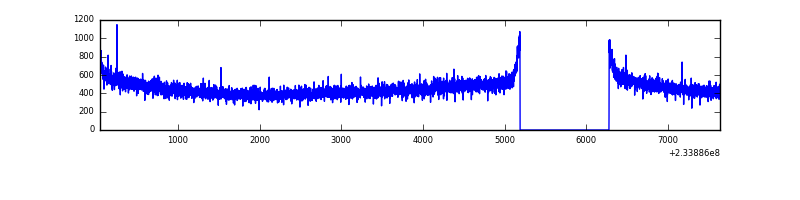 |
| D | 7594 | 6505 | 59 | 59 | 0.78% | 0.91% | 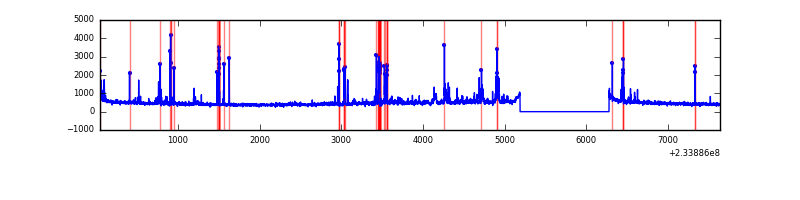 |
Top three noisy pixels from each quadrant. If the there are fewer than three noisy pixels in the level2.evt file, extra rows are filled as -1
| Pixel properties | Quadrant properties | ||||||
|---|---|---|---|---|---|---|---|
| Quadrant | DetID | PixID | Counts | Sigma | Mean | Median | Sigma |
| A | 8 | 5 | 223511 | 1405.55 | 776 | 764 | 158.5 |
| A | 1 | 162 | 32164 | 198.14 | 776 | 764 | 158.5 |
| A | 15 | 174 | 13154 | 78.18 | 776 | 764 | 158.5 |
| B | 10 | 252 | 27512 | 179.79 | 783 | 766 | 148.8 |
| B | 10 | 245 | 17826 | 114.68 | 783 | 766 | 148.8 |
| B | 12 | 111 | 15713 | 100.48 | 783 | 766 | 148.8 |
| C | 13 | 61 | 5708 | 28.34 | 754 | 761 | 174.5 |
| C | 12 | 4 | 3041 | 13.06 | 754 | 761 | 174.5 |
| C | 3 | 202 | 1800 | 5.95 | 754 | 761 | 174.5 |
| D | 2 | 14 | 207123 | 1107.28 | 742 | 724 | 186.4 |
| D | 6 | 225 | 164209 | 877.06 | 742 | 724 | 186.4 |
| D | 1 | 52 | 73772 | 391.89 | 742 | 724 | 186.4 |
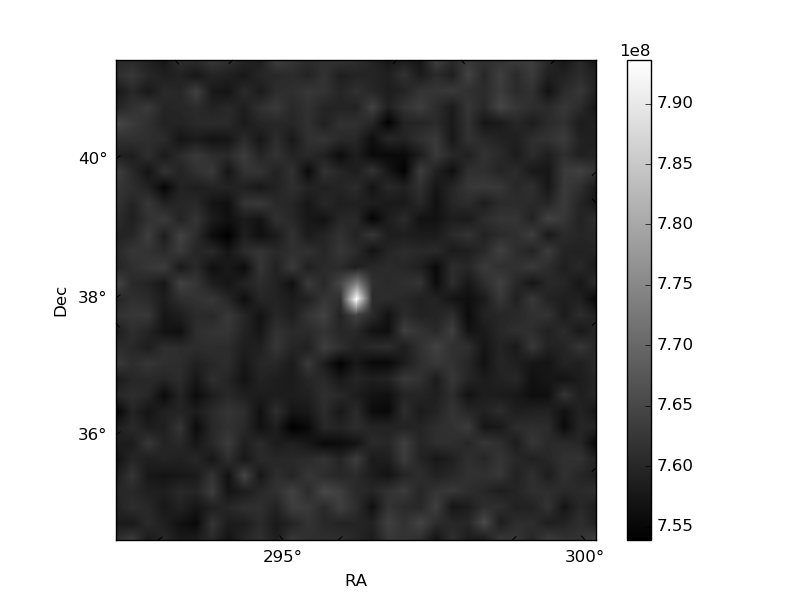
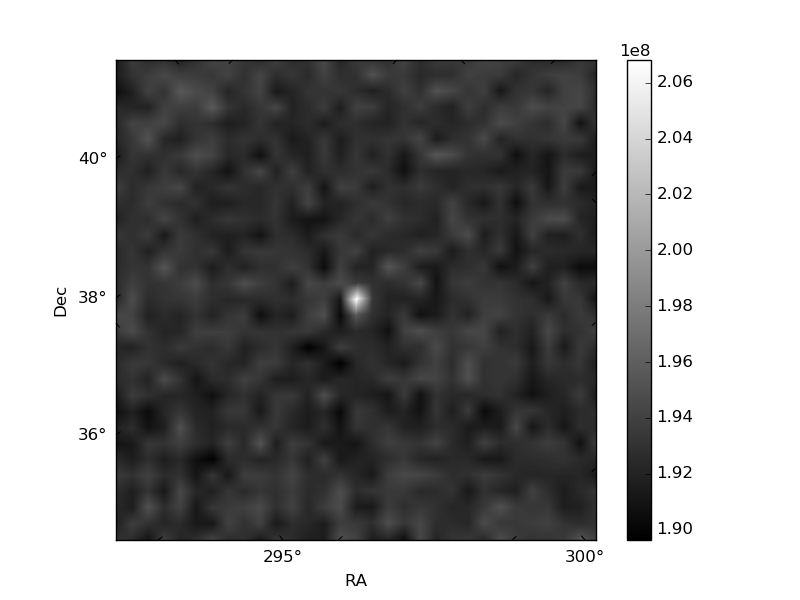
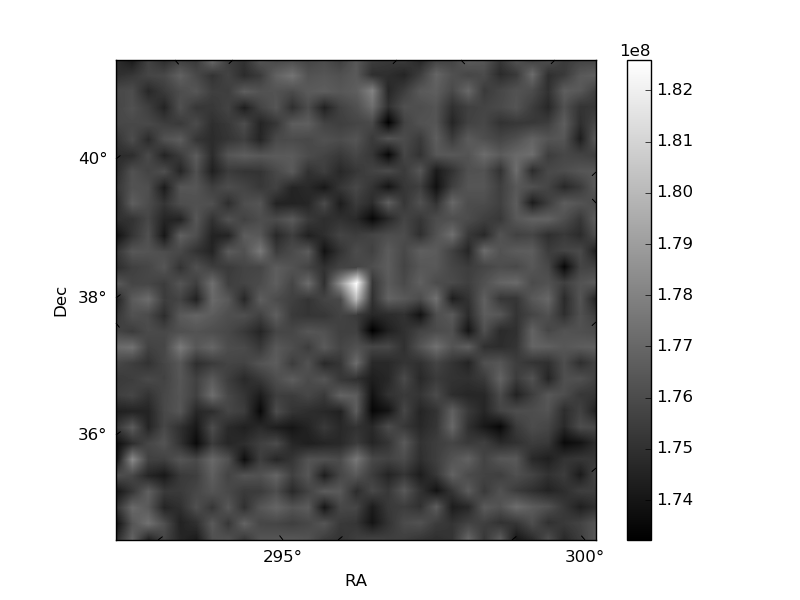
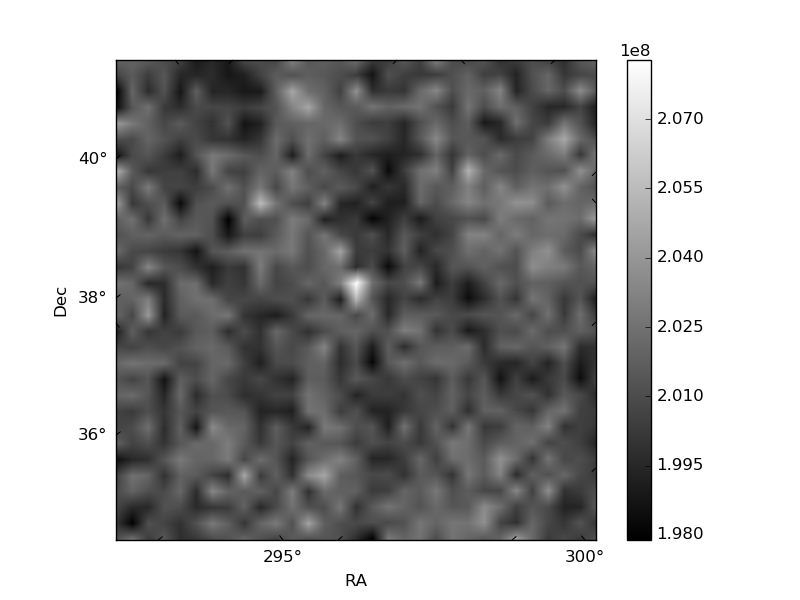
Histogram calculated using DETX and DETY for each event in the final _common_clean file
| Quadrant A | 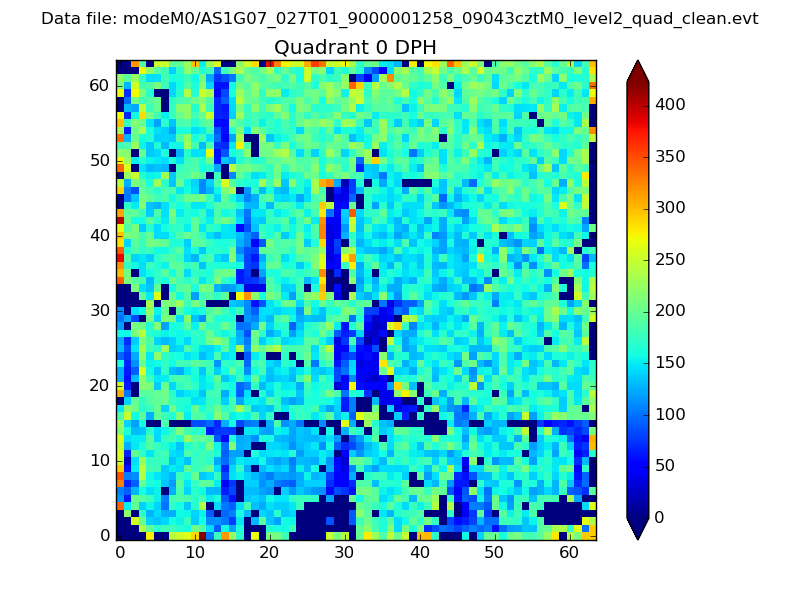 |
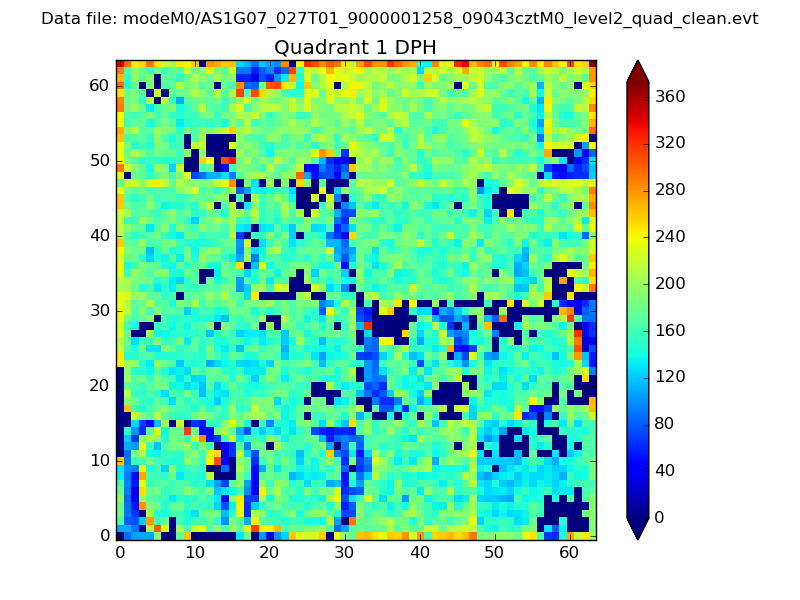 |
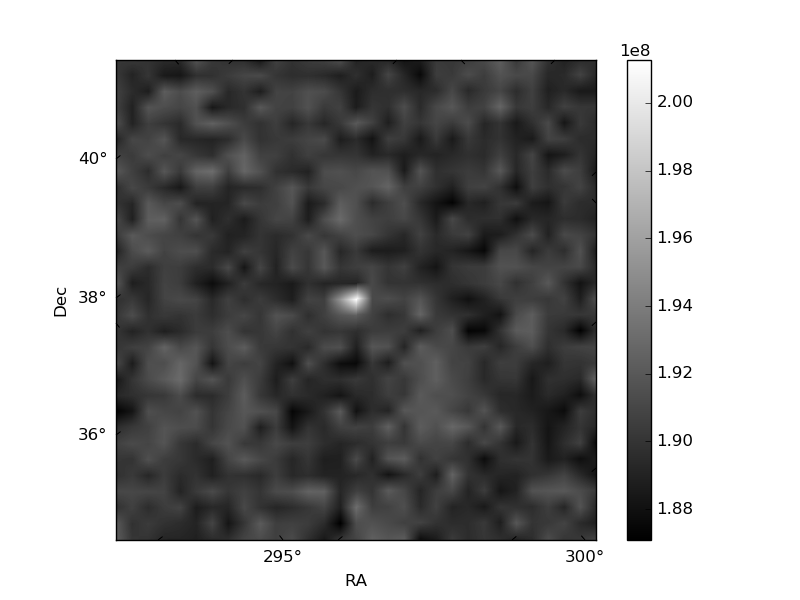
Quadrant B |
|---|---|---|---|
| Quadrant D | 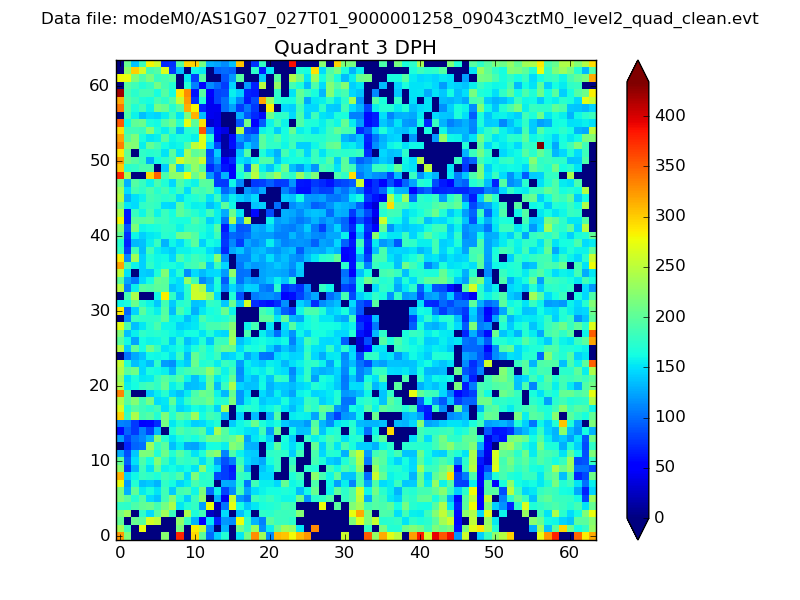 |
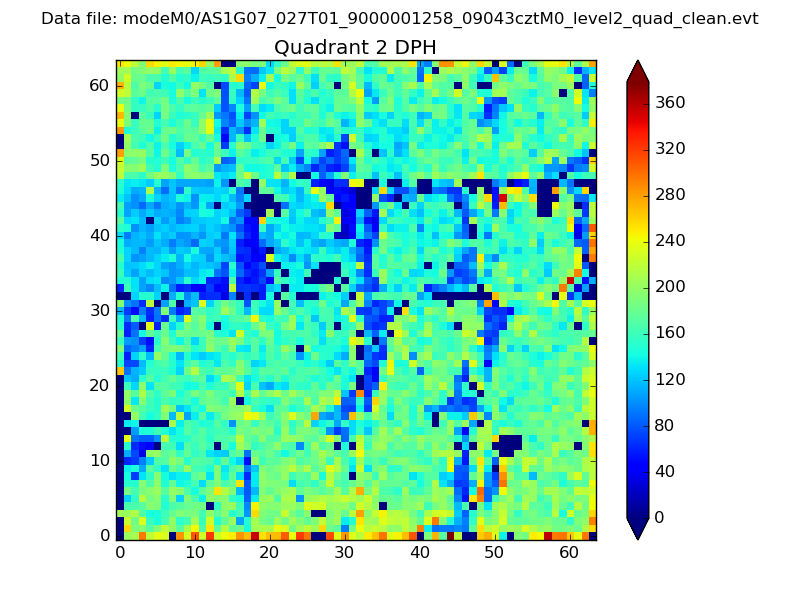 |
Quadrant C |
| Plot type | Count rate plots | Images |
|---|---|---|
| Comparison with Poisson distribution Blue bars denote a histogram of data divided into 1 sec bins. Red curve is a Poisson curve with rate = median count rate of data. |
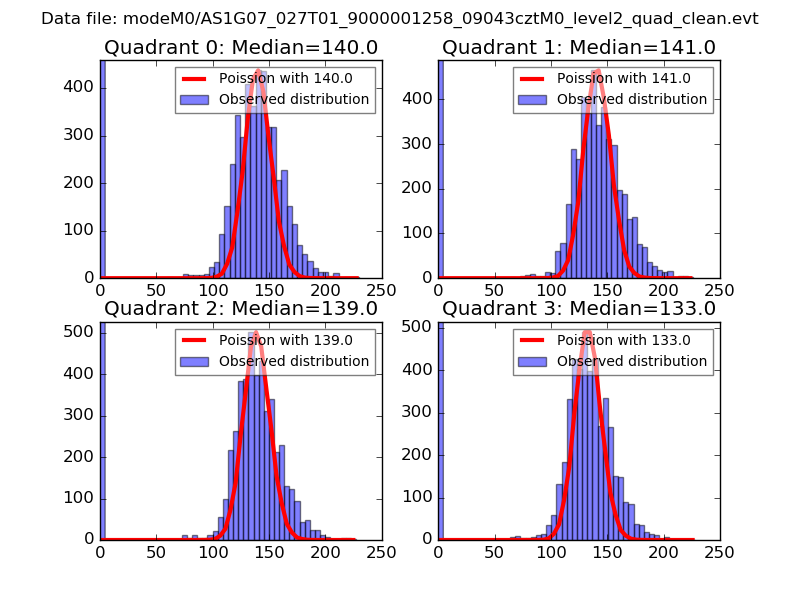 |
 |
| Quadrant-wise count rates Data is divided into 100 sec bins |
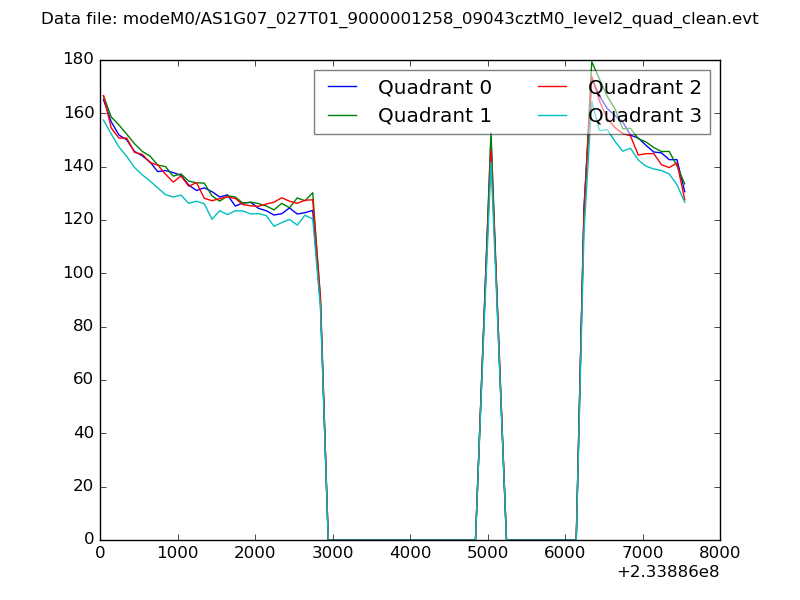 |
|
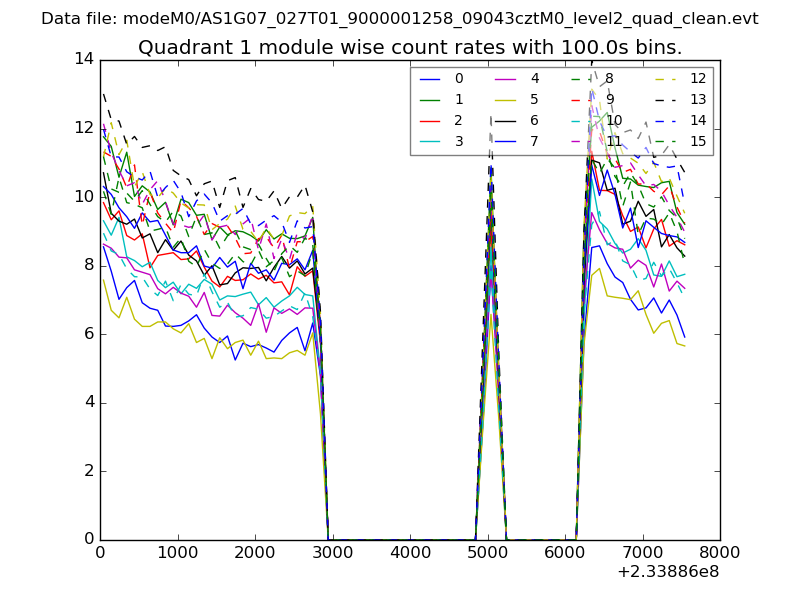
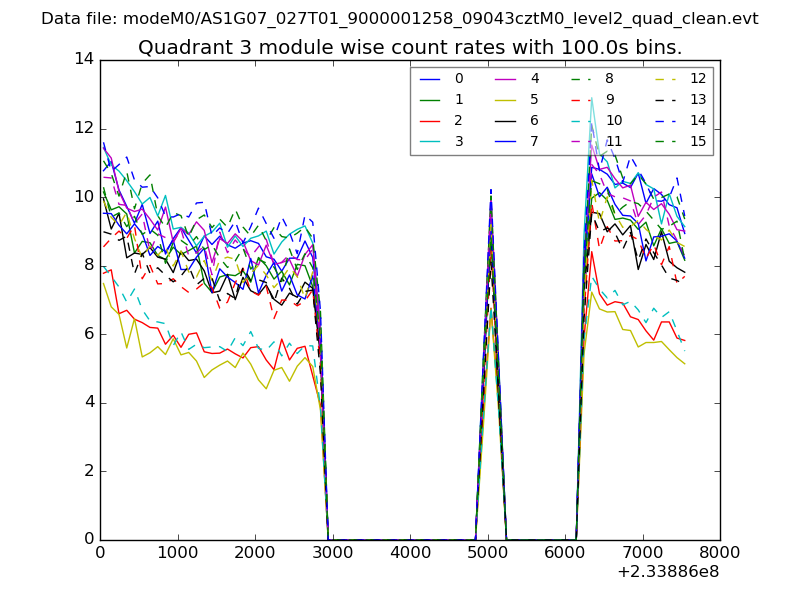
| Module-wise count rates for Quadrant A Data is divided into 100 sec bins |
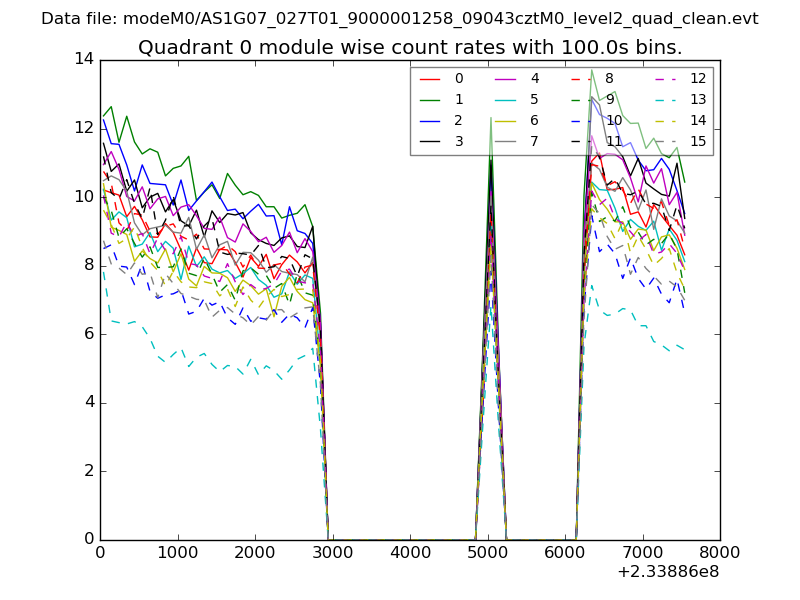 |
 |
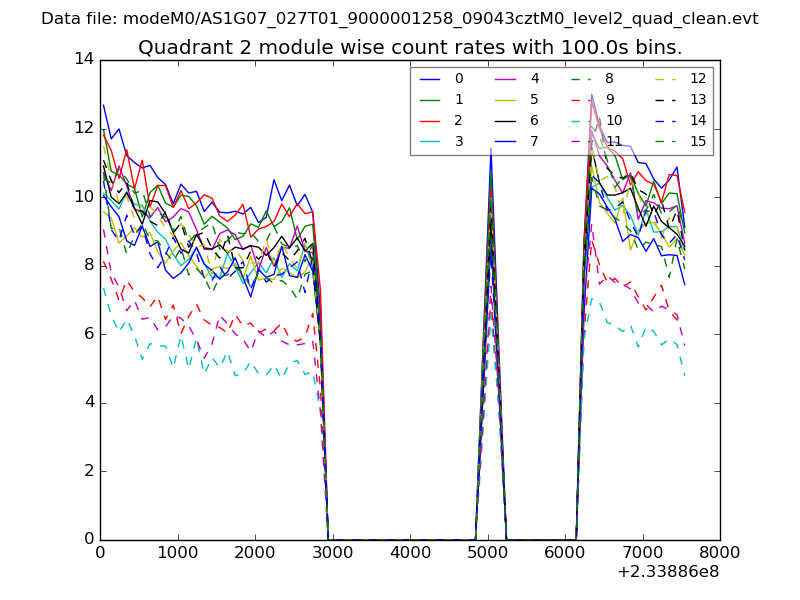
| Module-wise count rates for Quadrant B Data is divided into 100 sec bins |
 |
 |
| Module-wise count rates for Quadrant C Data is divided into 100 sec bins |
 |
 |
| Module-wise count rates for Quadrant D Data is divided into 100 sec bins |
 |
 |
| Parameter | Plot |
|---|---|
| CZT HV Monitor | 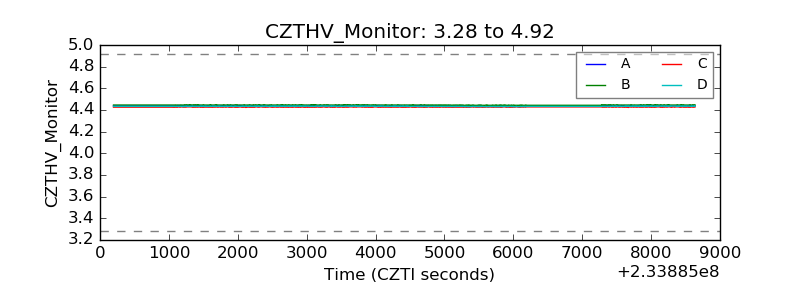 |
| D_VDD | 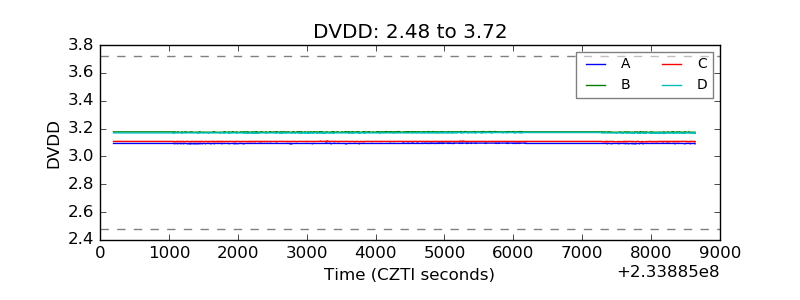 |
| Temperature 1 | 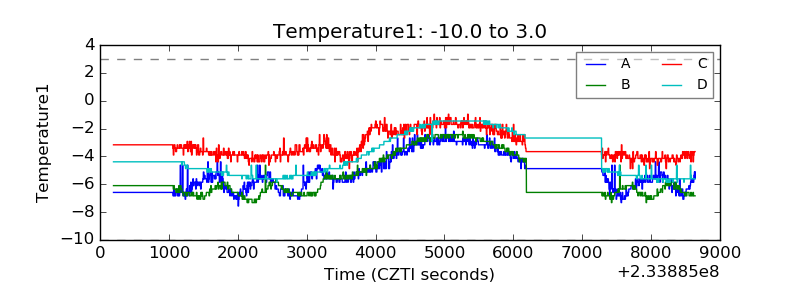 |
| Veto HV Monitor |  |
| Veto LLD | 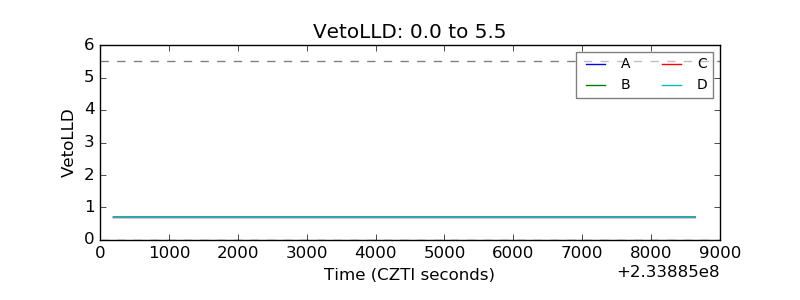 |
| Alpha Counter | 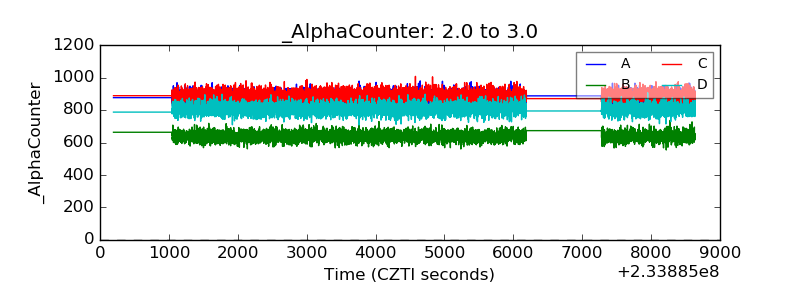 |
| _CPM_Rate | 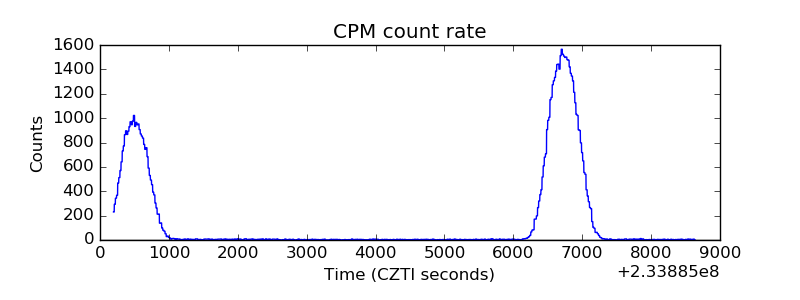 |
| CZT Counter | 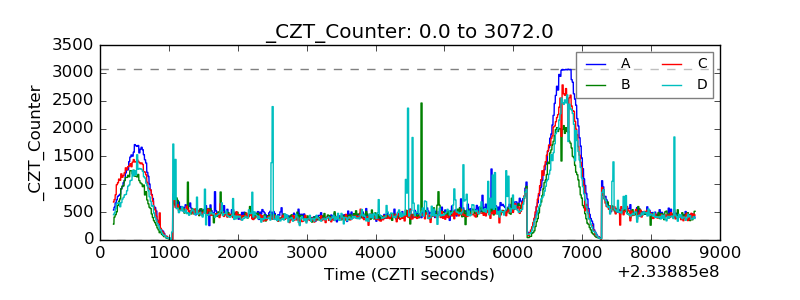 |
| +2.5 Volts monitor |  |
| +5 Volts monitor |  |
| _ROLL_ROT | 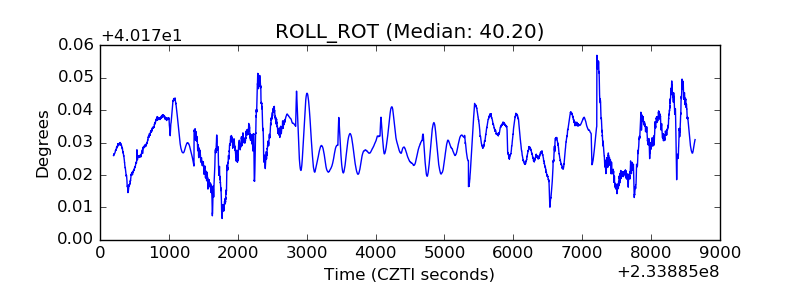 |
| _Roll_DEC | 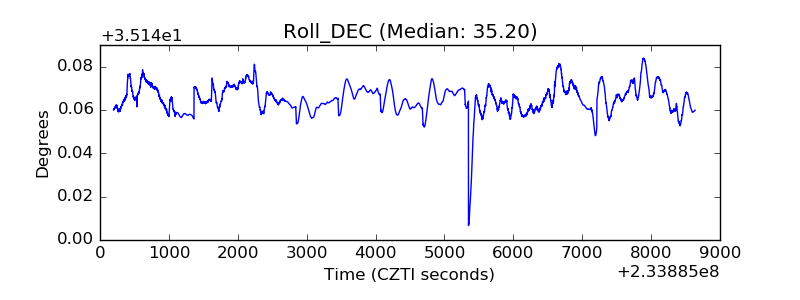 |
| _Roll_RA | 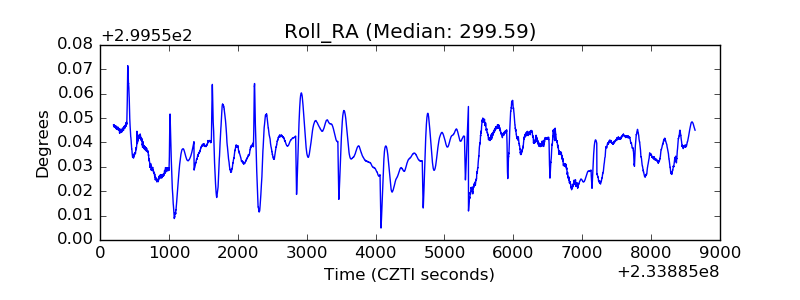 |
| Veto Counter | 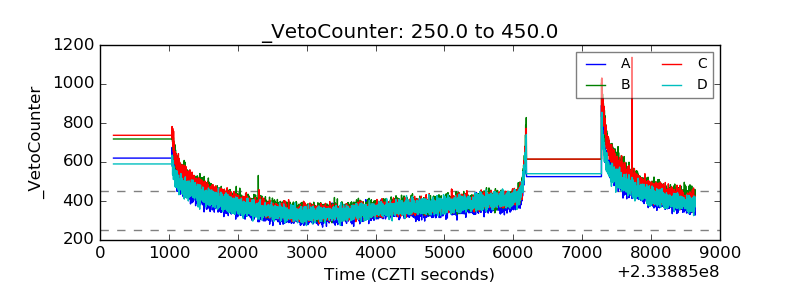 |