| Param | Original file | Final file |
|---|---|---|
| Filename | modeM0/AS1G07_027T01_9000001258_09046cztM0_level2.evt | modeM0/AS1G07_027T01_9000001258_09046cztM0_level2_quad_clean.evt |
| Size (bytes) | 318,481,920 | 64,595,520 |
| Size | 303.7 MB | 61.6 MB |
| Events in quadrant A | 2,405,650 | 417,654 |
| Events in quadrant B | 2,211,168 | 420,637 |
| Events in quadrant C | 2,099,339 | 414,491 |
| Events in quadrant D | 2,625,675 | 390,859 |
| Mode M0 | |||
|---|---|---|---|
| Quadrant | BADHDUFLAG | Total packets | Discarded packets |
| A | 0 | 11445 | 1546 |
| B | 0 | 10746 | 1454 |
| C | 0 | 10538 | 1401 |
| D | 0 | 12759 | 1992 |
| Mode M9 | |||
|---|---|---|---|
| Quadrant | BADHDUFLAG | Total packets | Discarded packets |
| A | 0 | 13 | 1 |
| B | 0 | 13 | 1 |
| C | 0 | 13 | 1 |
| D | 0 | 13 | 1 |
| Mode SS | |||
|---|---|---|---|
| Quadrant | BADHDUFLAG | Total packets | Discarded packets |
| A | 0 | 104 | 12 |
| B | 0 | 104 | 18 |
| C | 0 | 104 | 14 |
| D | 0 | 104 | 18 |
| Quadrant | Total seconds | Saturated seconds | Saturation percentage |
|---|---|---|---|
| A | 4437 | 12 | 0.270453% |
| B | 4435 | 21 | 0.473506% |
| C | 4457 | 12 | 0.269239% |
| D | 4424 | 97 | 2.192586% |
Noise dominated data is calculated using 1-second bins in cleaned event files. If a bin has >2000 counts, and if more than 50% of those come from <1% of pixels, then it is considered to be noise-dominated and hence unusable.
| Quadrant | # 1 sec bins | Bins with >0 counts | Bins with >2000 counts | High rate bins dominated by noise | Noise dominated (total time) | Noise dominated (detector-on time) | Marked lightcurve |
|---|---|---|---|---|---|---|---|
| A | 6441 | 4868 | 0 | 0 | 0.00% | 0.00% | 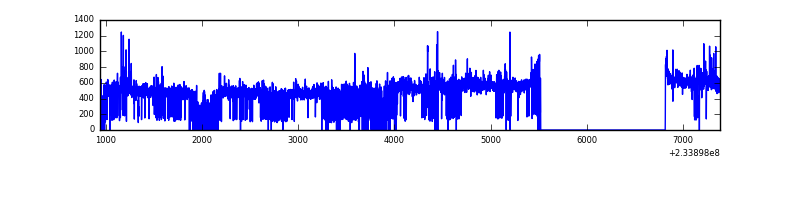 |
| B | 6440 | 4880 | 4 | 4 | 0.06% | 0.08% | 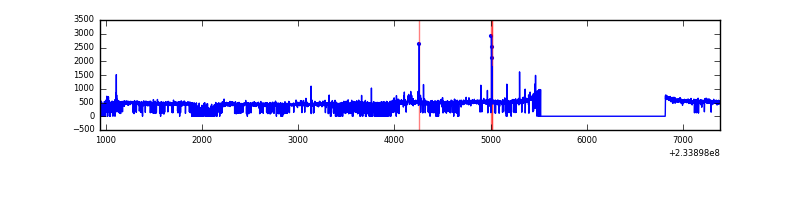 |
| C | 6439 | 4884 | 4 | 4 | 0.06% | 0.08% | 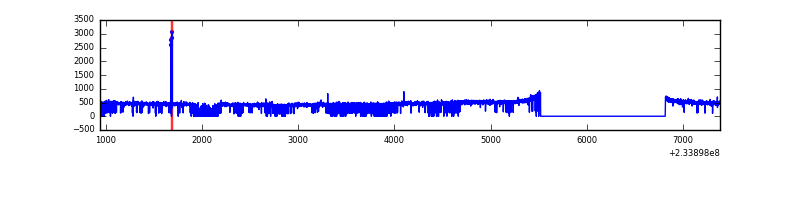 |
| D | 6441 | 4857 | 70 | 70 | 1.09% | 1.44% | 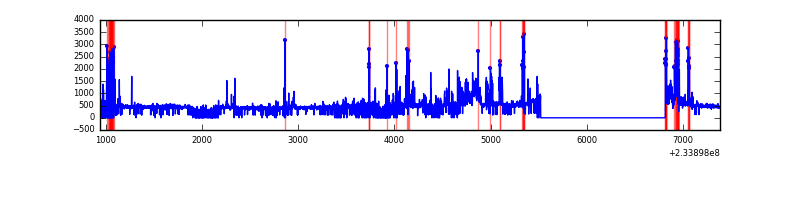 |
Top three noisy pixels from each quadrant. If the there are fewer than three noisy pixels in the level2.evt file, extra rows are filled as -1
| Pixel properties | Quadrant properties | ||||||
|---|---|---|---|---|---|---|---|
| Quadrant | DetID | PixID | Counts | Sigma | Mean | Median | Sigma |
| A | 8 | 5 | 101809 | 890.83 | 555 | 547 | 113.7 |
| A | 1 | 162 | 76367 | 667.01 | 555 | 547 | 113.7 |
| A | 1 | 178 | 20083 | 171.86 | 555 | 547 | 113.7 |
| B | 6 | 51 | 18694 | 172.63 | 554 | 543 | 105.1 |
| B | 10 | 252 | 12045 | 109.39 | 554 | 543 | 105.1 |
| B | 12 | 111 | 10886 | 98.37 | 554 | 543 | 105.1 |
| C | 3 | 254 | 17359 | 135.73 | 534 | 538 | 123.9 |
| C | 13 | 61 | 3977 | 27.75 | 534 | 538 | 123.9 |
| C | 3 | 202 | 1376 | 6.76 | 534 | 538 | 123.9 |
| D | 6 | 225 | 222258 | 1764.18 | 523 | 510 | 125.7 |
| D | 2 | 14 | 210818 | 1673.16 | 523 | 510 | 125.7 |
| D | 12 | 233 | 76078 | 601.2 | 523 | 510 | 125.7 |
Histogram calculated using DETX and DETY for each event in the final _common_clean file
| Quadrant A | 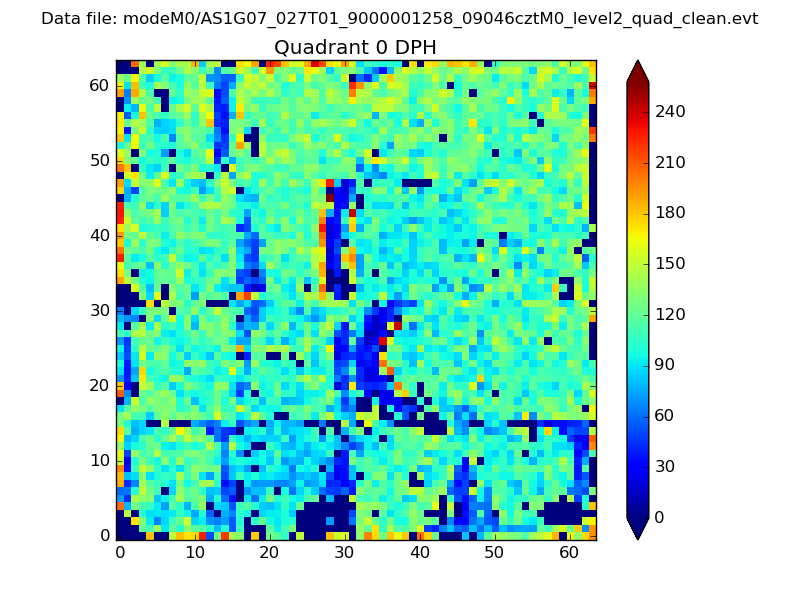 |
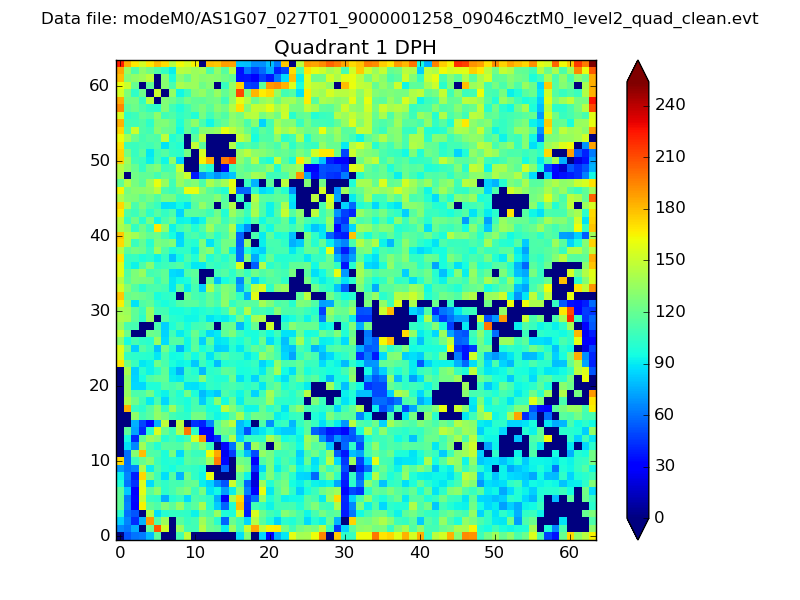 |
Quadrant B |
|---|---|---|---|
| Quadrant D | 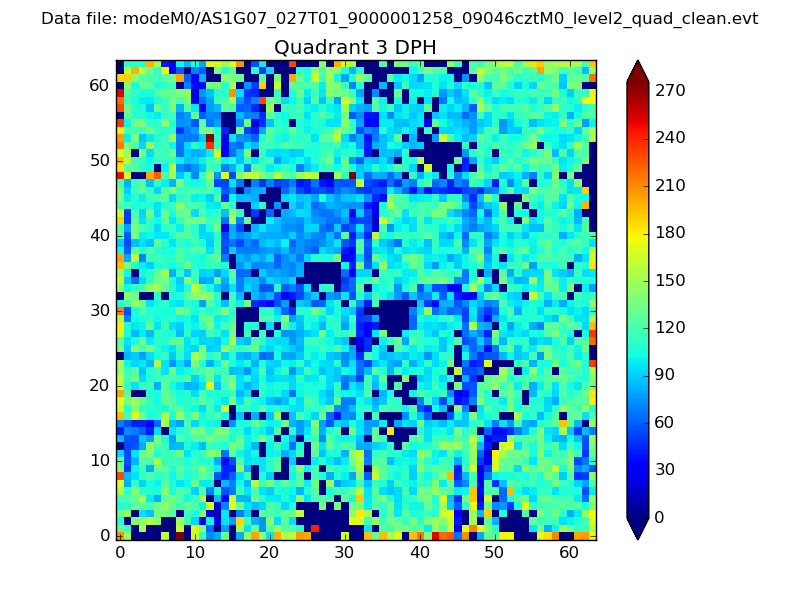 |
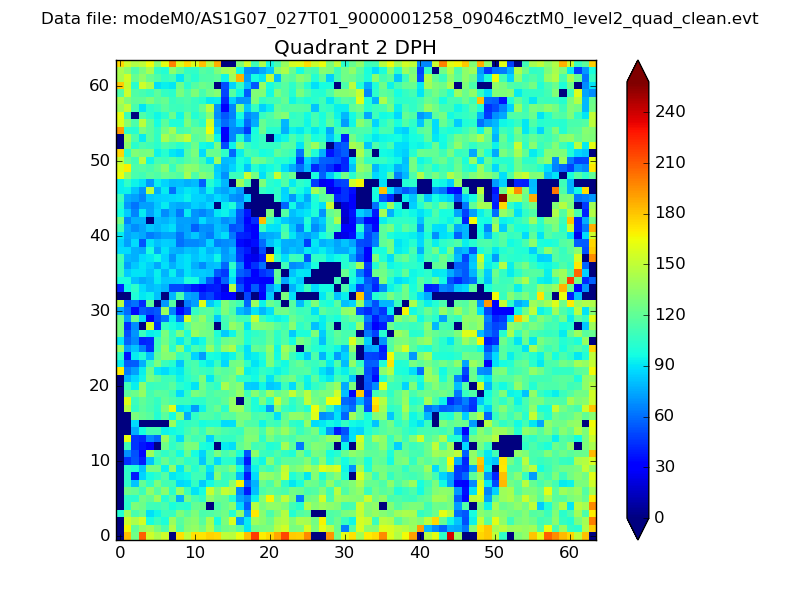 |
Quadrant C |
| Plot type | Count rate plots | Images |
|---|---|---|
| Comparison with Poisson distribution Blue bars denote a histogram of data divided into 1 sec bins. Red curve is a Poisson curve with rate = median count rate of data. |
 |
 |
| Quadrant-wise count rates Data is divided into 100 sec bins |
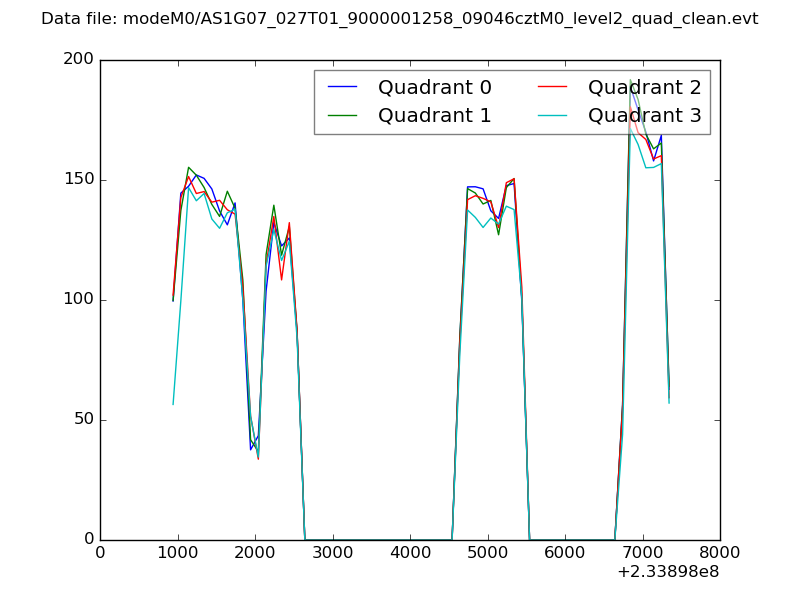 |
|
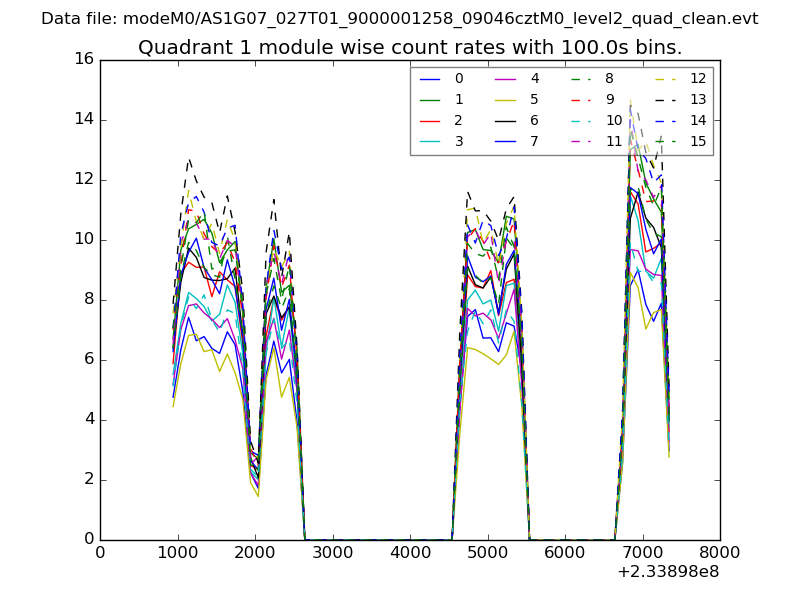
| Module-wise count rates for Quadrant A Data is divided into 100 sec bins |
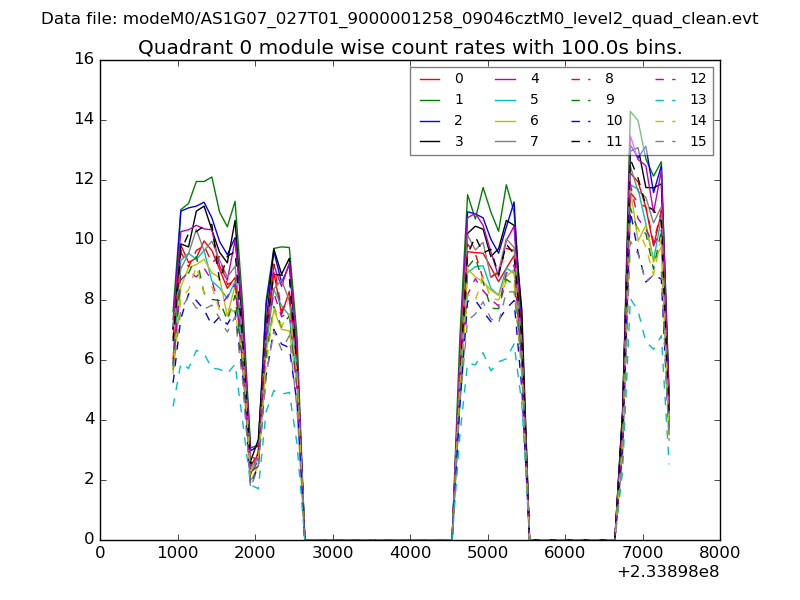 |
 |
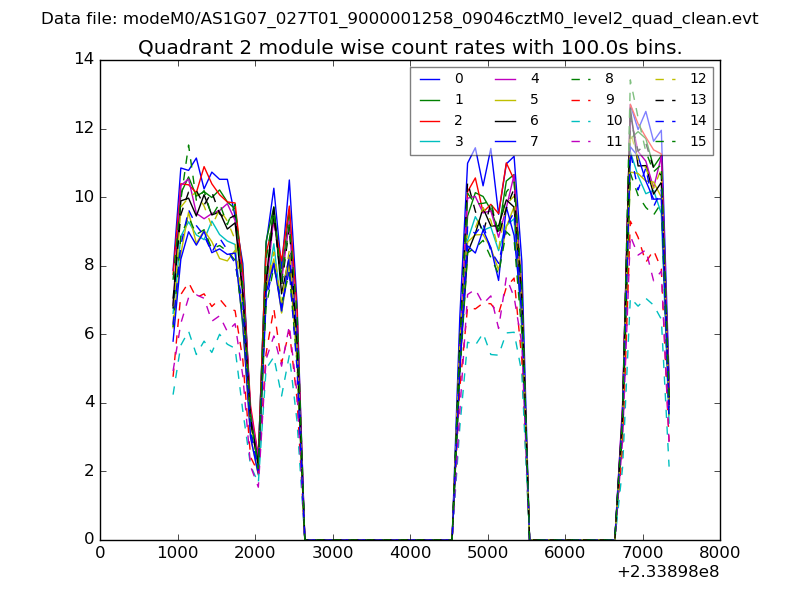
| Module-wise count rates for Quadrant B Data is divided into 100 sec bins |
 |
 |
| Module-wise count rates for Quadrant C Data is divided into 100 sec bins |
 |
 |
| Module-wise count rates for Quadrant D Data is divided into 100 sec bins |
 |
 |
| Parameter | Plot |
|---|---|
| CZT HV Monitor | 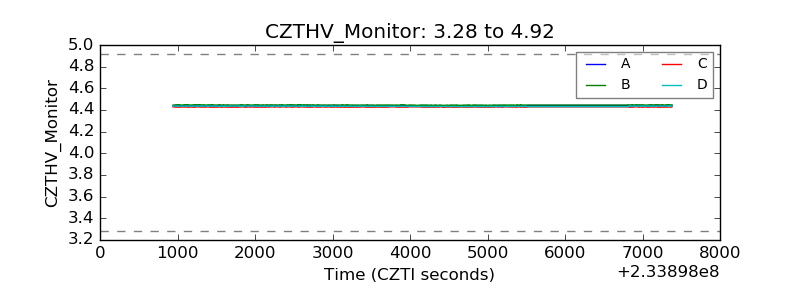 |
| D_VDD | 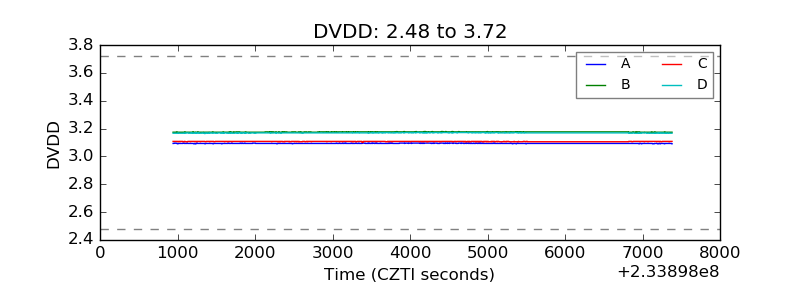 |
| Temperature 1 |  |
| Veto HV Monitor | 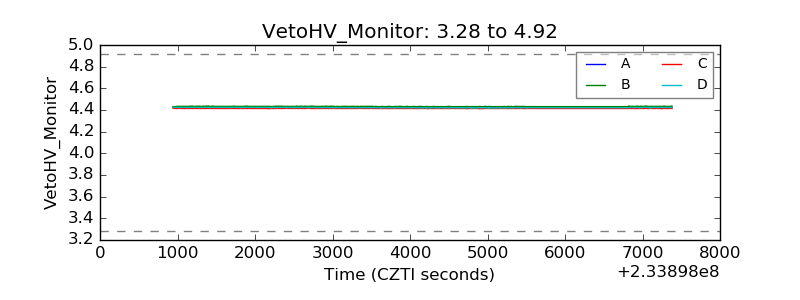 |
| Veto LLD | 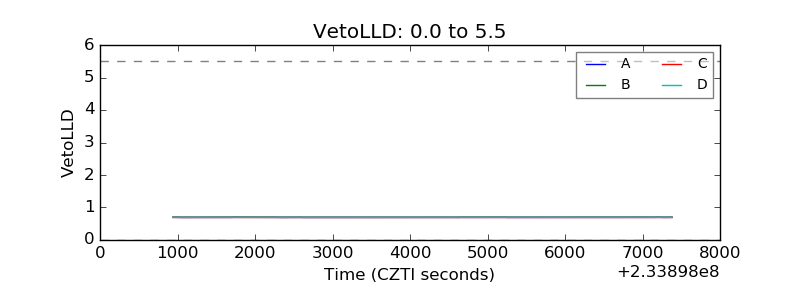 |
| Alpha Counter | 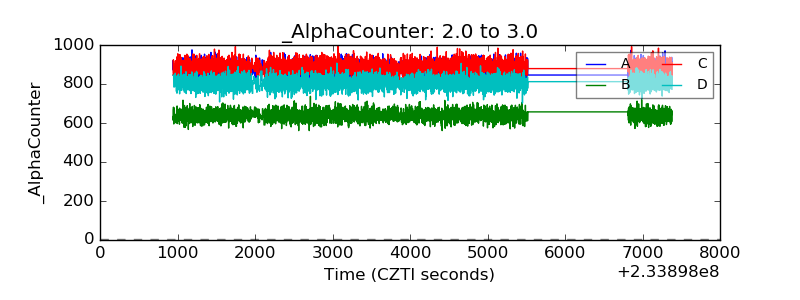 |
| _CPM_Rate | 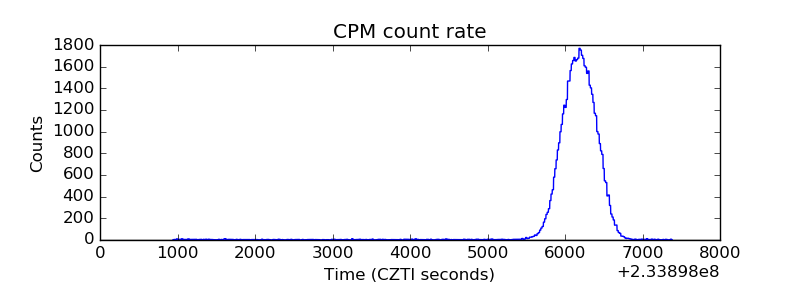 |
| CZT Counter | 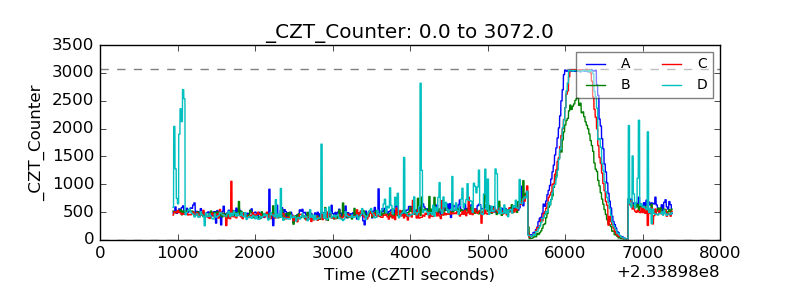 |
| +2.5 Volts monitor |  |
| +5 Volts monitor |  |
| _ROLL_ROT | 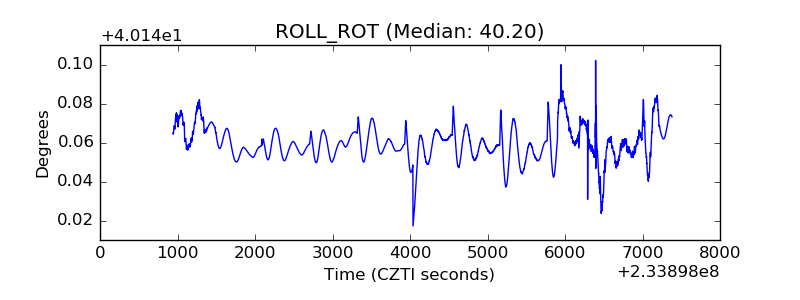 |
| _Roll_DEC |  |
| _Roll_RA | 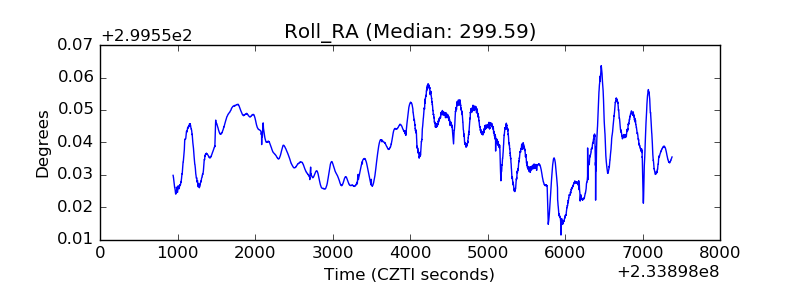 |
| Veto Counter | 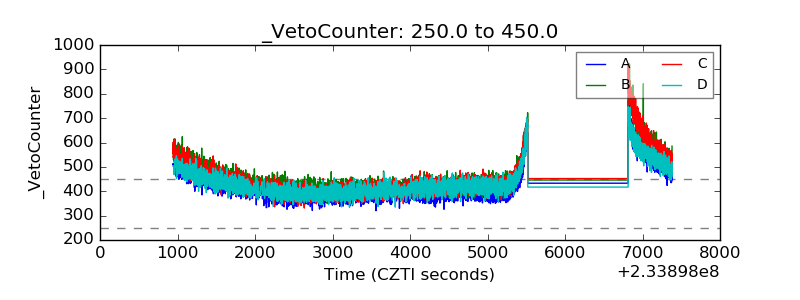 |