| Param | Original file | Final file |
|---|---|---|
| Filename | modeM0/AS1G07_027T01_9000001258_09049cztM0_level2.evt | modeM0/AS1G07_027T01_9000001258_09049cztM0_level2_quad_clean.evt |
| Size (bytes) | 302,503,680 | 54,691,200 |
| Size | 288.5 MB | 52.2 MB |
| Events in quadrant A | 2,298,496 | 346,321 |
| Events in quadrant B | 2,100,508 | 349,244 |
| Events in quadrant C | 1,982,874 | 339,047 |
| Events in quadrant D | 2,492,462 | 325,392 |
| Mode M0 | |||
|---|---|---|---|
| Quadrant | BADHDUFLAG | Total packets | Discarded packets |
| A | 0 | 9977 | 504 |
| B | 0 | 9359 | 532 |
| C | 0 | 9168 | 522 |
| D | 0 | 10824 | 598 |
| Mode M9 | |||
|---|---|---|---|
| Quadrant | BADHDUFLAG | Total packets | Discarded packets |
| A | 0 | 13 | 0 |
| B | 0 | 13 | 0 |
| C | 0 | 13 | 0 |
| D | 0 | 13 | 0 |
| Mode SS | |||
|---|---|---|---|
| Quadrant | BADHDUFLAG | Total packets | Discarded packets |
| A | 0 | 90 | 6 |
| B | 0 | 90 | 6 |
| C | 0 | 90 | 8 |
| D | 0 | 90 | 2 |
| Quadrant | Total seconds | Saturated seconds | Saturation percentage |
|---|---|---|---|
| A | 4215 | 17 | 0.403321% |
| B | 4199 | 27 | 0.643010% |
| C | 4203 | 15 | 0.356888% |
| D | 4203 | 80 | 1.903402% |
Noise dominated data is calculated using 1-second bins in cleaned event files. If a bin has >2000 counts, and if more than 50% of those come from <1% of pixels, then it is considered to be noise-dominated and hence unusable.
| Quadrant | # 1 sec bins | Bins with >0 counts | Bins with >2000 counts | High rate bins dominated by noise | Noise dominated (total time) | Noise dominated (detector-on time) | Marked lightcurve |
|---|---|---|---|---|---|---|---|
| A | 5755 | 4405 | 0 | 0 | 0.00% | 0.00% | 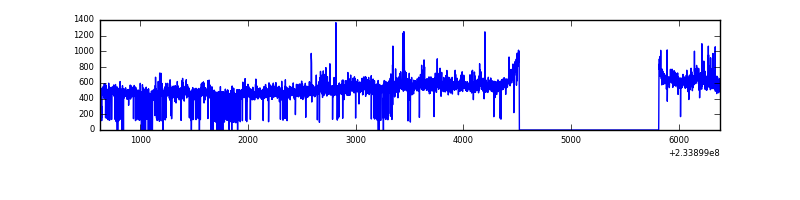 |
| B | 5755 | 4397 | 4 | 4 | 0.07% | 0.09% | 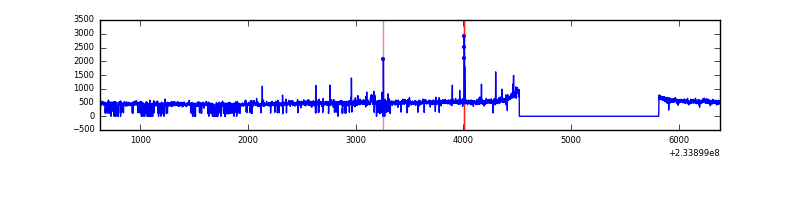 |
| C | 5754 | 4406 | 4 | 4 | 0.07% | 0.09% | 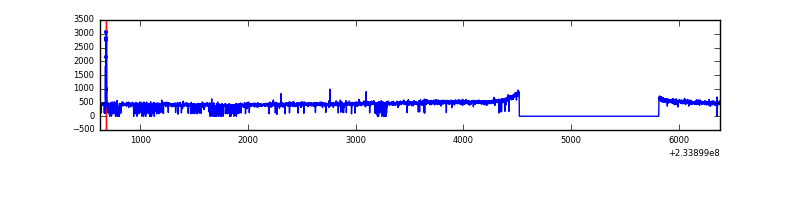 |
| D | 5755 | 4397 | 57 | 57 | 0.99% | 1.30% | 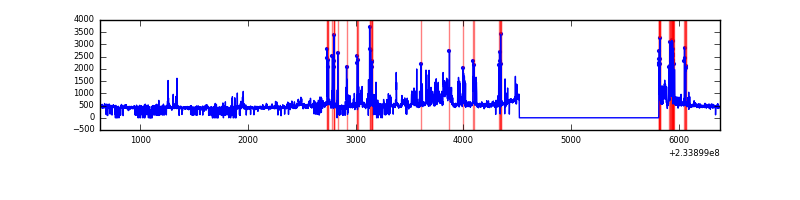 |
Top three noisy pixels from each quadrant. If the there are fewer than three noisy pixels in the level2.evt file, extra rows are filled as -1
| Pixel properties | Quadrant properties | ||||||
|---|---|---|---|---|---|---|---|
| Quadrant | DetID | PixID | Counts | Sigma | Mean | Median | Sigma |
| A | 8 | 5 | 102600 | 944.21 | 529 | 520 | 108.1 |
| A | 1 | 162 | 80916 | 743.64 | 529 | 520 | 108.1 |
| A | 1 | 178 | 21183 | 191.13 | 529 | 520 | 108.1 |
| B | 6 | 51 | 17608 | 169.45 | 526 | 514 | 100.9 |
| B | 10 | 252 | 12543 | 119.24 | 526 | 514 | 100.9 |
| B | 12 | 111 | 10374 | 97.74 | 526 | 514 | 100.9 |
| C | 3 | 254 | 17052 | 141.21 | 504 | 506 | 117.2 |
| C | 13 | 61 | 3770 | 27.86 | 504 | 506 | 117.2 |
| C | 3 | 202 | 1287 | 6.67 | 504 | 506 | 117.2 |
| D | 6 | 225 | 235386 | 1938.04 | 500 | 488 | 121.2 |
| D | 2 | 14 | 132241 | 1087.04 | 500 | 488 | 121.2 |
| D | 1 | 52 | 90206 | 740.22 | 500 | 488 | 121.2 |
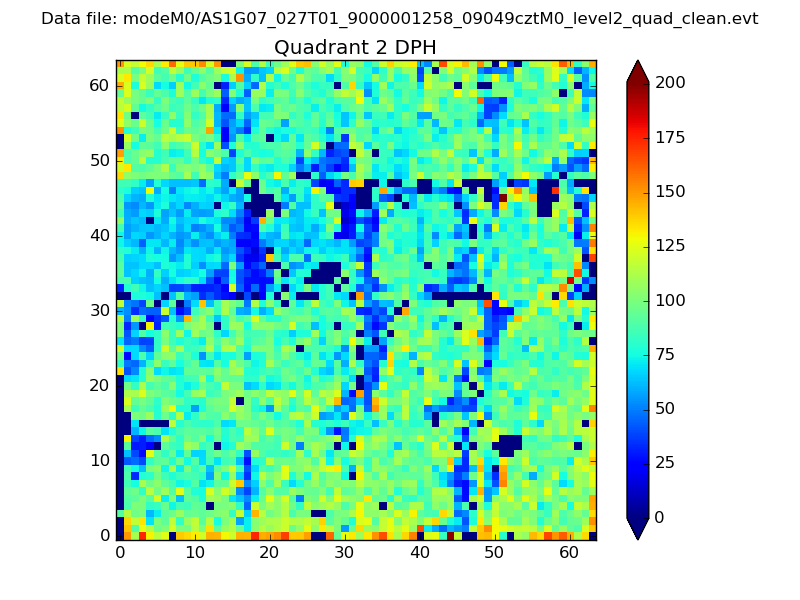
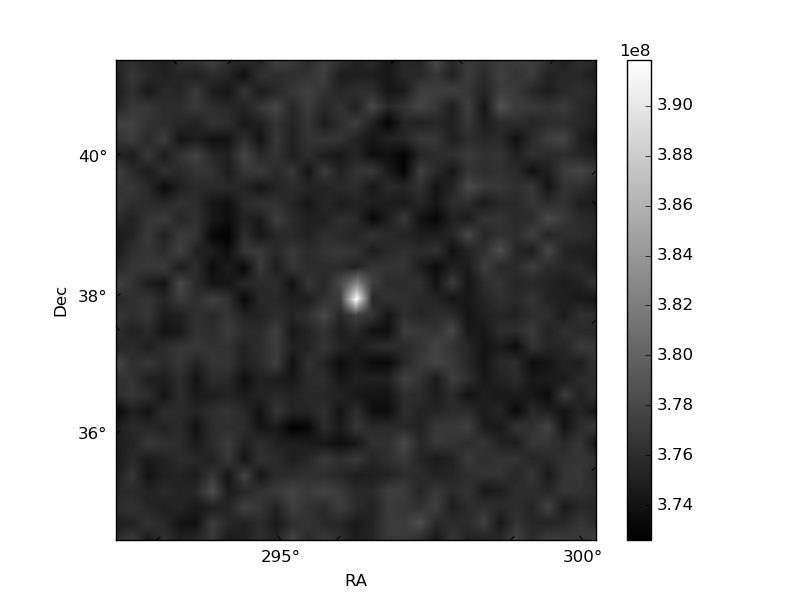
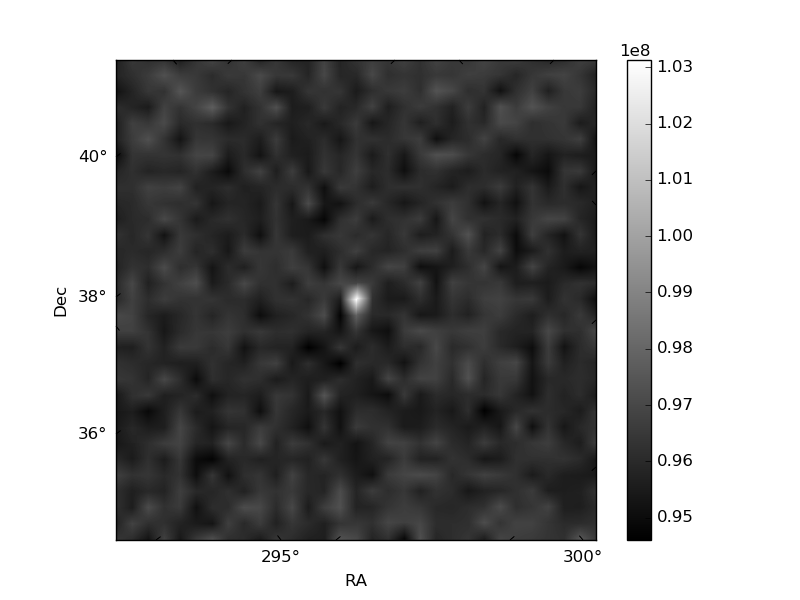
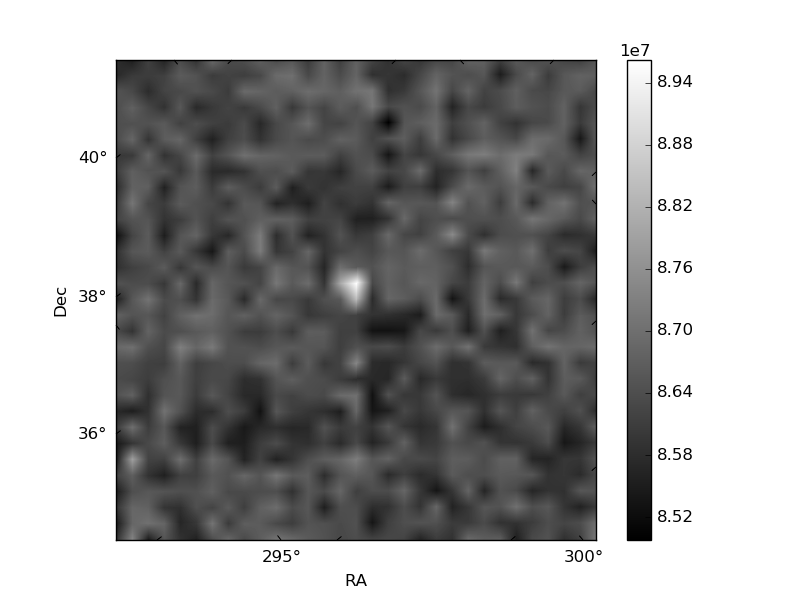
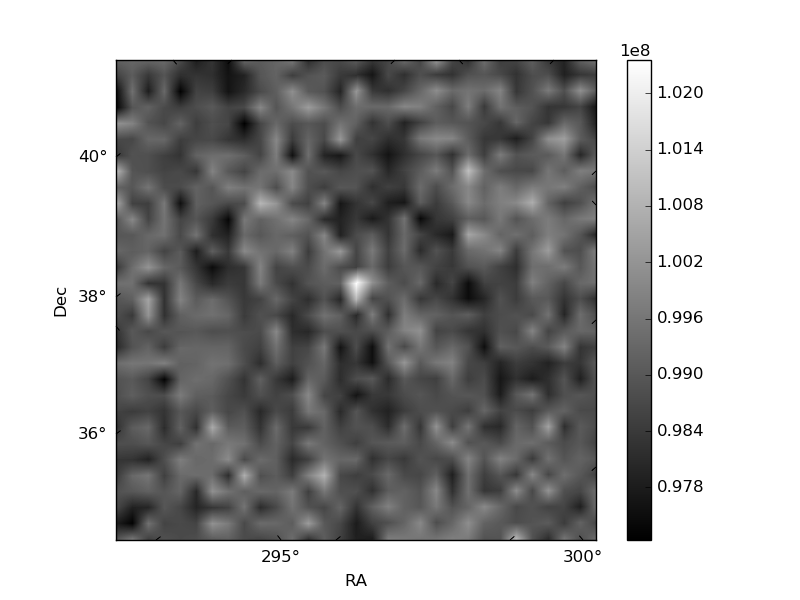
Histogram calculated using DETX and DETY for each event in the final _common_clean file
| Quadrant A | 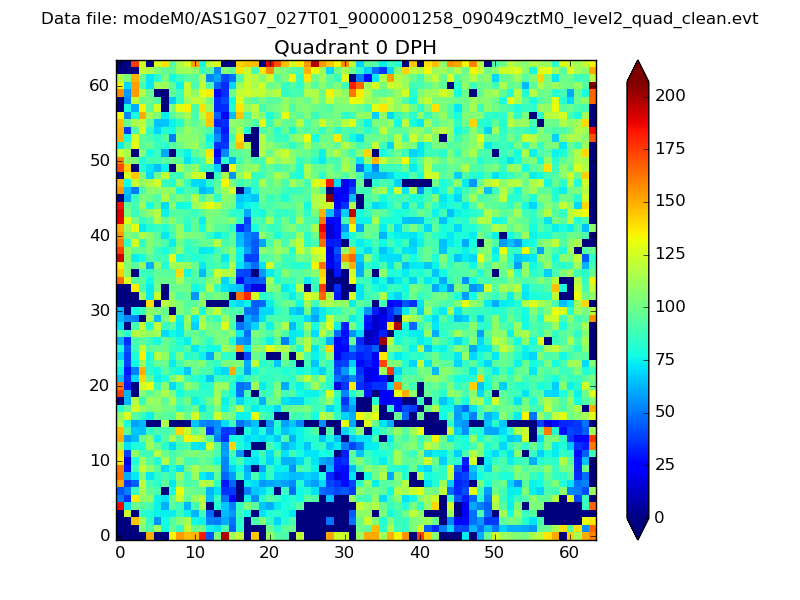 |
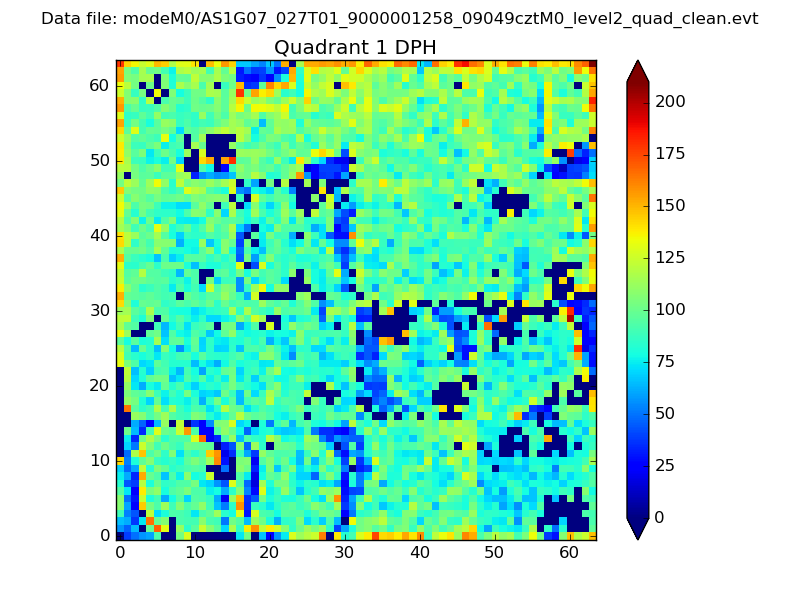 |
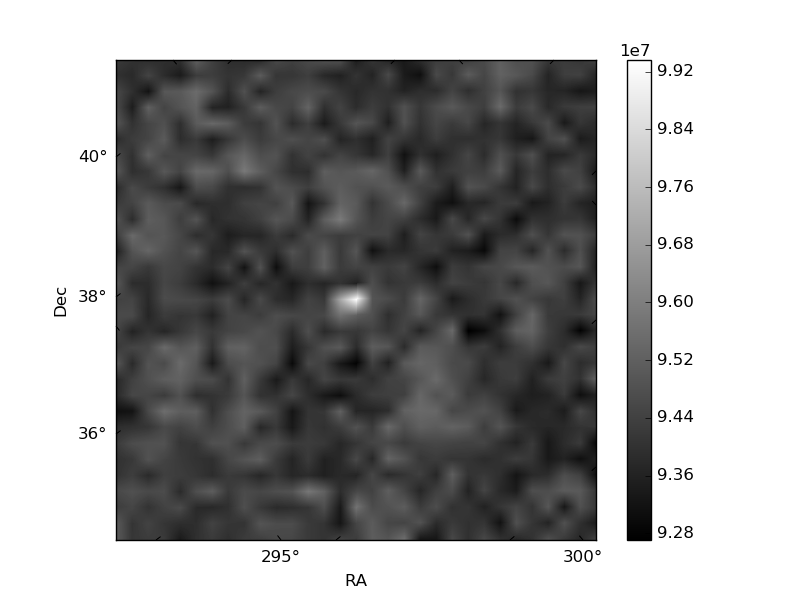
Quadrant B |
|---|---|---|---|
| Quadrant D | 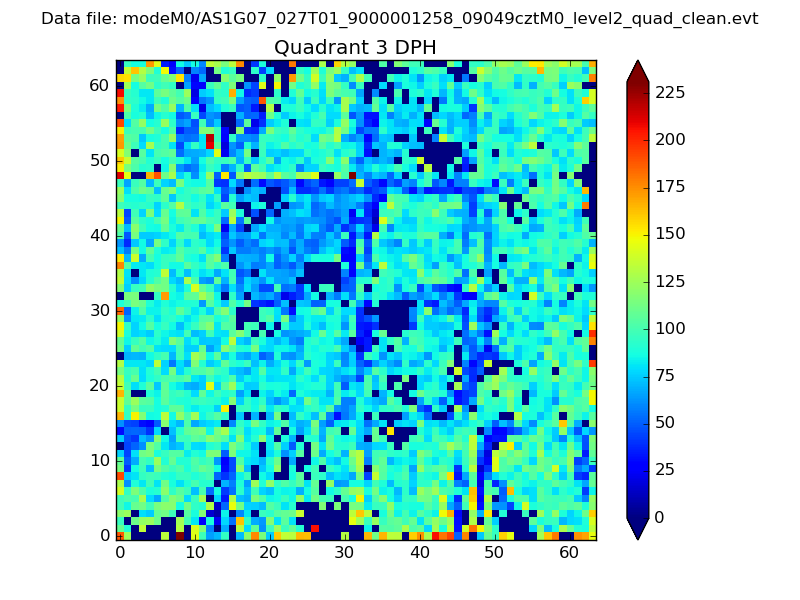 |
 |
Quadrant C |
| Plot type | Count rate plots | Images |
|---|---|---|
| Comparison with Poisson distribution Blue bars denote a histogram of data divided into 1 sec bins. Red curve is a Poisson curve with rate = median count rate of data. |
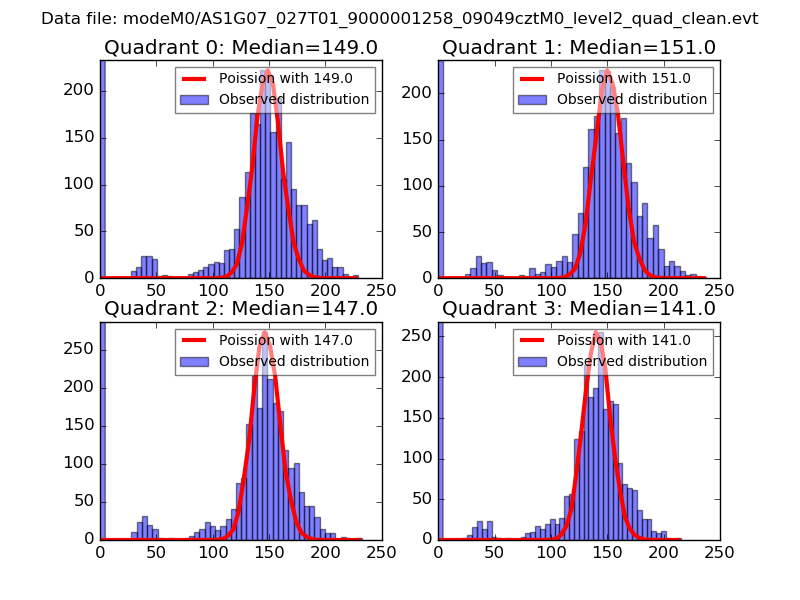 |
 |
| Quadrant-wise count rates Data is divided into 100 sec bins |
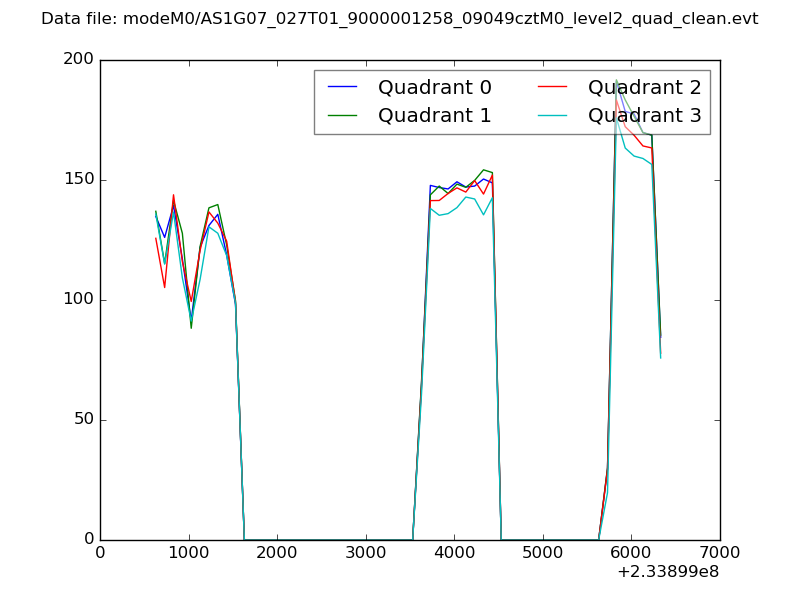 |
|
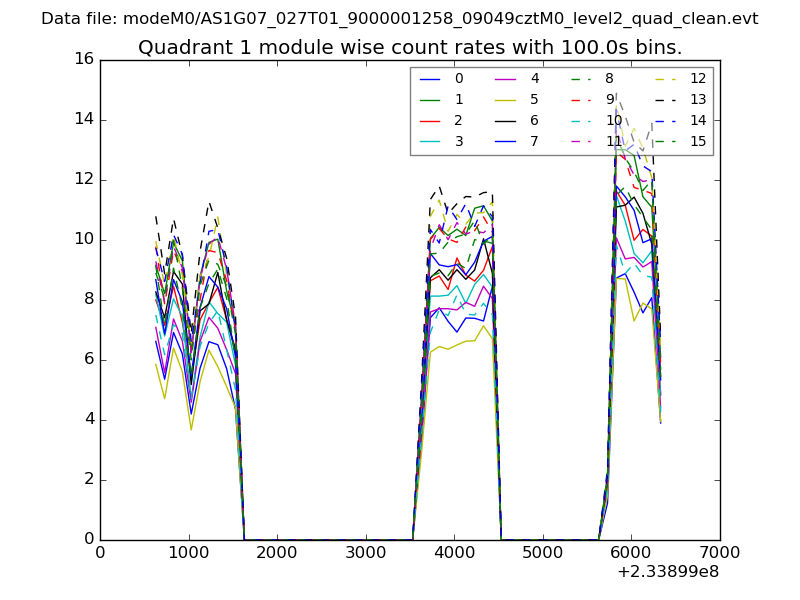
| Module-wise count rates for Quadrant A Data is divided into 100 sec bins |
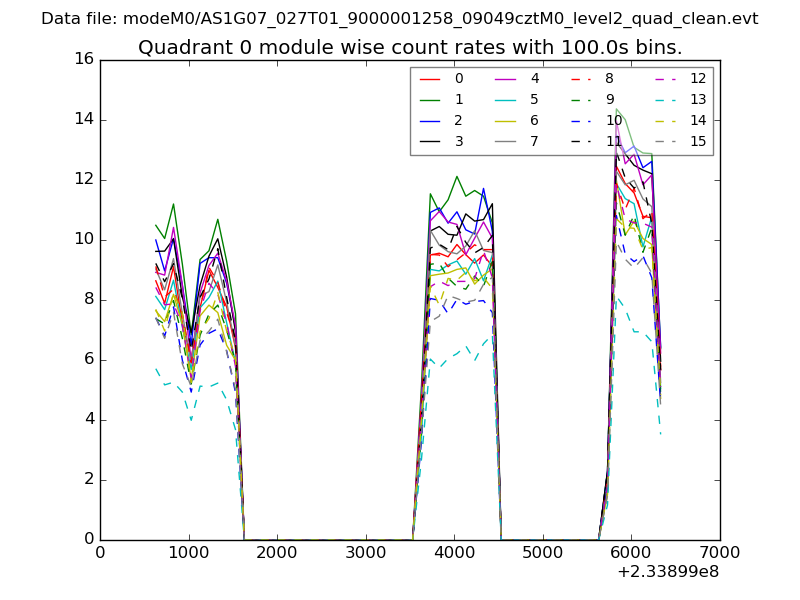 |
 |
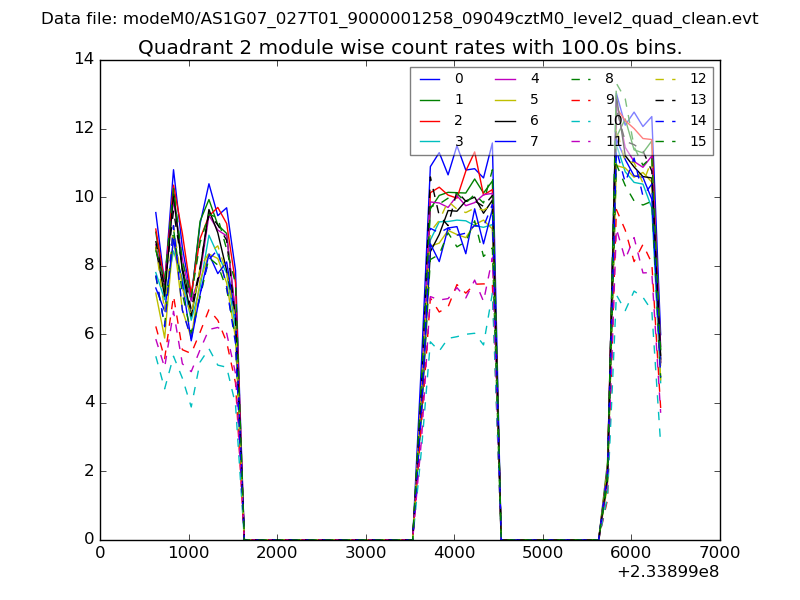
| Module-wise count rates for Quadrant B Data is divided into 100 sec bins |
 |
 |
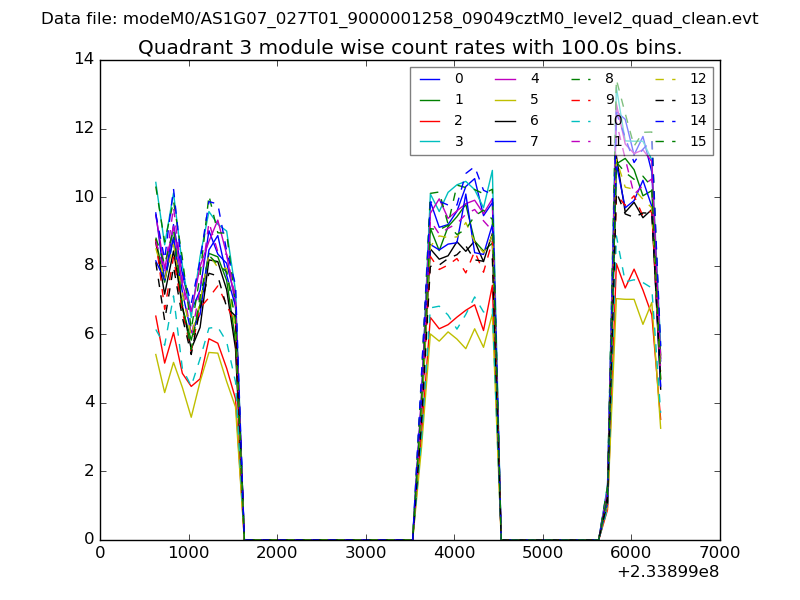
| Module-wise count rates for Quadrant C Data is divided into 100 sec bins |
 |
 |
| Module-wise count rates for Quadrant D Data is divided into 100 sec bins |
 |
 |
| Parameter | Plot |
|---|---|
| CZT HV Monitor | 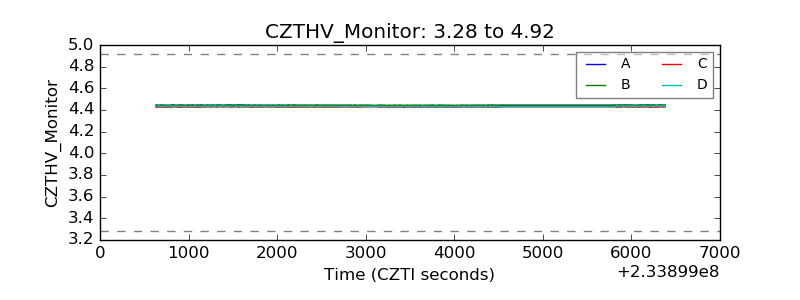 |
| D_VDD | 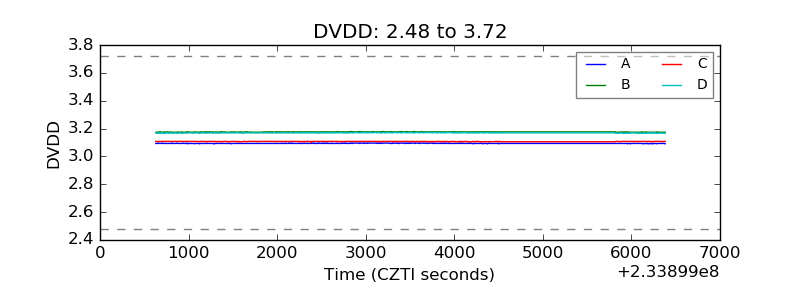 |
| Temperature 1 | 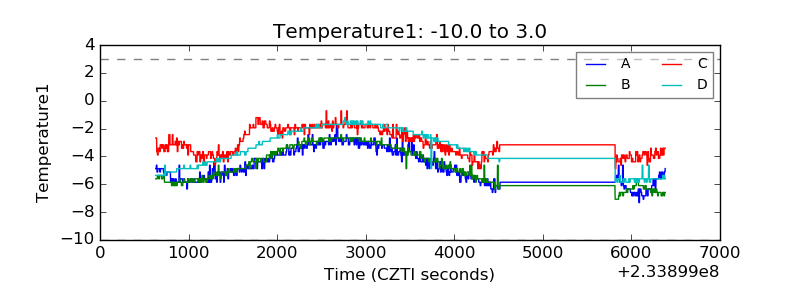 |
| Veto HV Monitor | 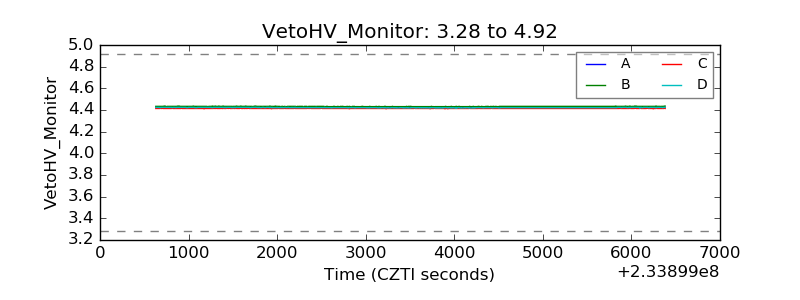 |
| Veto LLD | 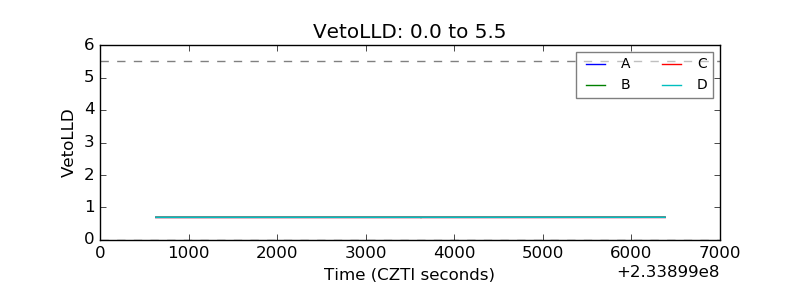 |
| Alpha Counter | 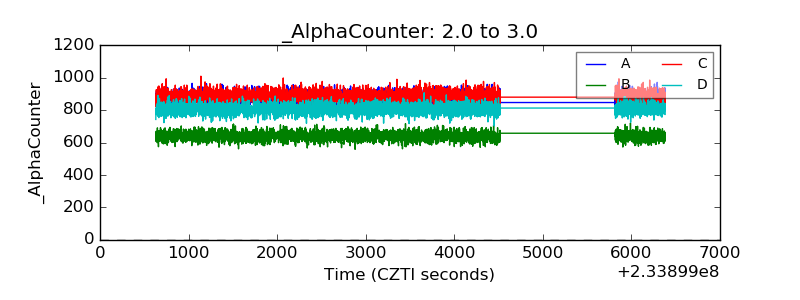 |
| _CPM_Rate | 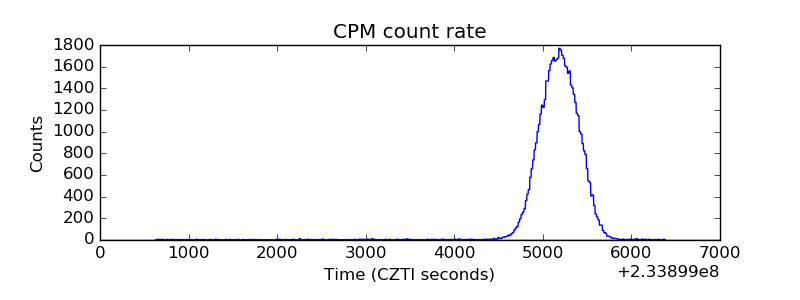 |
| CZT Counter | 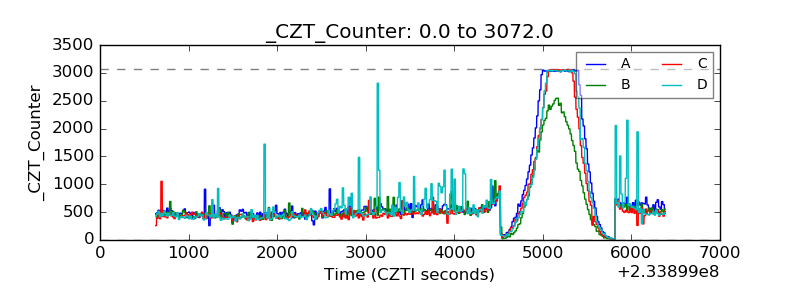 |
| +2.5 Volts monitor |  |
| +5 Volts monitor |  |
| _ROLL_ROT | 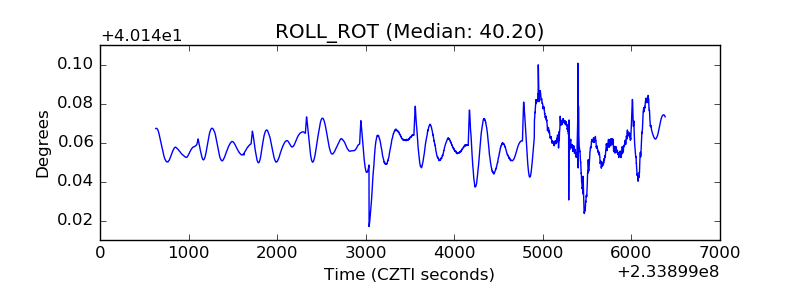 |
| _Roll_DEC | 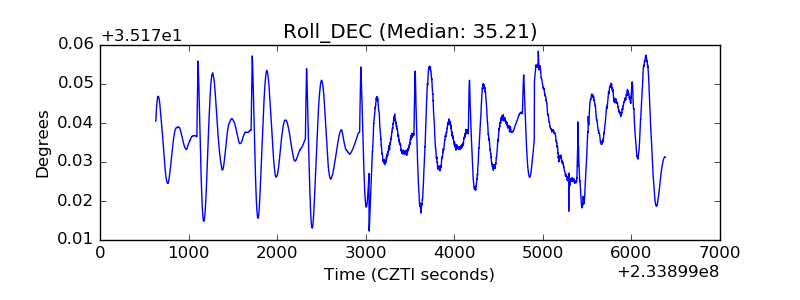 |
| _Roll_RA | 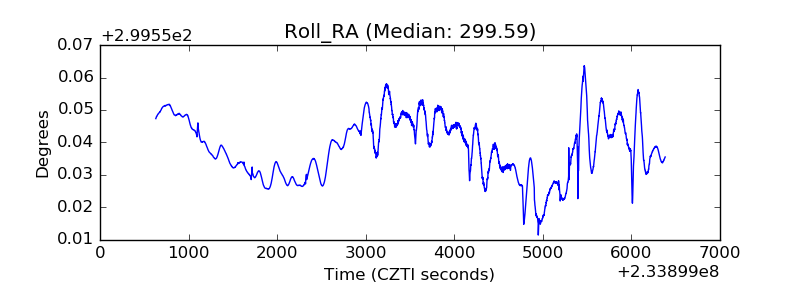 |
| Veto Counter | 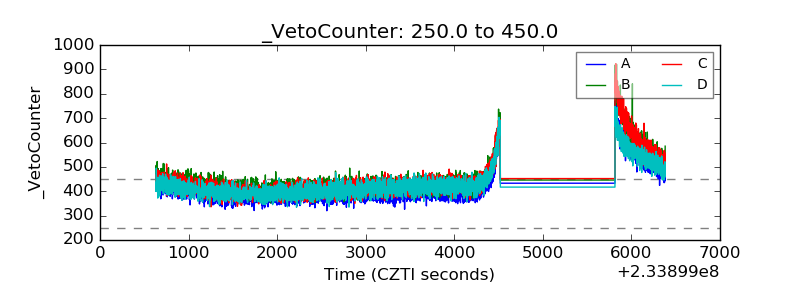 |