| Param | Original file | Final file |
|---|---|---|
| Filename | modeM0/AS1A03_046T01_9000001260cztM0_level2.fits | modeM0/AS1A03_046T01_9000001260cztM0_level2_quad_clean.evt |
| Size (bytes) | 801,607,680 | 844,833,600 |
| Size | 764.5 MB | 805.7 MB |
| Events in quadrant A | 5,183,290 | 5,561,201 |
| Events in quadrant B | 3,581,169 | 3,842,387 |
| Events in quadrant C | 5,178,073 | 5,334,672 |
| Events in quadrant D | 4,429,360 | 4,948,484 |
| Mode SS | |||
|---|---|---|---|
| Quadrant | BADHDUFLAG | Total packets | Discarded packets |
| A | 0 | 1872 | 0 |
| B | 0 | 1866 | 0 |
| C | 0 | 1862 | 0 |
| D | 0 | 1902 | 0 |
| Mode M9 | |||
|---|---|---|---|
| Quadrant | BADHDUFLAG | Total packets | Discarded packets |
| A | 0 | 151 | 0 |
| B | 0 | 148 | 0 |
| C | 0 | 149 | 0 |
| D | 0 | 146 | 0 |
| Mode M0 | |||
|---|---|---|---|
| Quadrant | BADHDUFLAG | Total packets | Discarded packets |
| A | 0 | 216780 | 0 |
| B | 0 | 140988 | 0 |
| C | 0 | 190224 | 0 |
| D | 0 | 220192 | 0 |
| Quadrant | Total seconds | Saturated seconds | Saturation percentage |
|---|---|---|---|
| A | 92171 | 2103 | 2.281629% |
| B | 66062 | 1102 | 1.668130% |
| C | 92391 | 1133 | 1.226310% |
| D | 91895 | 2839 | 3.089396% |
Noise dominated data is calculated using 1-second bins in cleaned event files. If a bin has >2000 counts, and if more than 50% of those come from <1% of pixels, then it is considered to be noise-dominated and hence unusable.
| Quadrant | # 1 sec bins | Bins with >0 counts | Bins with >2000 counts | High rate bins dominated by noise | Noise dominated (total time) | Noise dominated (detector-on time) | Marked lightcurve |
|---|---|---|---|---|---|---|---|
| A | 114245 | 94990 | 0 | 0 | 0.00% | 0.00% |  |
| B | 81938 | 67687 | 0 | 0 | 0.00% | 0.00% |  |
| C | 114245 | 95109 | 0 | 0 | 0.00% | 0.00% |  |
| D | 114245 | 94819 | 0 | 0 | 0.00% | 0.00% |  |
Top three noisy pixels from each quadrant. If the there are fewer than three noisy pixels in the level2.evt file, extra rows are filled as -1
| Pixel properties | Quadrant properties | ||||||
|---|---|---|---|---|---|---|---|
| Quadrant | DetID | PixID | Counts | Sigma | Mean | Median | Sigma |
| A | 0 | 29 | 5000 | 10.95 | 1351 | 1267 | 341.0 |
| A | 7 | 110 | 4294 | 8.88 | 1351 | 1267 | 341.0 |
| A | 0 | 30 | 3873 | 7.64 | 1351 | 1267 | 341.0 |
| B | 2 | 9 | 3127 | 11.96 | 945 | 901 | 186.1 |
| B | 14 | 254 | 2491 | 8.54 | 945 | 901 | 186.1 |
| B | 3 | 17 | 2359 | 7.83 | 945 | 901 | 186.1 |
| C | 1 | 80 | 3824 | 7.21 | 1366 | 1271 | 353.9 |
| C | 1 | 81 | 3800 | 7.15 | 1366 | 1271 | 353.9 |
| C | 12 | 241 | 3756 | 7.02 | 1366 | 1271 | 353.9 |
| D | 3 | 14 | 3282 | 6.39 | 1262 | 1151 | 333.4 |
| D | 6 | 231 | 3272 | 6.36 | 1262 | 1151 | 333.4 |
| D | 10 | 189 | 3189 | 6.11 | 1262 | 1151 | 333.4 |
Histogram calculated using DETX and DETY for each event in the final _common_clean file
| Quadrant A |  |
 |
Quadrant B |
|---|---|---|---|
| Quadrant D | 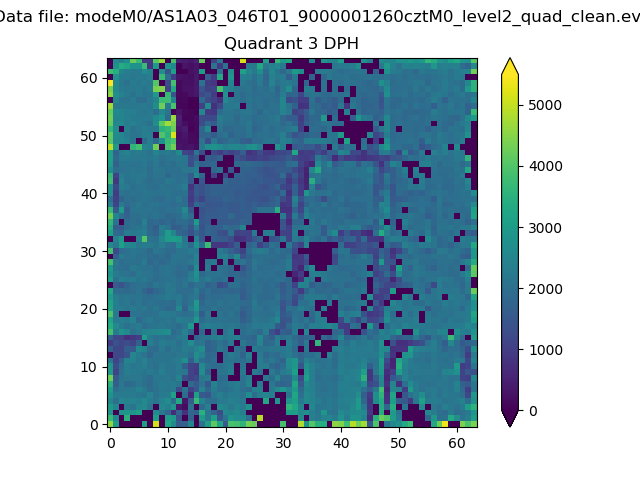 |
 |
Quadrant C |
| Plot type | Count rate plots | Images |
|---|---|---|
| Comparison with Poisson distribution Blue bars denote a histogram of data divided into 1 sec bins. Red curve is a Poisson curve with rate = median count rate of data. |
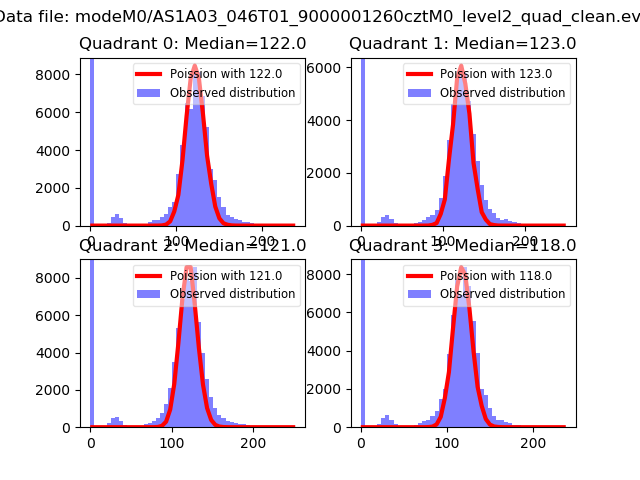 |
 |
| Quadrant-wise count rates Data is divided into 100 sec bins |
 |
|
| Module-wise count rates for Quadrant A Data is divided into 100 sec bins |
 |
 |
| Module-wise count rates for Quadrant B Data is divided into 100 sec bins |
 |
 |
| Module-wise count rates for Quadrant C Data is divided into 100 sec bins |
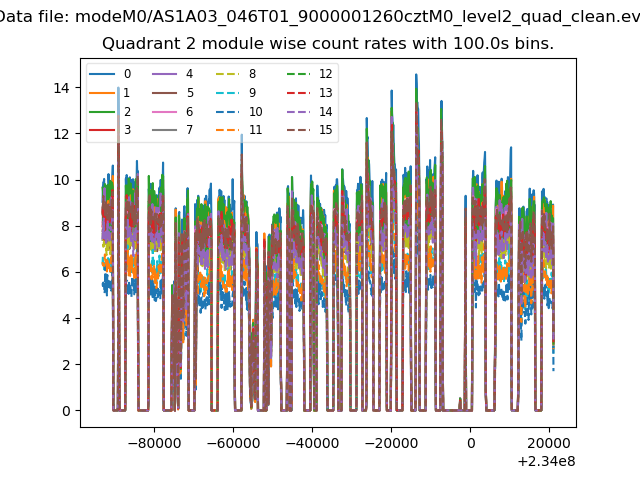 |
 |
| Module-wise count rates for Quadrant D Data is divided into 100 sec bins |
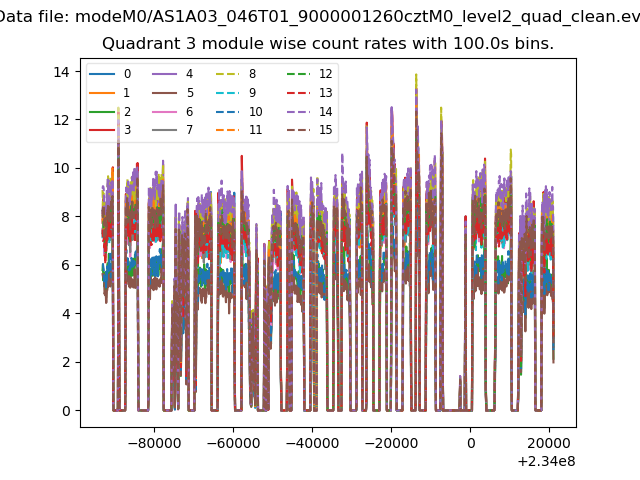 |
 |
| Parameter | Plot |
|---|---|
| CZT HV Monitor | 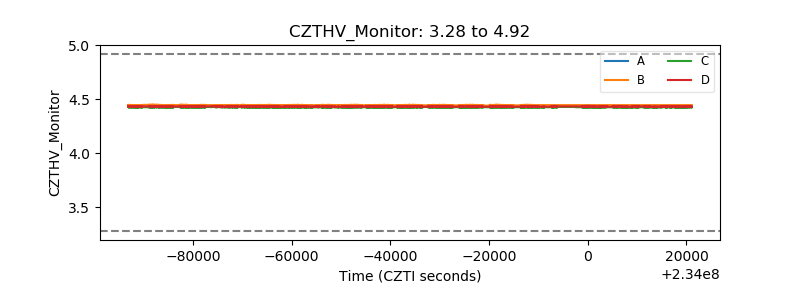 |
| D_VDD | 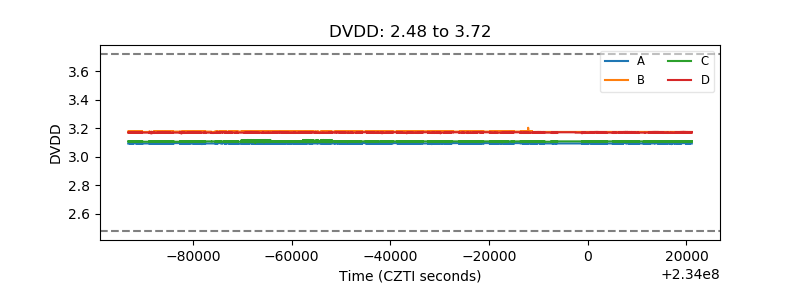 |
| Temperature 1 | 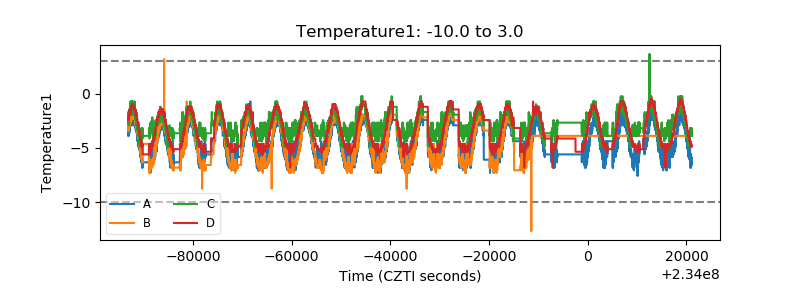 |
| Veto HV Monitor | 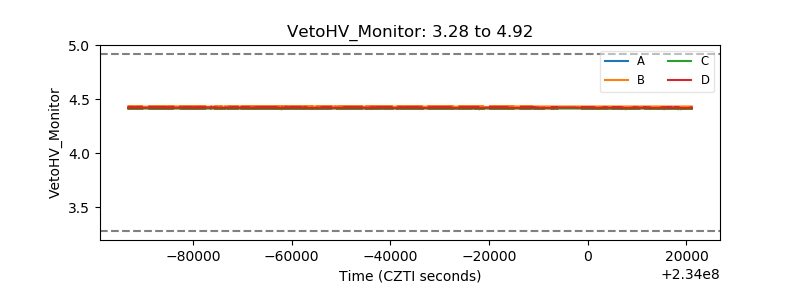 |
| Veto LLD | 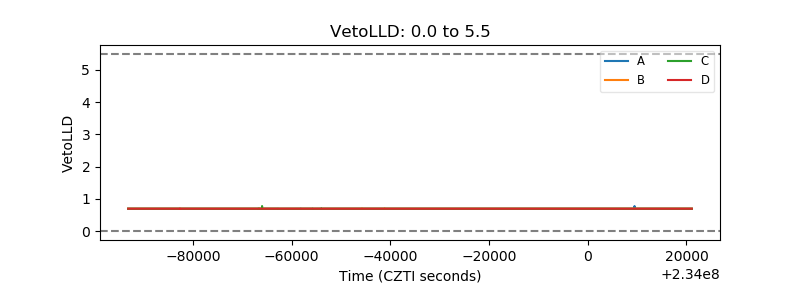 |
| Alpha Counter |  |
| _CPM_Rate |  |
| CZT Counter |  |
| +2.5 Volts monitor |  |
| +5 Volts monitor |  |
| _ROLL_ROT | 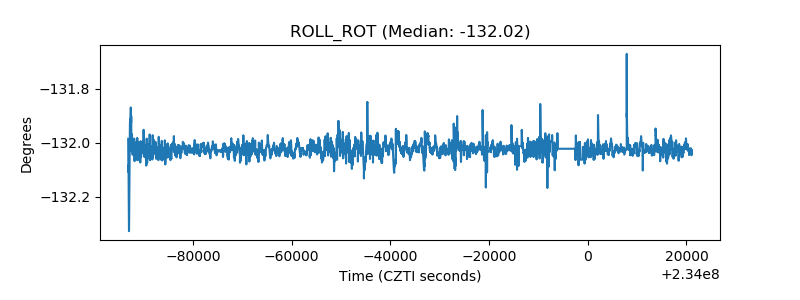 |
| _Roll_DEC |  |
| _Roll_RA |  |
| Veto Counter |  |