| Param | Original file | Final file |
|---|---|---|
| Filename | modeM0/AS1A03_046T01_9000001260_09046cztM0_level2.evt | modeM0/AS1A03_046T01_9000001260_09046cztM0_level2_quad_clean.evt |
| Size (bytes) | 358,485,120 | 59,771,520 |
| Size | 341.9 MB | 57.0 MB |
| Events in quadrant A | 2,923,651 | 381,925 |
| Events in quadrant B | 2,202,774 | 390,562 |
| Events in quadrant C | 1,945,617 | 382,890 |
| Events in quadrant D | 3,500,453 | 359,831 |
| Mode SS | |||
|---|---|---|---|
| Quadrant | BADHDUFLAG | Total packets | Discarded packets |
| A | 0 | 86 | 0 |
| B | 0 | 86 | 0 |
| C | 0 | 86 | 0 |
| D | 0 | 86 | 0 |
| Mode M9 | |||
|---|---|---|---|
| Quadrant | BADHDUFLAG | Total packets | Discarded packets |
| A | 0 | 13 | 0 |
| B | 0 | 13 | 0 |
| C | 0 | 13 | 0 |
| D | 0 | 13 | 0 |
| Mode M0 | |||
|---|---|---|---|
| Quadrant | BADHDUFLAG | Total packets | Discarded packets |
| A | 0 | 11606 | 16 |
| B | 0 | 9133 | 3 |
| C | 0 | 8595 | 11 |
| D | 0 | 13124 | 34 |
| Quadrant | Total seconds | Saturated seconds | Saturation percentage |
|---|---|---|---|
| A | 4176 | 126 | 3.017241% |
| B | 4180 | 80 | 1.913876% |
| C | 4176 | 63 | 1.508621% |
| D | 4174 | 204 | 4.887398% |
Noise dominated data is calculated using 1-second bins in cleaned event files. If a bin has >2000 counts, and if more than 50% of those come from <1% of pixels, then it is considered to be noise-dominated and hence unusable.
| Quadrant | # 1 sec bins | Bins with >0 counts | Bins with >2000 counts | High rate bins dominated by noise | Noise dominated (total time) | Noise dominated (detector-on time) | Marked lightcurve |
|---|---|---|---|---|---|---|---|
| A | 5476 | 4181 | 21 | 21 | 0.38% | 0.50% | 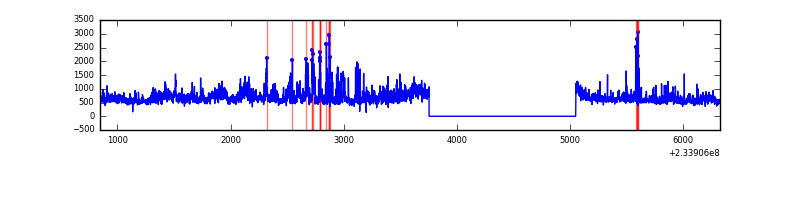 |
| B | 5476 | 4181 | 7 | 7 | 0.13% | 0.17% | 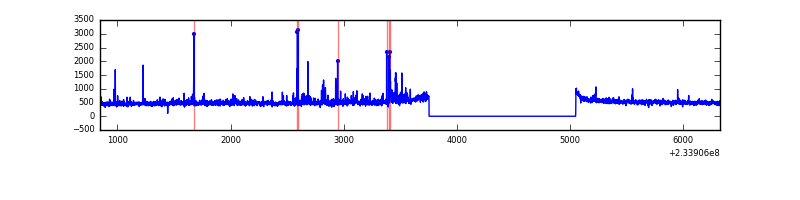 |
| C | 5476 | 4181 | 0 | 0 | 0.00% | 0.00% | 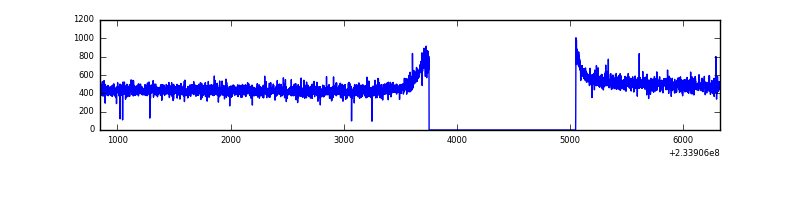 |
| D | 5476 | 4182 | 167 | 167 | 3.05% | 3.99% | 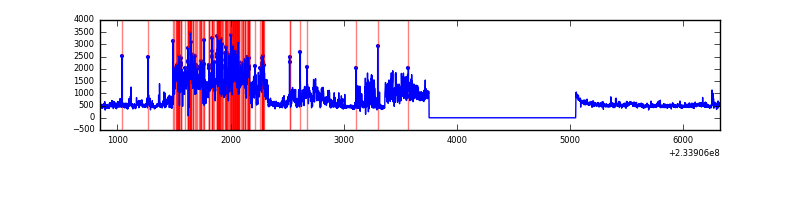 |
Top three noisy pixels from each quadrant. If the there are fewer than three noisy pixels in the level2.evt file, extra rows are filled as -1
| Pixel properties | Quadrant properties | ||||||
|---|---|---|---|---|---|---|---|
| Quadrant | DetID | PixID | Counts | Sigma | Mean | Median | Sigma |
| A | 8 | 5 | 407946 | 3886.45 | 516 | 505 | 104.8 |
| A | 1 | 162 | 154621 | 1470.06 | 516 | 505 | 104.8 |
| A | 5 | 16 | 110745 | 1051.55 | 516 | 505 | 104.8 |
| B | 4 | 48 | 48174 | 487.15 | 519 | 507 | 97.8 |
| B | 6 | 51 | 42612 | 430.31 | 519 | 507 | 97.8 |
| B | 10 | 16 | 23636 | 236.38 | 519 | 507 | 97.8 |
| C | 13 | 61 | 3885 | 29.6 | 498 | 500 | 114.4 |
| C | 12 | 4 | 1949 | 12.67 | 498 | 500 | 114.4 |
| C | 3 | 202 | 1240 | 6.47 | 498 | 500 | 114.4 |
| D | 1 | 52 | 1027664 | 8453.9 | 492 | 480 | 121.5 |
| D | 6 | 225 | 384397 | 3159.7 | 492 | 480 | 121.5 |
| D | 12 | 233 | 130829 | 1072.79 | 492 | 480 | 121.5 |
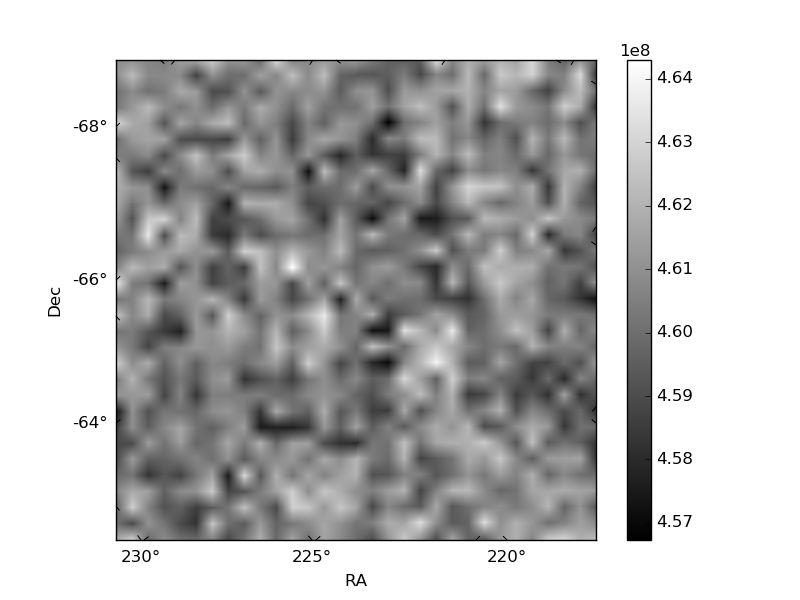
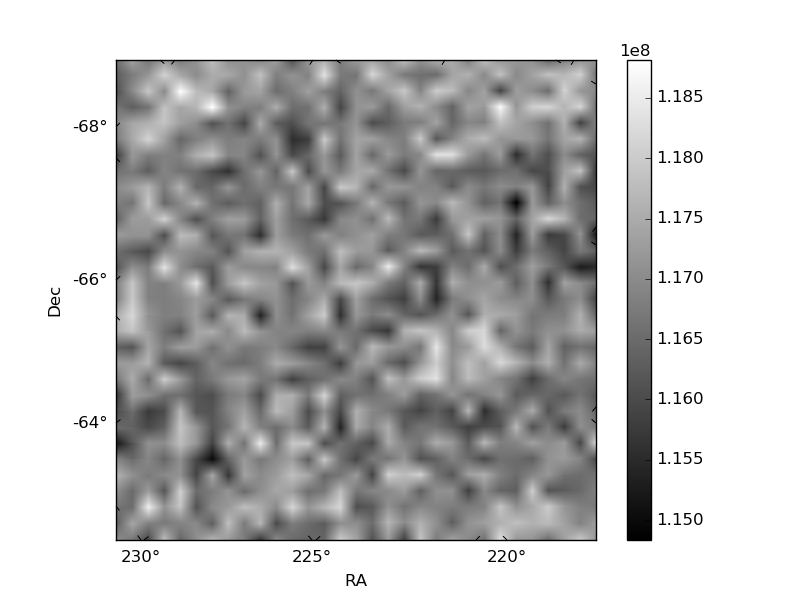
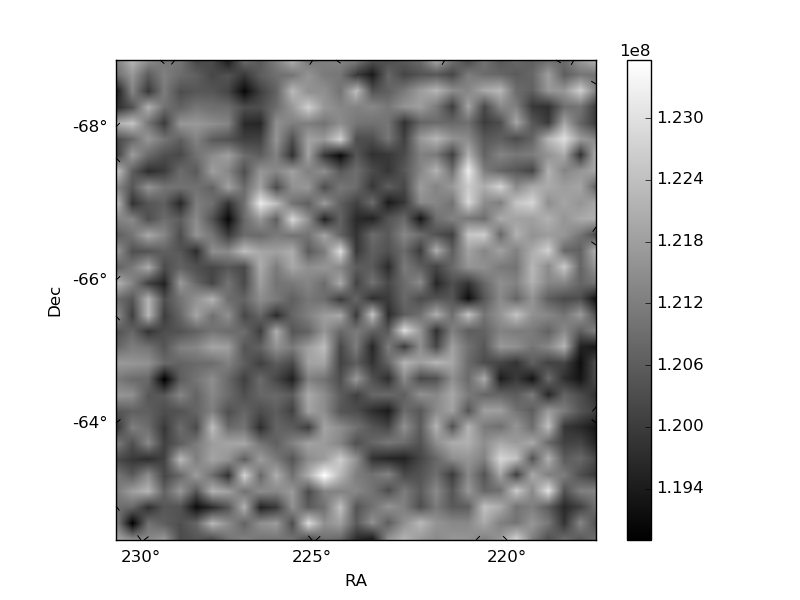
Histogram calculated using DETX and DETY for each event in the final _common_clean file
| Quadrant A | 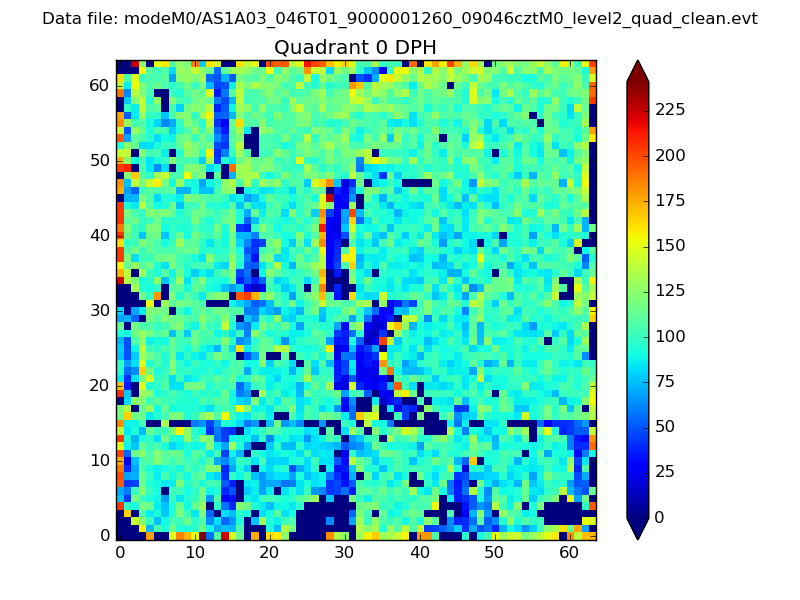 |
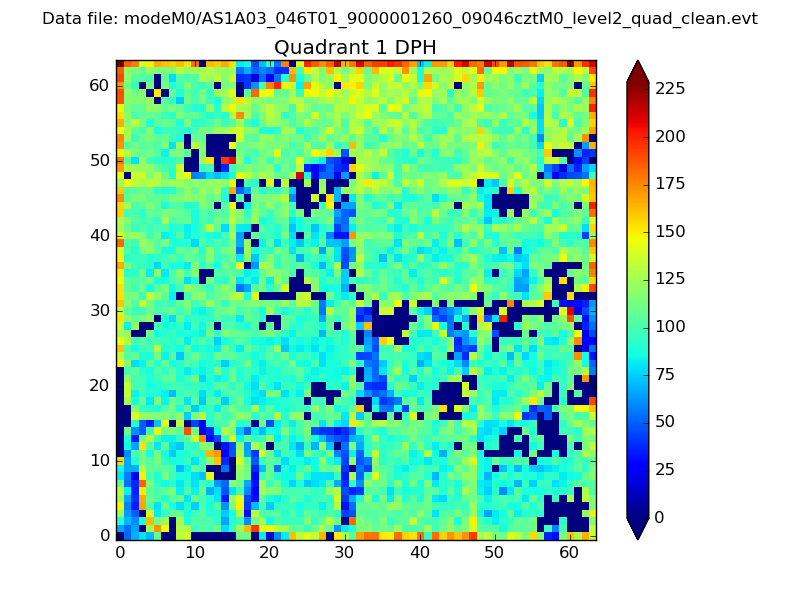 |
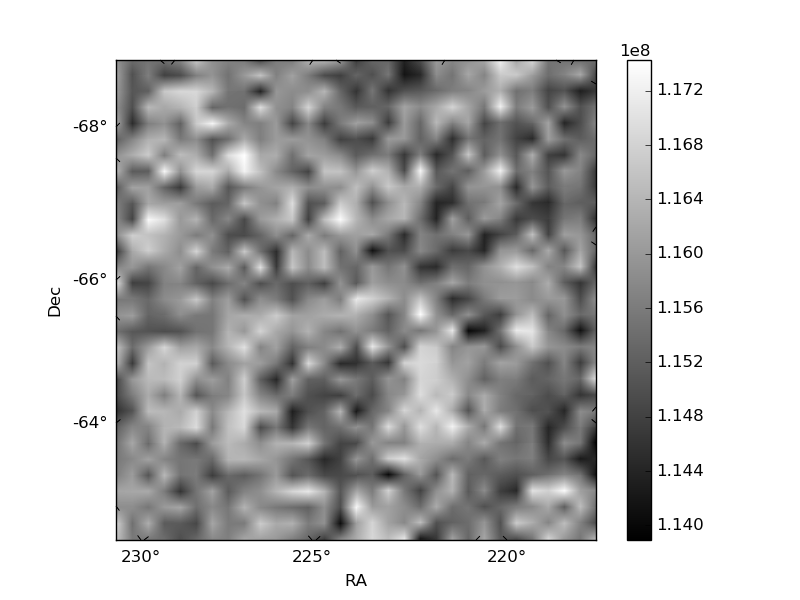
Quadrant B |
|---|---|---|---|
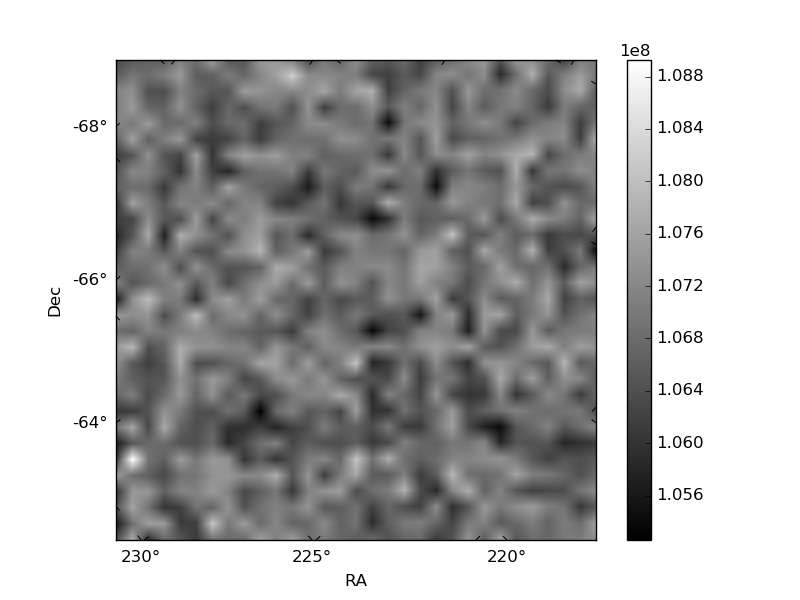
| Quadrant D | 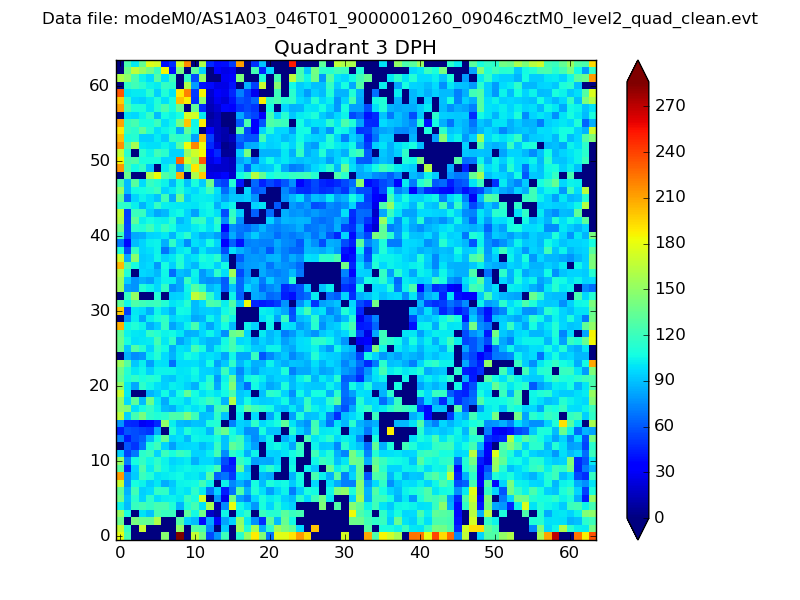 |
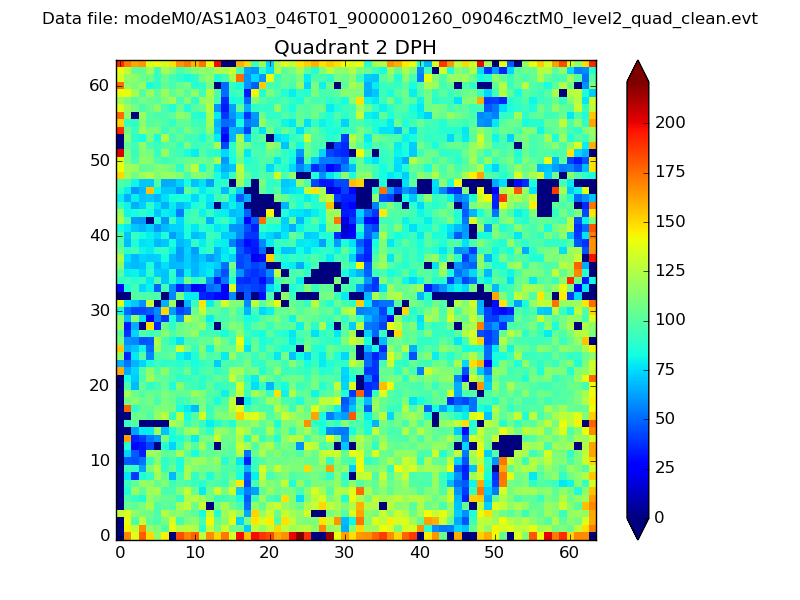 |
Quadrant C |
| Plot type | Count rate plots | Images |
|---|---|---|
| Comparison with Poisson distribution Blue bars denote a histogram of data divided into 1 sec bins. Red curve is a Poisson curve with rate = median count rate of data. |
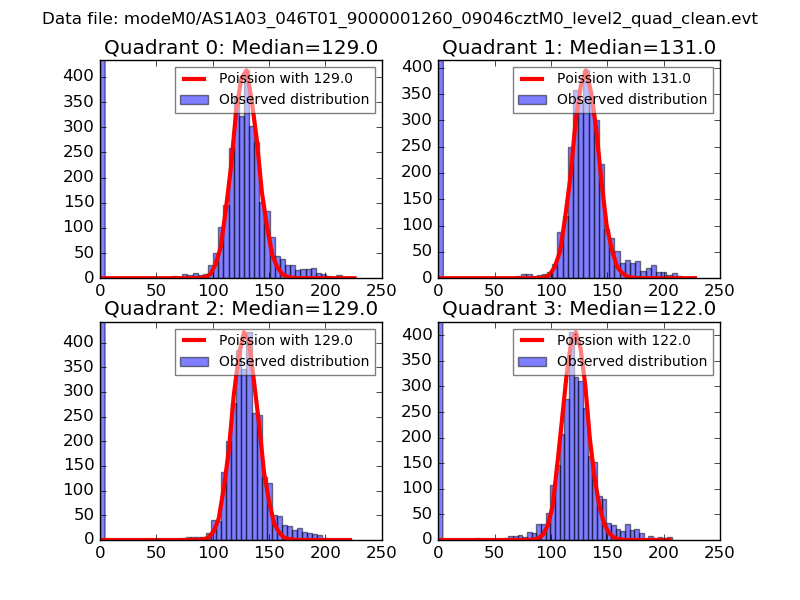 |
 |
| Quadrant-wise count rates Data is divided into 100 sec bins |
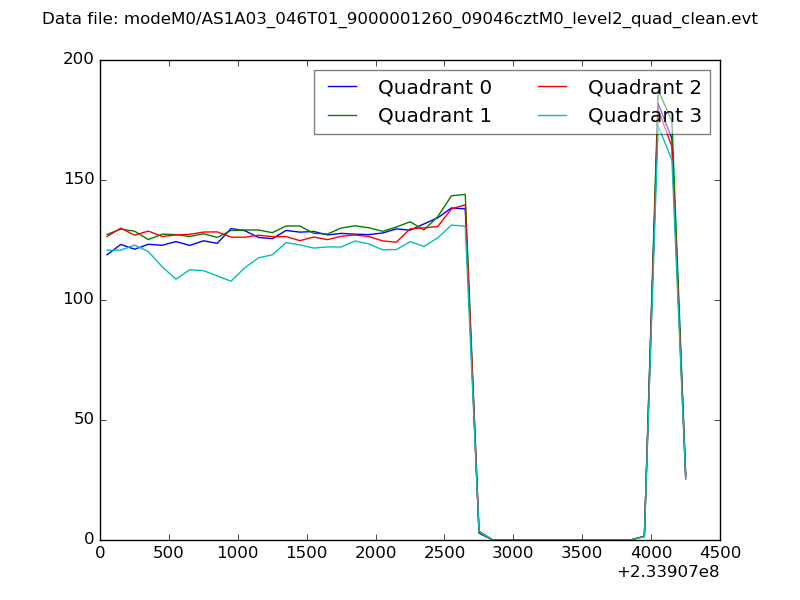 |
|
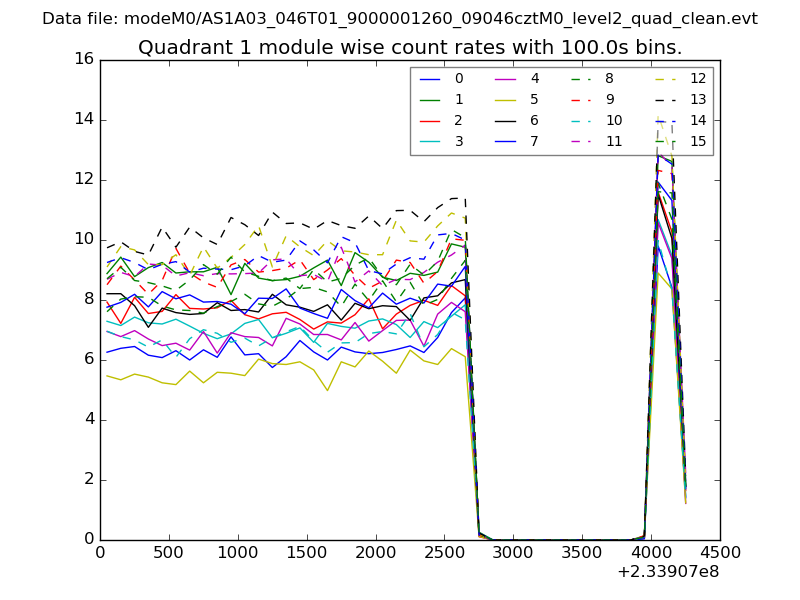
| Module-wise count rates for Quadrant A Data is divided into 100 sec bins |
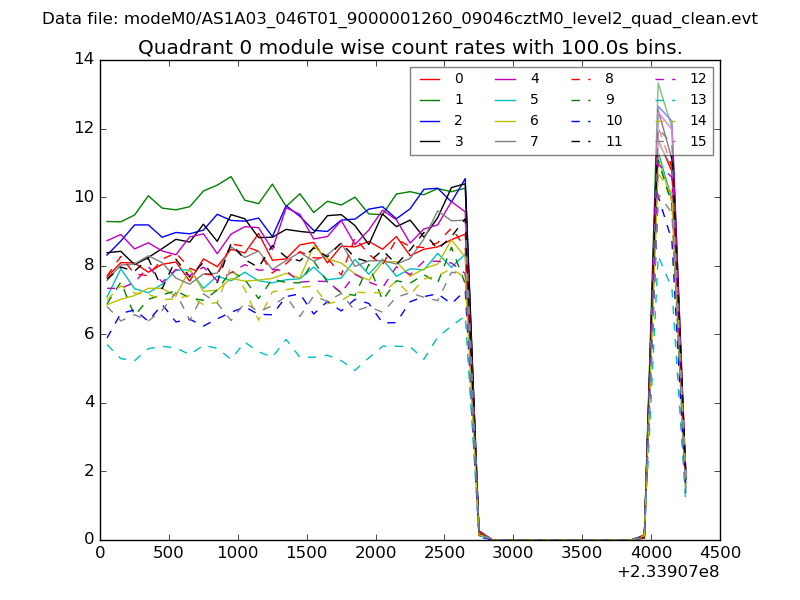 |
 |
| Module-wise count rates for Quadrant B Data is divided into 100 sec bins |
 |
 |
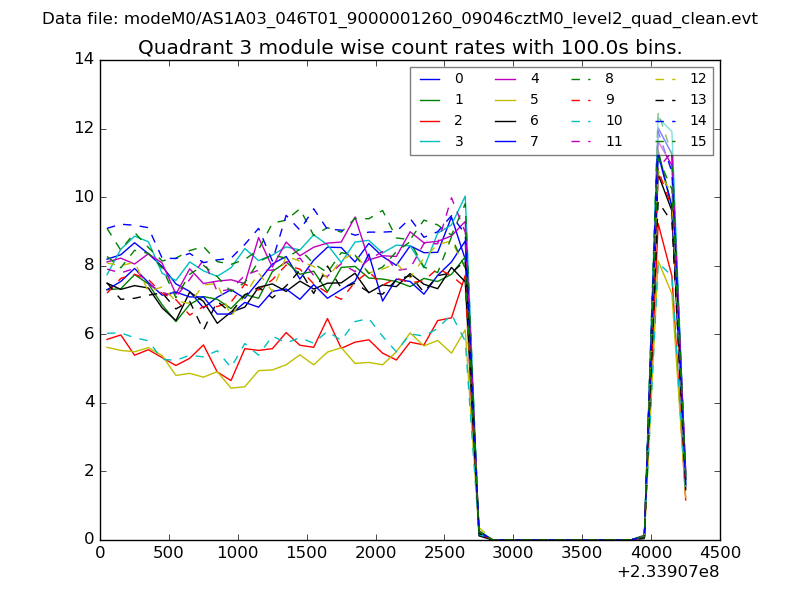
| Module-wise count rates for Quadrant C Data is divided into 100 sec bins |
 |
 |
| Module-wise count rates for Quadrant D Data is divided into 100 sec bins |
 |
 |
| Parameter | Plot |
|---|---|
| CZT HV Monitor | 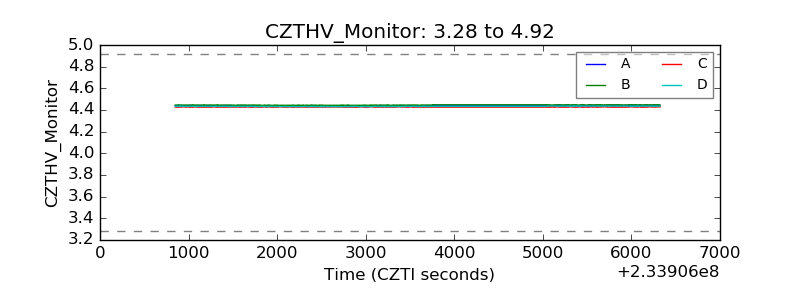 |
| D_VDD | 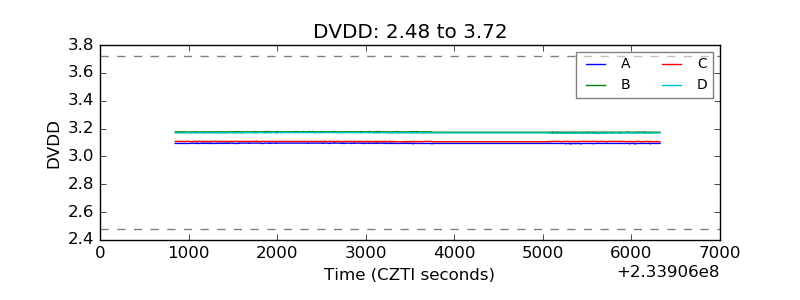 |
| Temperature 1 | 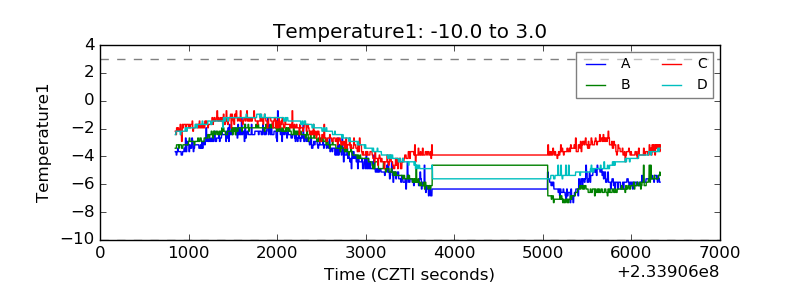 |
| Veto HV Monitor | 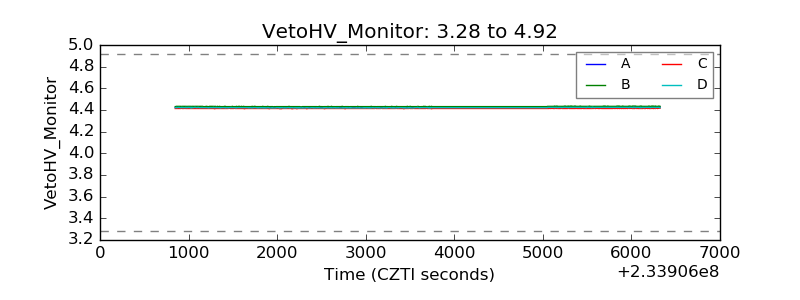 |
| Veto LLD | 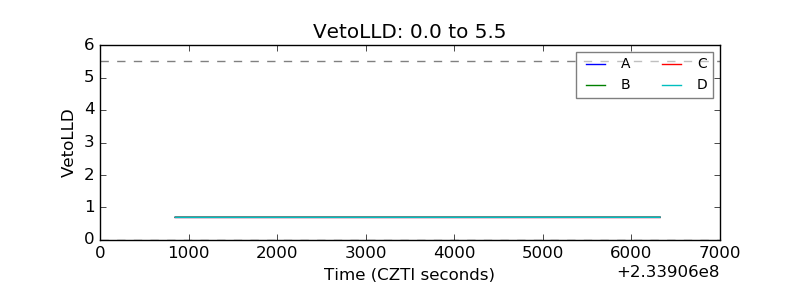 |
| Alpha Counter | 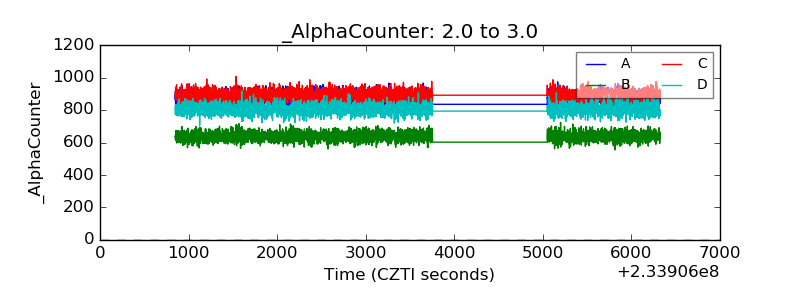 |
| _CPM_Rate |  |
| CZT Counter | 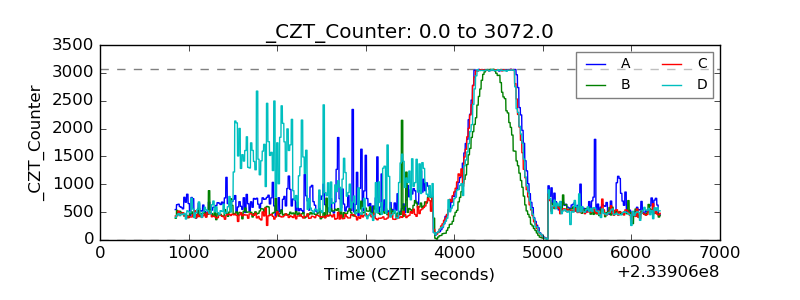 |
| +2.5 Volts monitor |  |
| +5 Volts monitor |  |
| _ROLL_ROT | 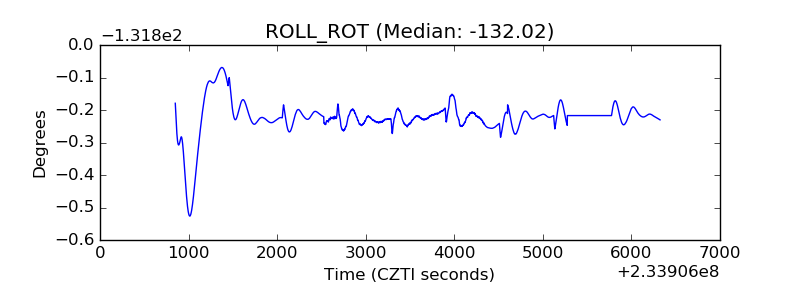 |
| _Roll_DEC | 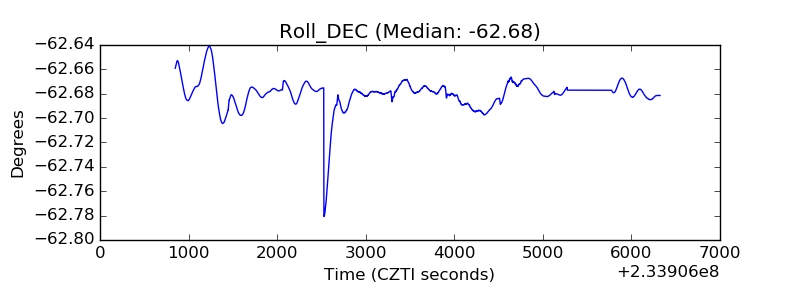 |
| _Roll_RA | 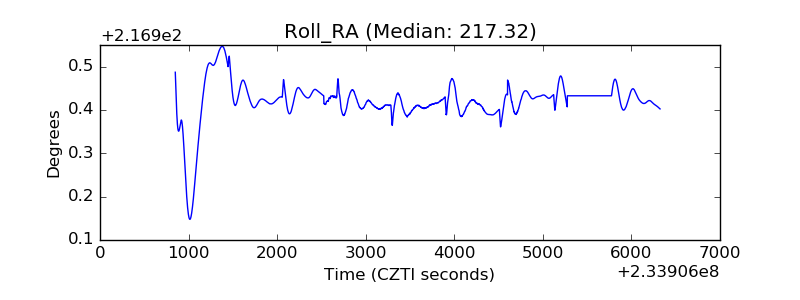 |
| Veto Counter | 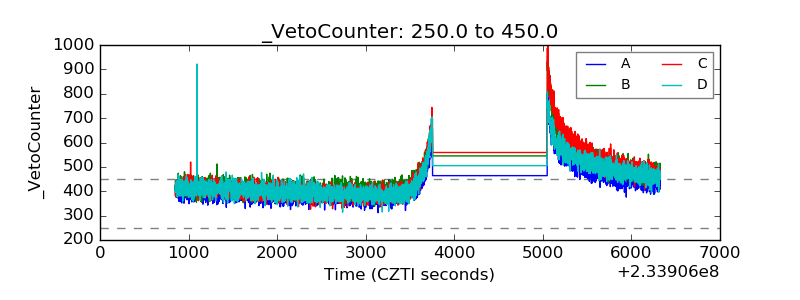 |