| Param | Original file | Final file |
|---|---|---|
| Filename | modeM0/AS1A03_046T01_9000001260_09048cztM0_level2.evt | modeM0/AS1A03_046T01_9000001260_09048cztM0_level2_quad_clean.evt |
| Size (bytes) | 376,983,360 | 66,960,000 |
| Size | 359.5 MB | 63.9 MB |
| Events in quadrant A | 3,038,333 | 414,710 |
| Events in quadrant B | 2,897,281 | 410,776 |
| Events in quadrant C | 2,474,164 | 420,619 |
| Events in quadrant D | 2,639,435 | 404,214 |
| Mode SS | |||
|---|---|---|---|
| Quadrant | BADHDUFLAG | Total packets | Discarded packets |
| A | 0 | 133 | 20 |
| B | 0 | 134 | 26 |
| C | 0 | 134 | 24 |
| D | 0 | 133 | 7 |
| Mode M9 | |||
|---|---|---|---|
| Quadrant | BADHDUFLAG | Total packets | Discarded packets |
| A | 0 | 20 | 6 |
| B | 0 | 20 | 6 |
| C | 0 | 20 | 7 |
| D | 0 | 21 | 8 |
| Mode M0 | |||
|---|---|---|---|
| Quadrant | BADHDUFLAG | Total packets | Discarded packets |
| A | 0 | 15731 | 3209 |
| B | 0 | 15278 | 3227 |
| C | 0 | 13588 | 2488 |
| D | 0 | 14511 | 3046 |
| Quadrant | Total seconds | Saturated seconds | Saturation percentage |
|---|---|---|---|
| A | 5321 | 126 | 2.367976% |
| B | 5361 | 226 | 4.215631% |
| C | 5418 | 91 | 1.679587% |
| D | 5333 | 101 | 1.893868% |
Noise dominated data is calculated using 1-second bins in cleaned event files. If a bin has >2000 counts, and if more than 50% of those come from <1% of pixels, then it is considered to be noise-dominated and hence unusable.
| Quadrant | # 1 sec bins | Bins with >0 counts | Bins with >2000 counts | High rate bins dominated by noise | Noise dominated (total time) | Noise dominated (detector-on time) | Marked lightcurve |
|---|---|---|---|---|---|---|---|
| A | 7589 | 6027 | 3 | 3 | 0.04% | 0.05% | 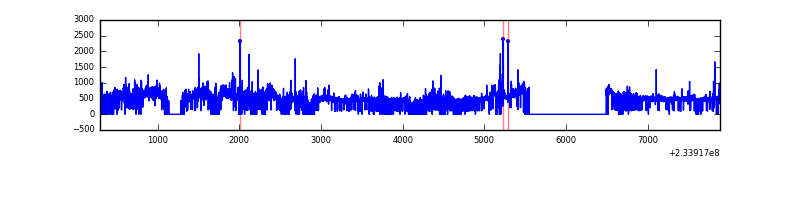 |
| B | 7589 | 6055 | 93 | 93 | 1.23% | 1.54% | 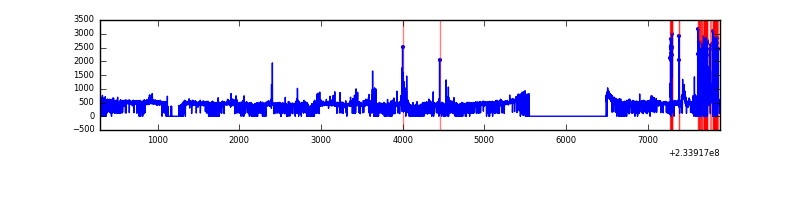 |
| C | 7589 | 6077 | 0 | 0 | 0.00% | 0.00% | 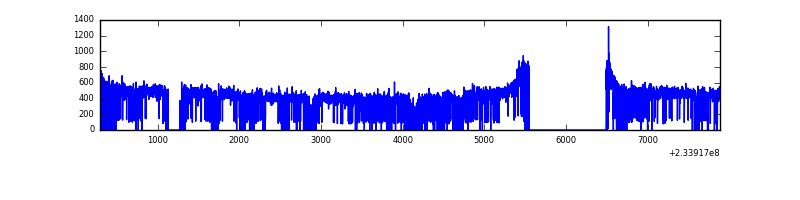 |
| D | 7589 | 6046 | 10 | 10 | 0.13% | 0.17% | 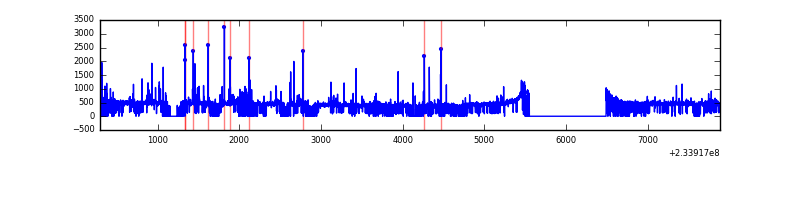 |
Top three noisy pixels from each quadrant. If the there are fewer than three noisy pixels in the level2.evt file, extra rows are filled as -1
| Pixel properties | Quadrant properties | ||||||
|---|---|---|---|---|---|---|---|
| Quadrant | DetID | PixID | Counts | Sigma | Mean | Median | Sigma |
| A | 8 | 5 | 236532 | 1831.99 | 638 | 625 | 128.8 |
| A | 1 | 162 | 126660 | 978.75 | 638 | 625 | 128.8 |
| A | 5 | 16 | 63142 | 485.49 | 638 | 625 | 128.8 |
| B | 10 | 16 | 350825 | 2913.95 | 639 | 625 | 120.2 |
| B | 6 | 51 | 25533 | 207.25 | 639 | 625 | 120.2 |
| B | 12 | 111 | 12900 | 102.14 | 639 | 625 | 120.2 |
| C | 13 | 61 | 4876 | 29.22 | 634 | 635 | 145.2 |
| C | 12 | 4 | 1867 | 8.49 | 634 | 635 | 145.2 |
| C | 3 | 202 | 1538 | 6.22 | 634 | 635 | 145.2 |
| D | 1 | 52 | 135672 | 892.72 | 624 | 607 | 151.3 |
| D | 12 | 233 | 52429 | 342.52 | 624 | 607 | 151.3 |
| D | 2 | 14 | 31570 | 204.65 | 624 | 607 | 151.3 |
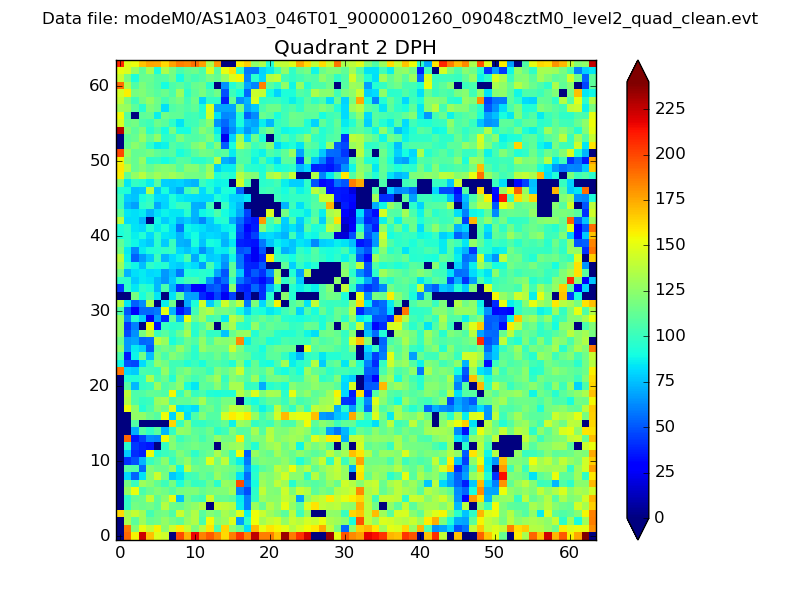
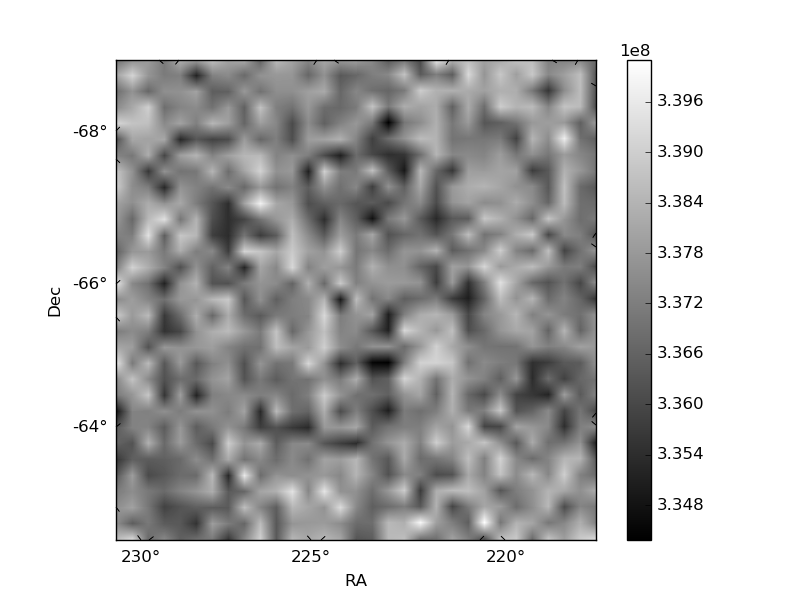
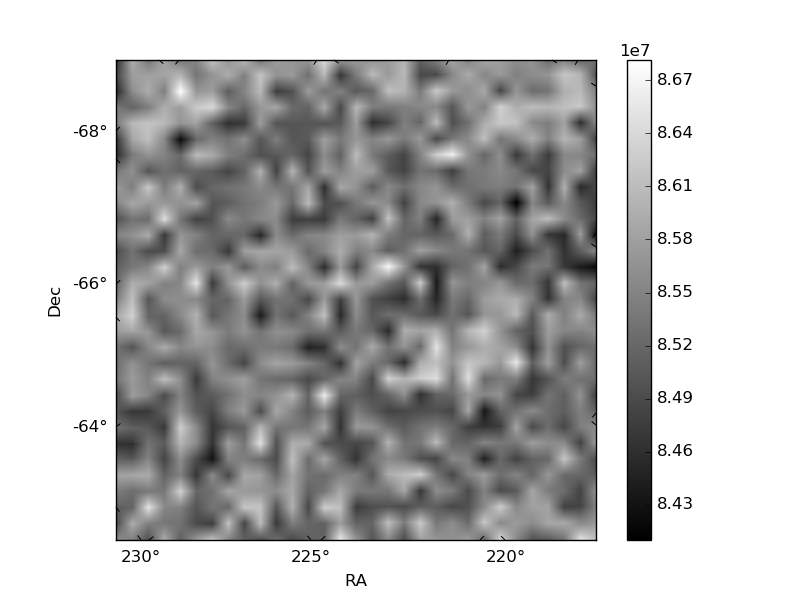
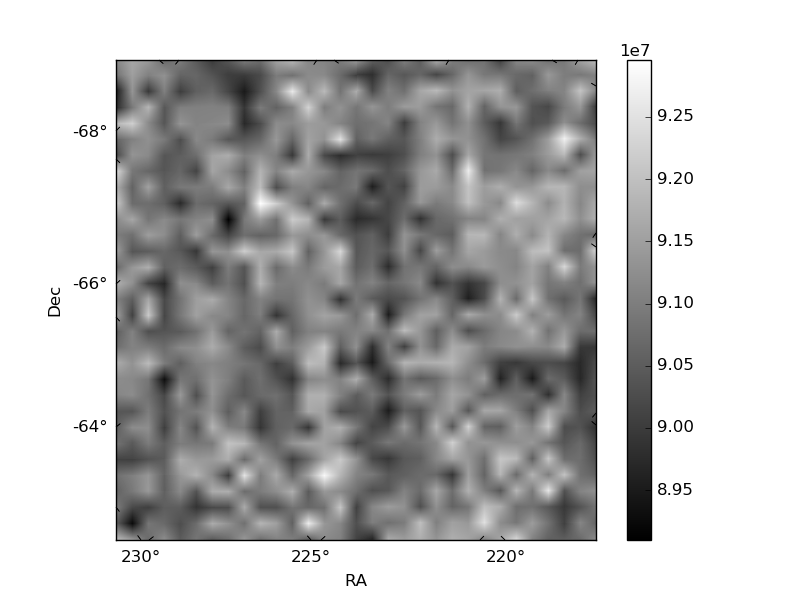
Histogram calculated using DETX and DETY for each event in the final _common_clean file
| Quadrant A | 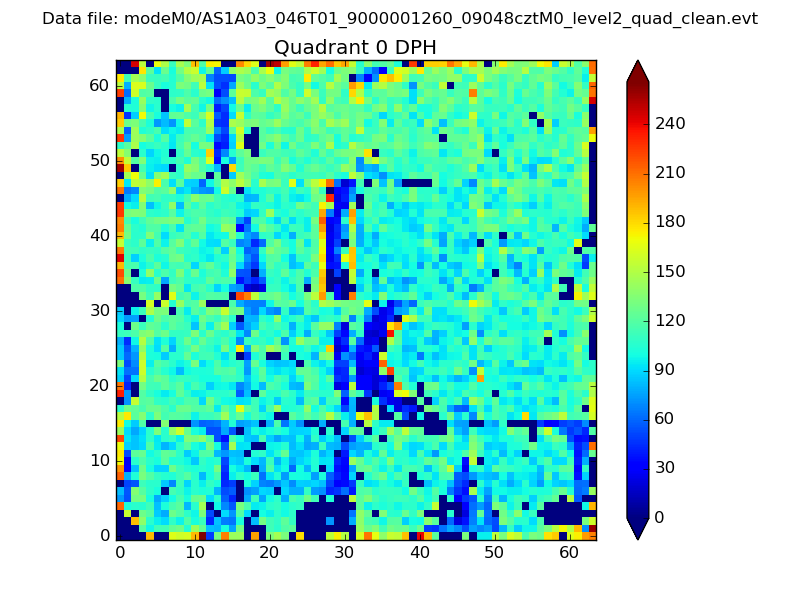 |
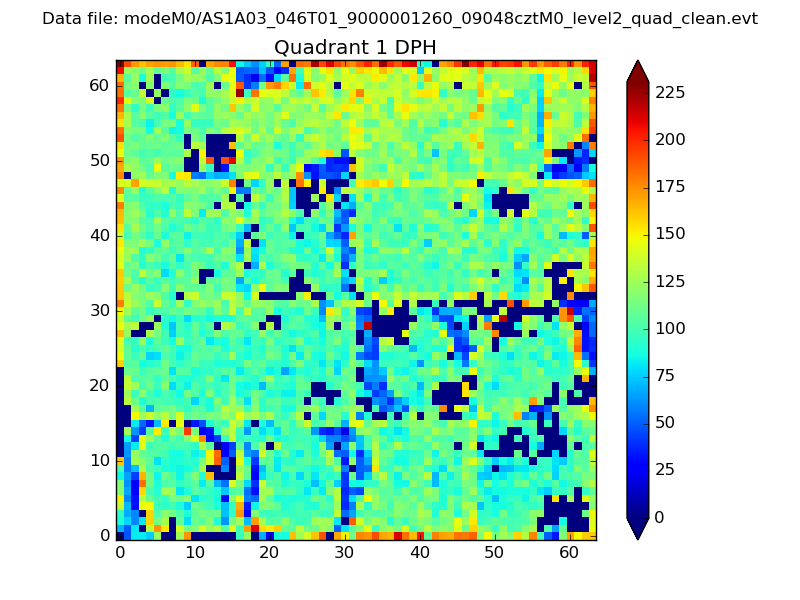 |
Quadrant B |
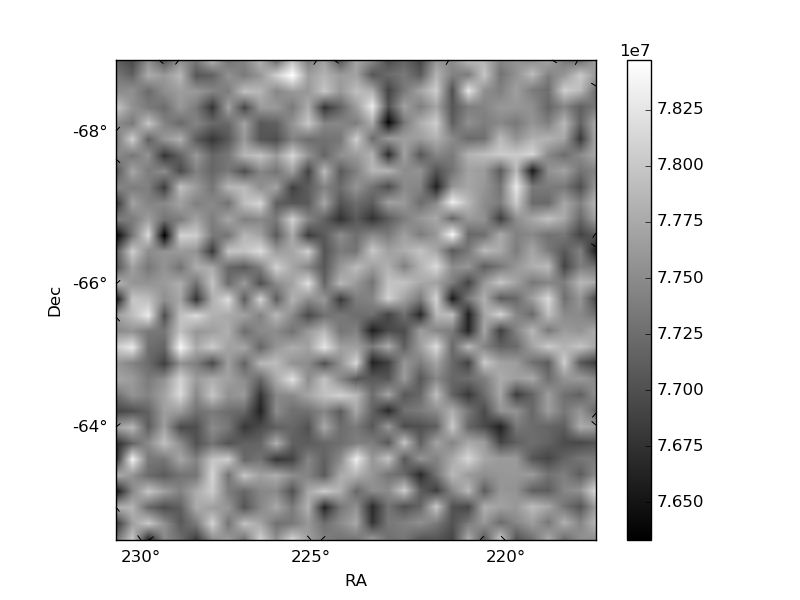
|---|---|---|---|
| Quadrant D | 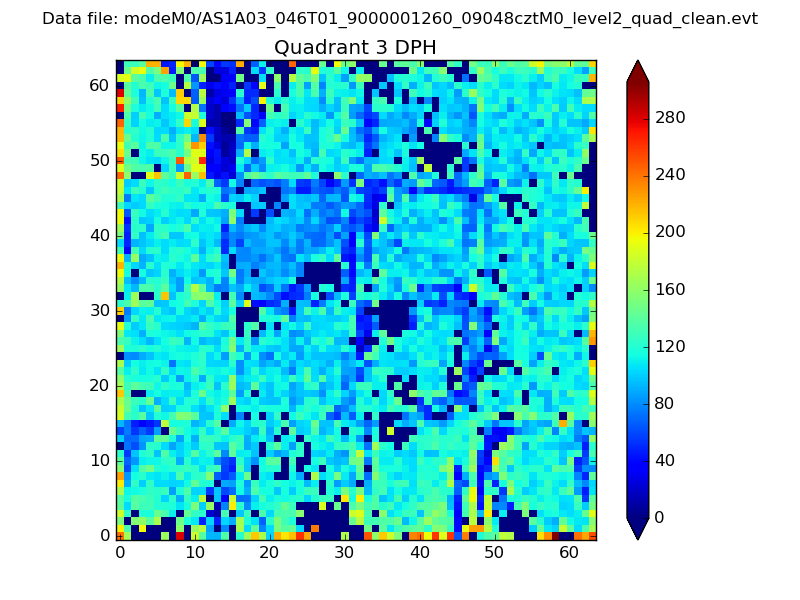 |
 |
Quadrant C |
| Plot type | Count rate plots | Images |
|---|---|---|
| Comparison with Poisson distribution Blue bars denote a histogram of data divided into 1 sec bins. Red curve is a Poisson curve with rate = median count rate of data. |
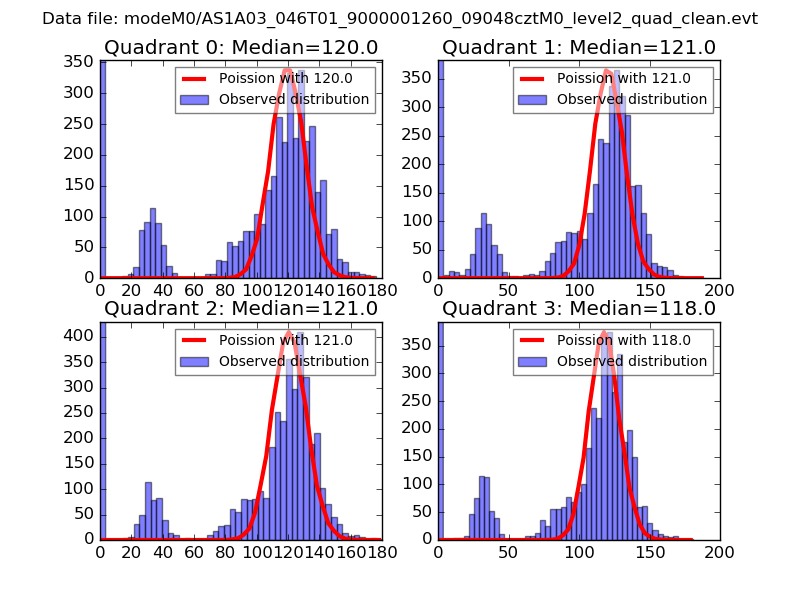 |
 |
| Quadrant-wise count rates Data is divided into 100 sec bins |
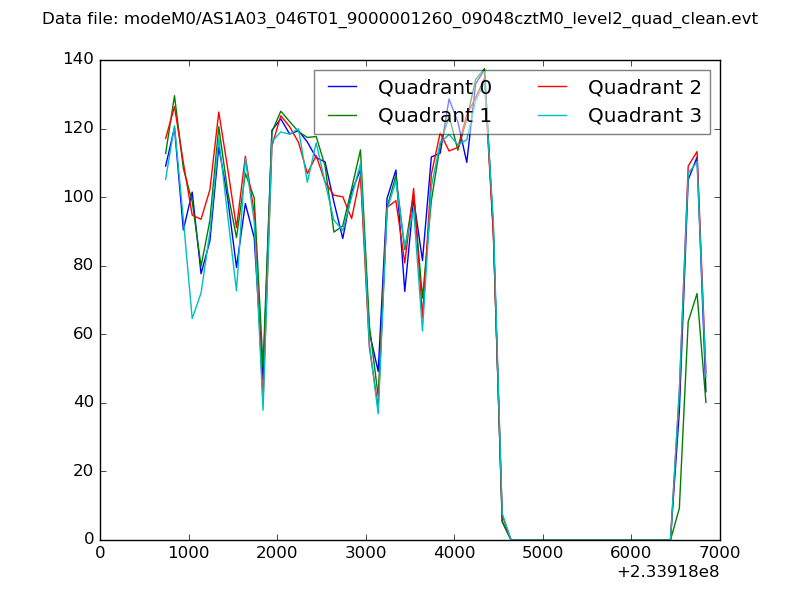 |
|
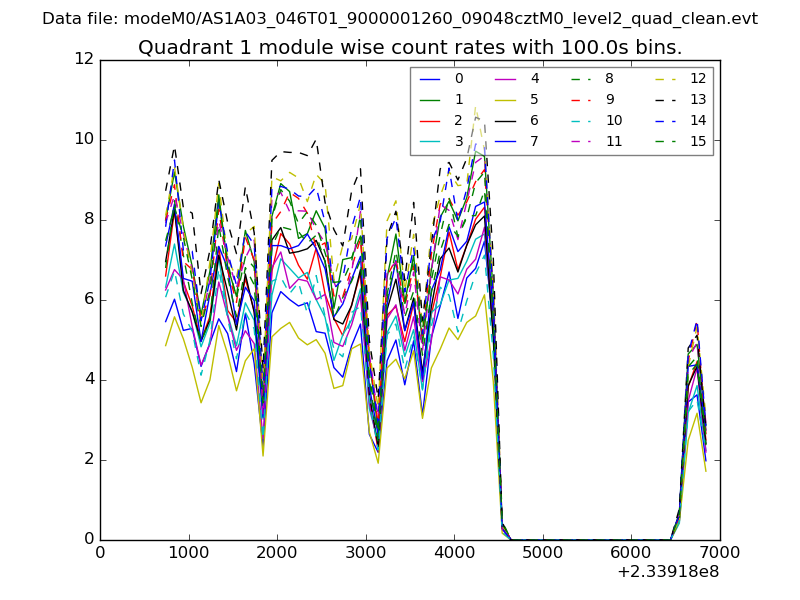
| Module-wise count rates for Quadrant A Data is divided into 100 sec bins |
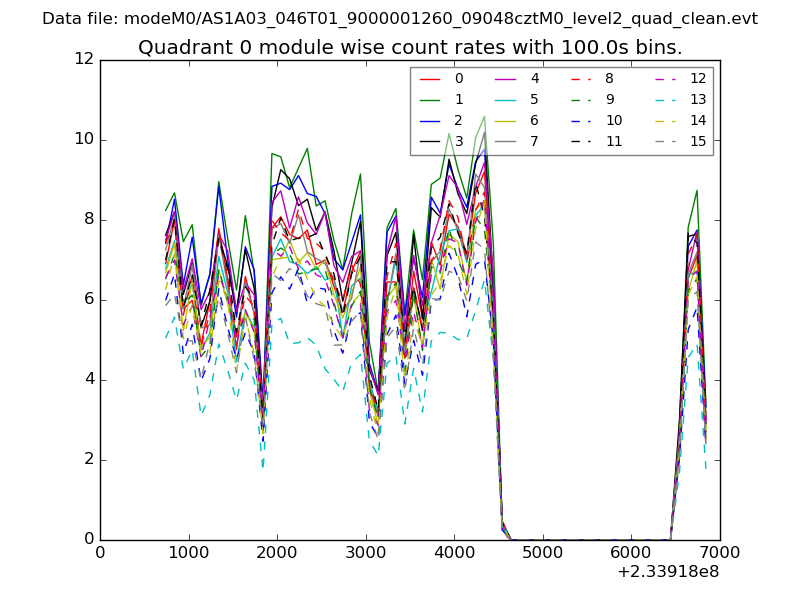 |
 |
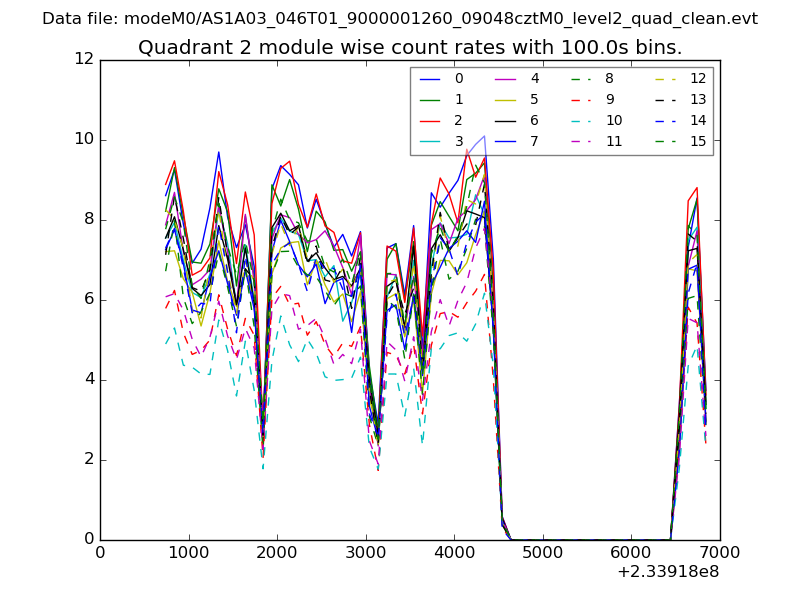
| Module-wise count rates for Quadrant B Data is divided into 100 sec bins |
 |
 |
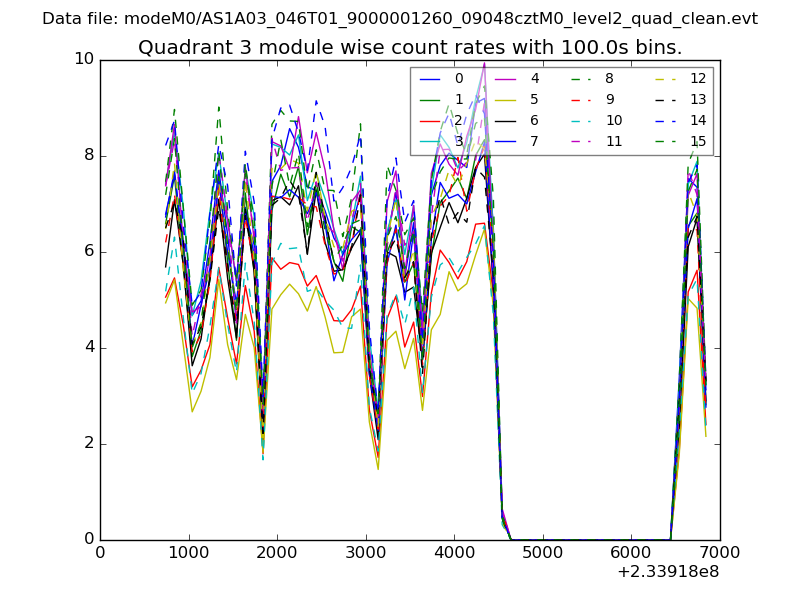
| Module-wise count rates for Quadrant C Data is divided into 100 sec bins |
 |
 |
| Module-wise count rates for Quadrant D Data is divided into 100 sec bins |
 |
 |
| Parameter | Plot |
|---|---|
| CZT HV Monitor | 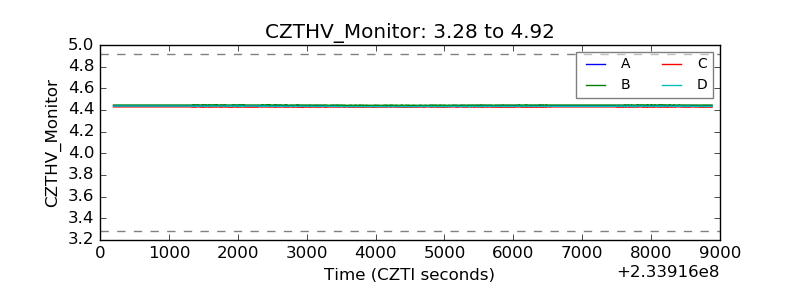 |
| D_VDD |  |
| Temperature 1 | 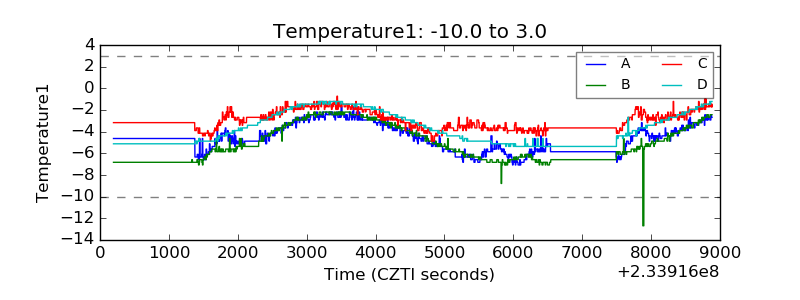 |
| Veto HV Monitor | 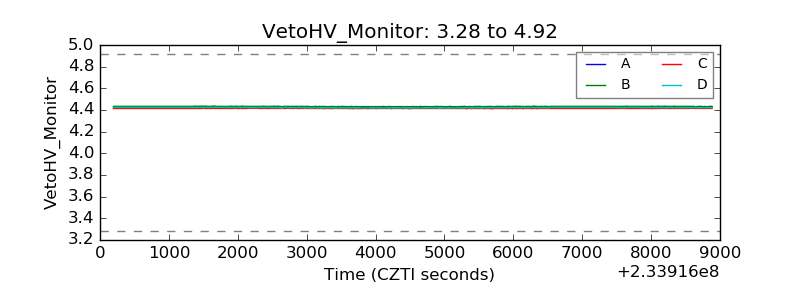 |
| Veto LLD | 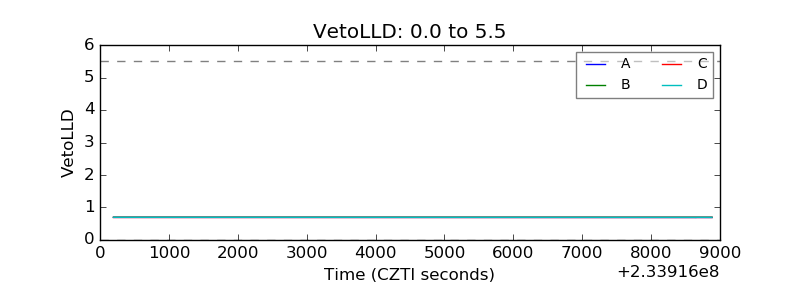 |
| Alpha Counter | 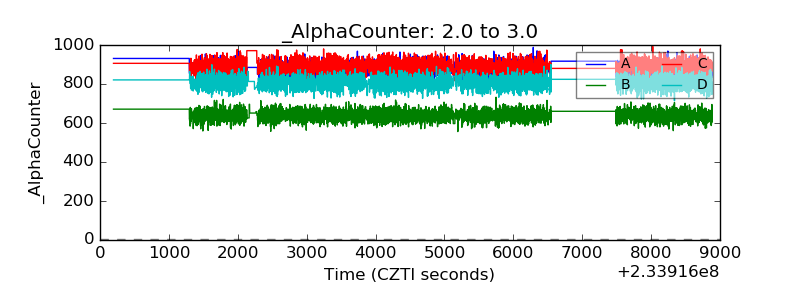 |
| _CPM_Rate | 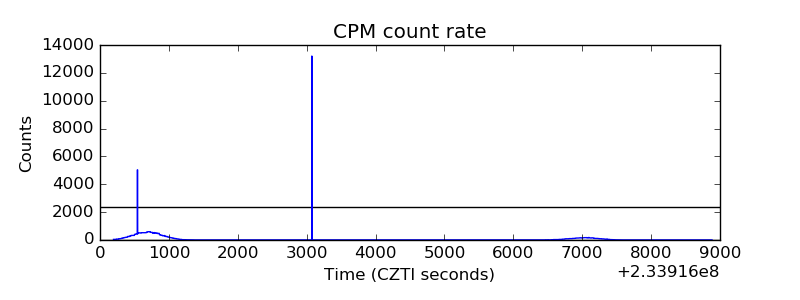 |
| CZT Counter | 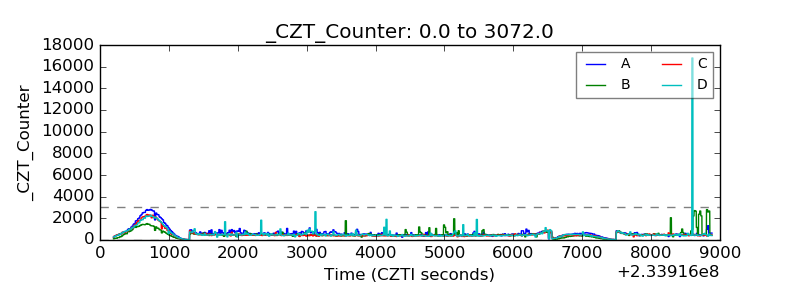 |
| +2.5 Volts monitor | 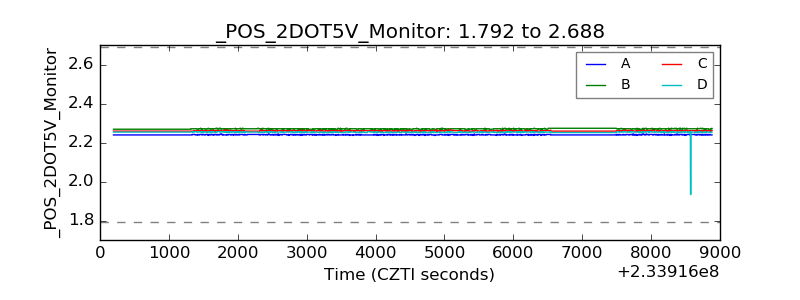 |
| +5 Volts monitor |  |
| _ROLL_ROT | 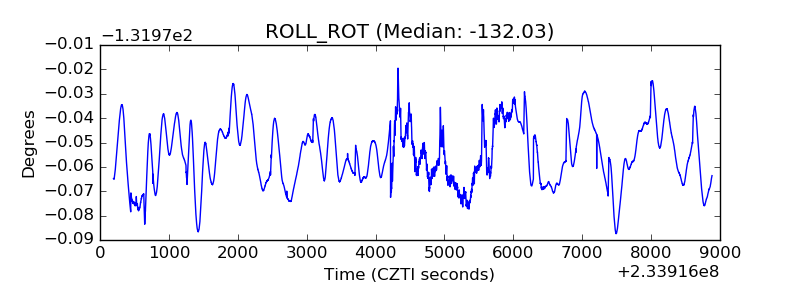 |
| _Roll_DEC | 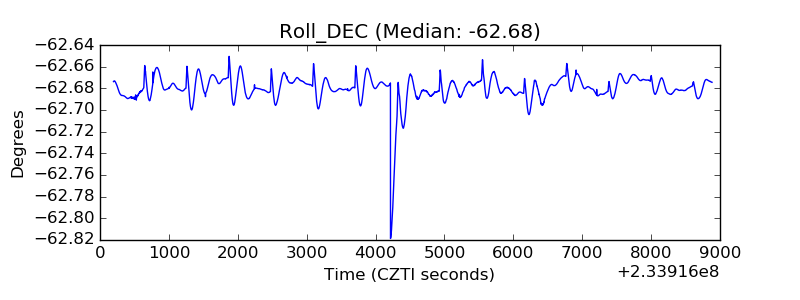 |
| _Roll_RA | 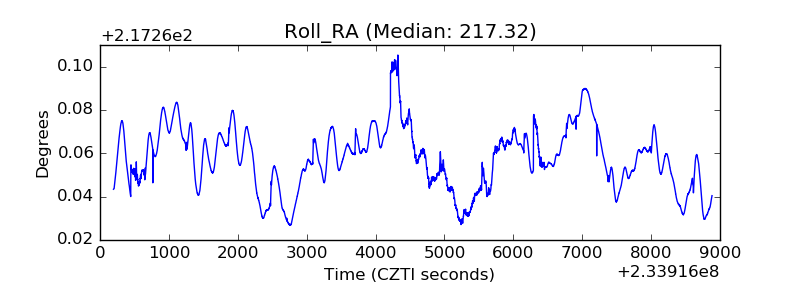 |
| Veto Counter | 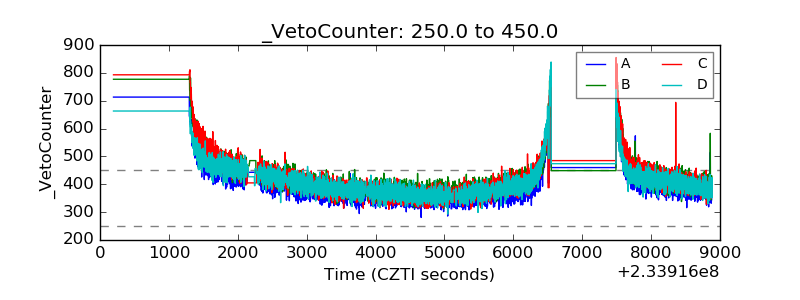 |