| Param | Original file | Final file |
|---|---|---|
| Filename | modeM0/AS1A03_046T01_9000001260_09049cztM0_level2.evt | modeM0/AS1A03_046T01_9000001260_09049cztM0_level2_quad_clean.evt |
| Size (bytes) | 1,288,333,440 | 255,084,480 |
| Size | 1.2 GB | 243.3 MB |
| Events in quadrant A | 10,878,476 | 1,642,552 |
| Events in quadrant B | 8,554,323 | 1,661,496 |
| Events in quadrant C | 7,884,642 | 1,646,545 |
| Events in quadrant D | 10,529,291 | 1,581,732 |
| Mode SS | |||
|---|---|---|---|
| Quadrant | BADHDUFLAG | Total packets | Discarded packets |
| A | 0 | 414 | 66 |
| B | 0 | 414 | 60 |
| C | 0 | 415 | 61 |
| D | 0 | 414 | 56 |
| Mode M9 | |||
|---|---|---|---|
| Quadrant | BADHDUFLAG | Total packets | Discarded packets |
| A | 0 | 41 | 2 |
| B | 0 | 41 | 6 |
| C | 0 | 41 | 5 |
| D | 0 | 41 | 5 |
| Mode M0 | |||
|---|---|---|---|
| Quadrant | BADHDUFLAG | Total packets | Discarded packets |
| A | 0 | 50692 | 6711 |
| B | 0 | 44137 | 7483 |
| C | 0 | 41738 | 6066 |
| D | 0 | 50012 | 7032 |
| Quadrant | Total seconds | Saturated seconds | Saturation percentage |
|---|---|---|---|
| A | 17292 | 495 | 2.862595% |
| B | 17261 | 410 | 2.375297% |
| C | 17365 | 292 | 1.681543% |
| D | 17263 | 595 | 3.446678% |
Noise dominated data is calculated using 1-second bins in cleaned event files. If a bin has >2000 counts, and if more than 50% of those come from <1% of pixels, then it is considered to be noise-dominated and hence unusable.
| Quadrant | # 1 sec bins | Bins with >0 counts | Bins with >2000 counts | High rate bins dominated by noise | Noise dominated (total time) | Noise dominated (detector-on time) | Marked lightcurve |
|---|---|---|---|---|---|---|---|
| A | 24350 | 18153 | 49 | 49 | 0.20% | 0.27% | 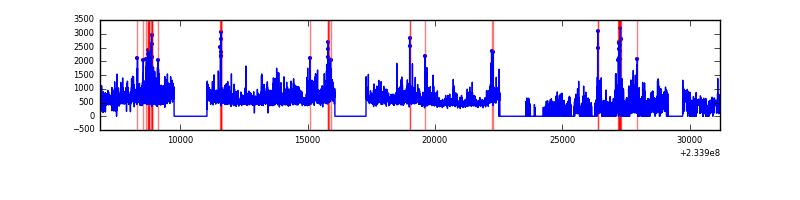 |
| B | 24350 | 18070 | 21 | 21 | 0.09% | 0.12% | 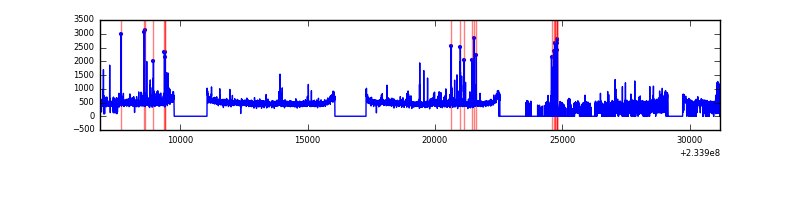 |
| C | 24349 | 18182 | 1 | 1 | 0.00% | 0.01% | 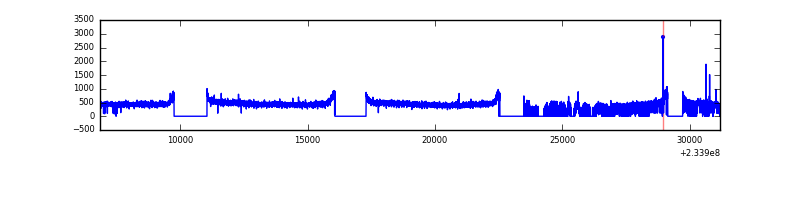 |
| D | 24350 | 18110 | 319 | 319 | 1.31% | 1.76% | 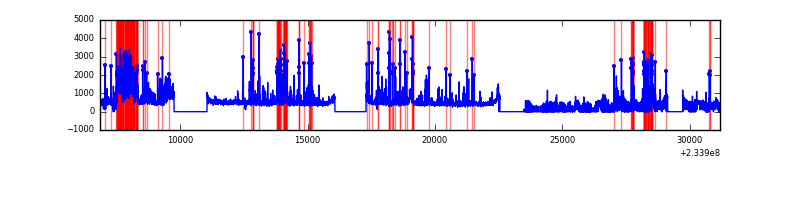 |
Top three noisy pixels from each quadrant. If the there are fewer than three noisy pixels in the level2.evt file, extra rows are filled as -1
| Pixel properties | Quadrant properties | ||||||
|---|---|---|---|---|---|---|---|
| Quadrant | DetID | PixID | Counts | Sigma | Mean | Median | Sigma |
| A | 8 | 5 | 1258519 | 3033.4 | 2072 | 2032 | 414.2 |
| A | 1 | 162 | 486460 | 1169.5 | 2072 | 2032 | 414.2 |
| A | 5 | 16 | 454951 | 1093.43 | 2072 | 2032 | 414.2 |
| B | 10 | 16 | 174313 | 446.92 | 2074 | 2021 | 385.5 |
| B | 6 | 51 | 95801 | 243.26 | 2074 | 2021 | 385.5 |
| B | 4 | 48 | 68422 | 172.24 | 2074 | 2021 | 385.5 |
| C | 13 | 61 | 15392 | 29.19 | 2014 | 2019 | 458.2 |
| C | 14 | 234 | 15150 | 28.66 | 2014 | 2019 | 458.2 |
| C | 8 | 128 | 5766 | 8.18 | 2014 | 2019 | 458.2 |
| D | 1 | 52 | 1601575 | 3228.66 | 1993 | 1938 | 495.4 |
| D | 2 | 14 | 464468 | 933.56 | 1993 | 1938 | 495.4 |
| D | 6 | 225 | 420018 | 843.84 | 1993 | 1938 | 495.4 |
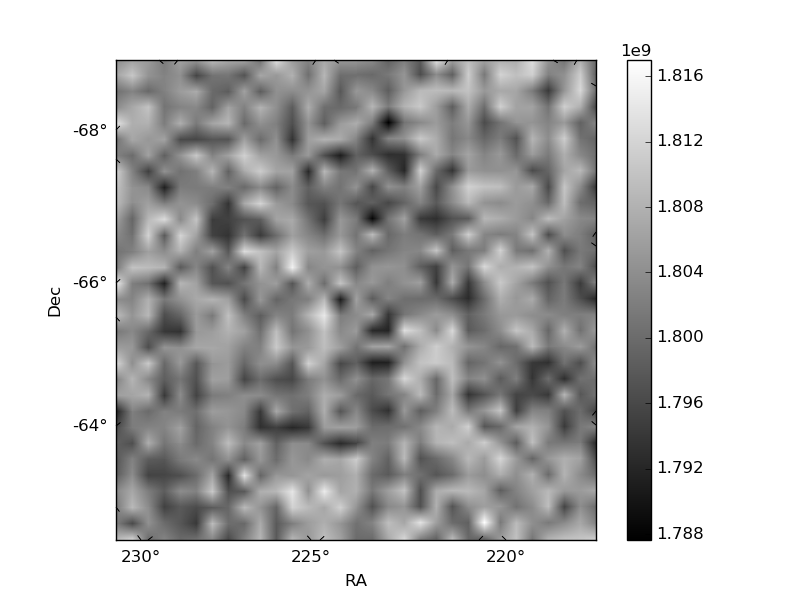
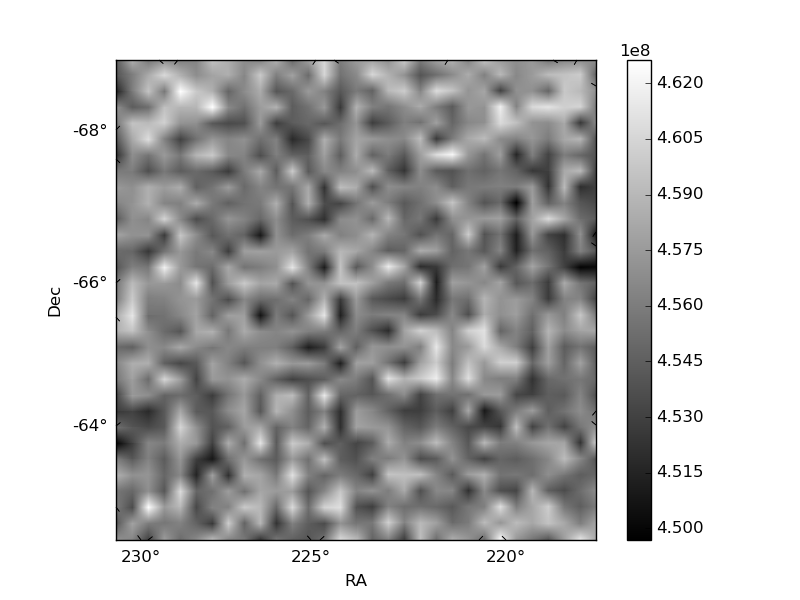
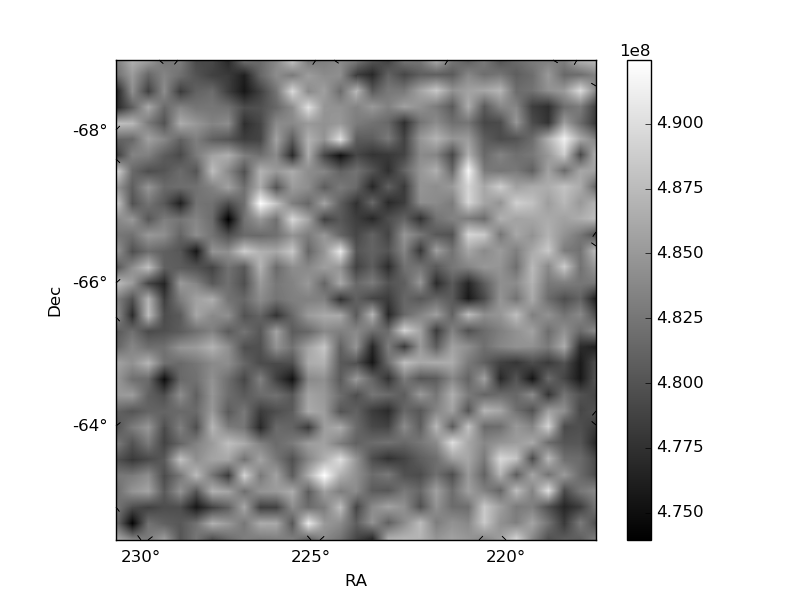
Histogram calculated using DETX and DETY for each event in the final _common_clean file
| Quadrant A | 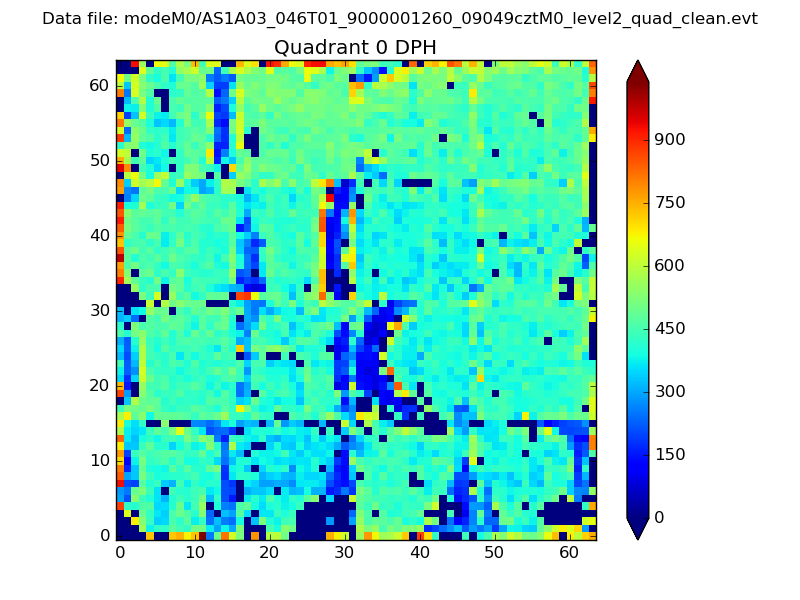 |
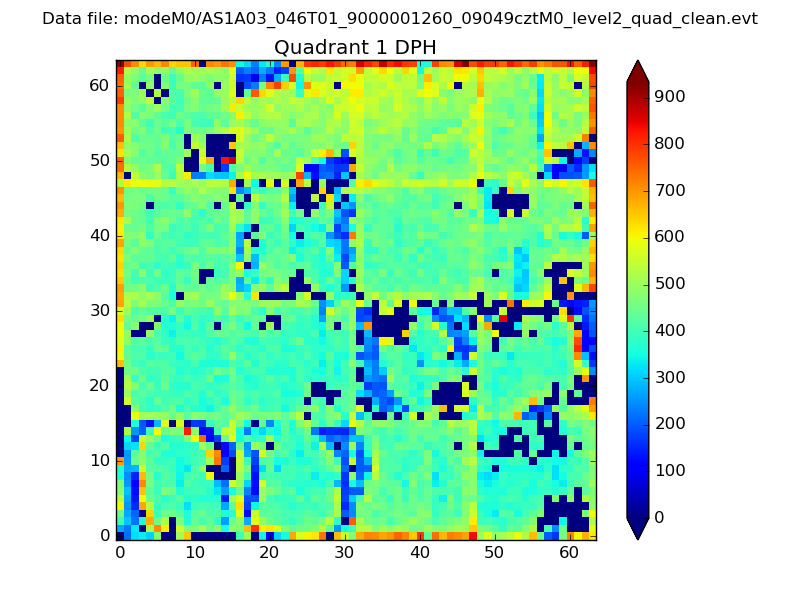 |
Quadrant B |
|---|---|---|---|
| Quadrant D | 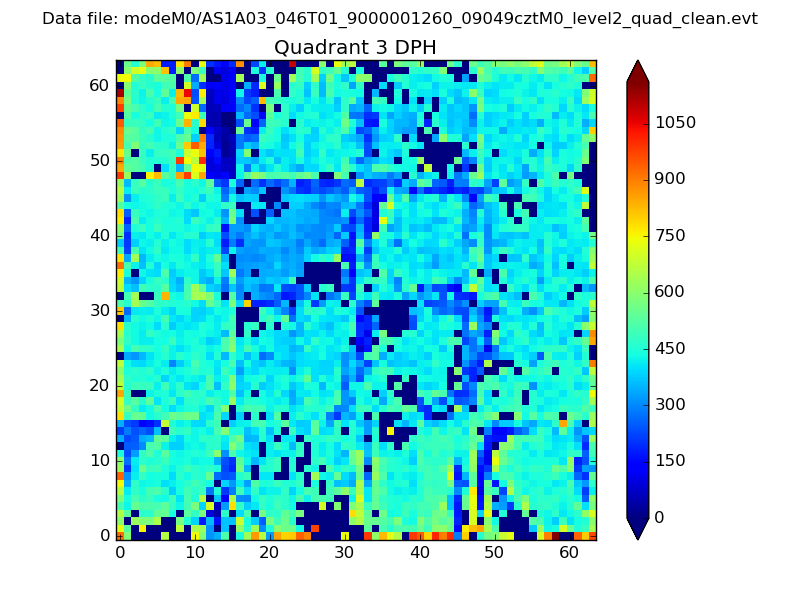 |
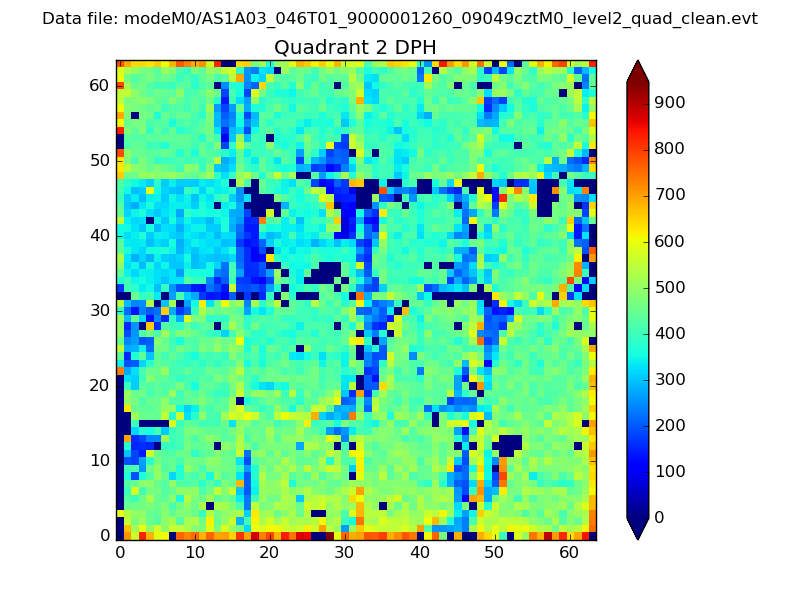 |
Quadrant C |
| Plot type | Count rate plots | Images |
|---|---|---|
| Comparison with Poisson distribution Blue bars denote a histogram of data divided into 1 sec bins. Red curve is a Poisson curve with rate = median count rate of data. |
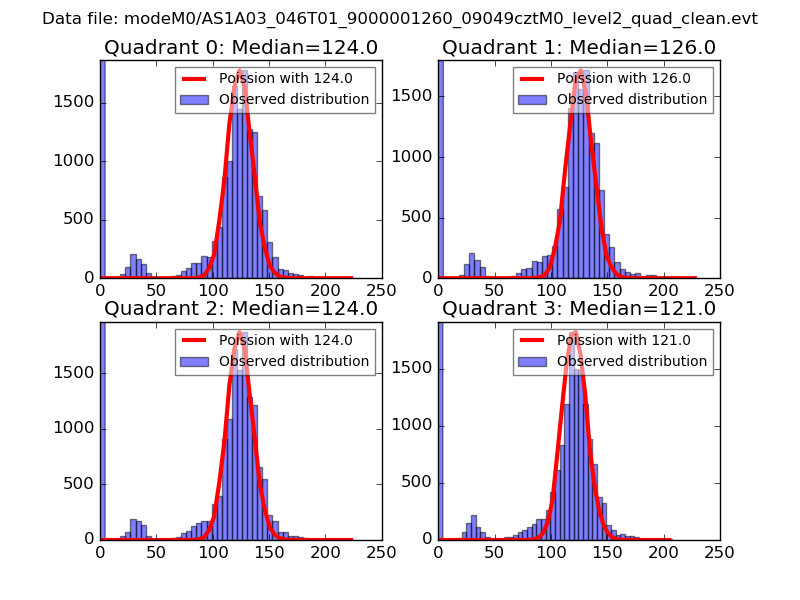 |
 |
| Quadrant-wise count rates Data is divided into 100 sec bins |
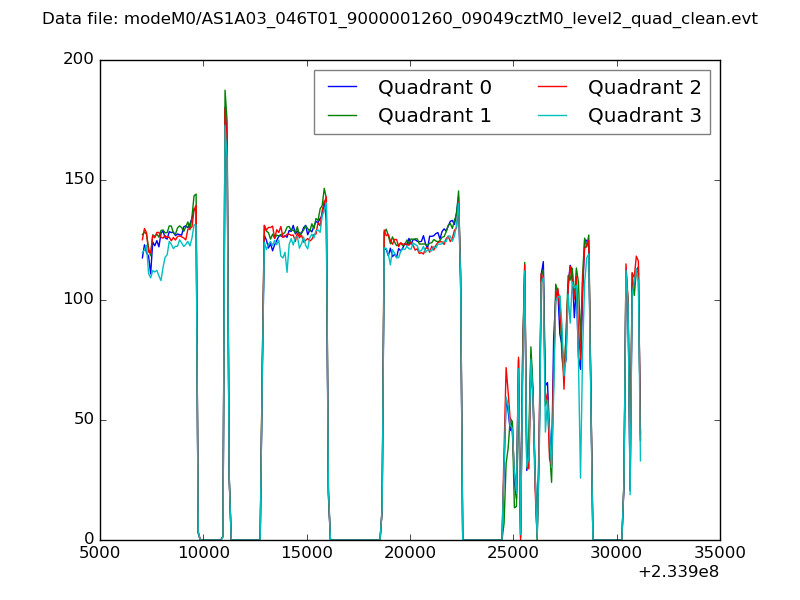 |
|
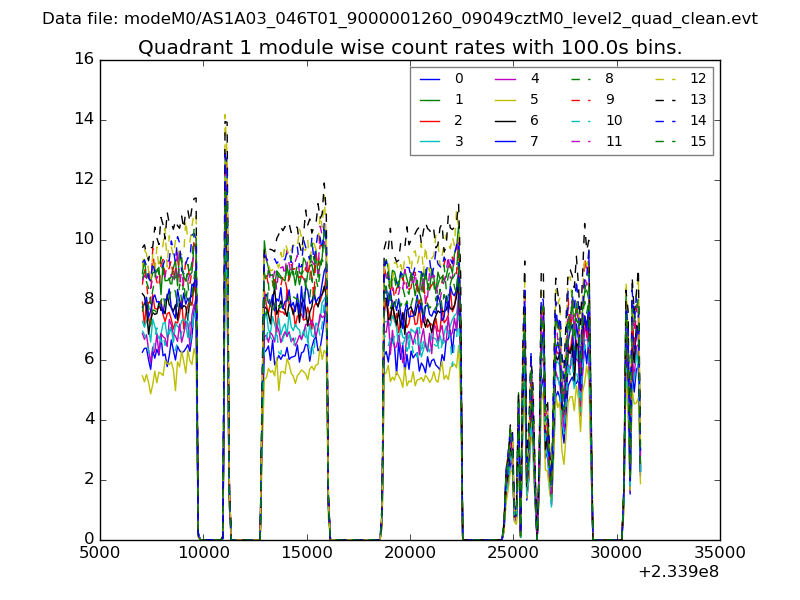
| Module-wise count rates for Quadrant A Data is divided into 100 sec bins |
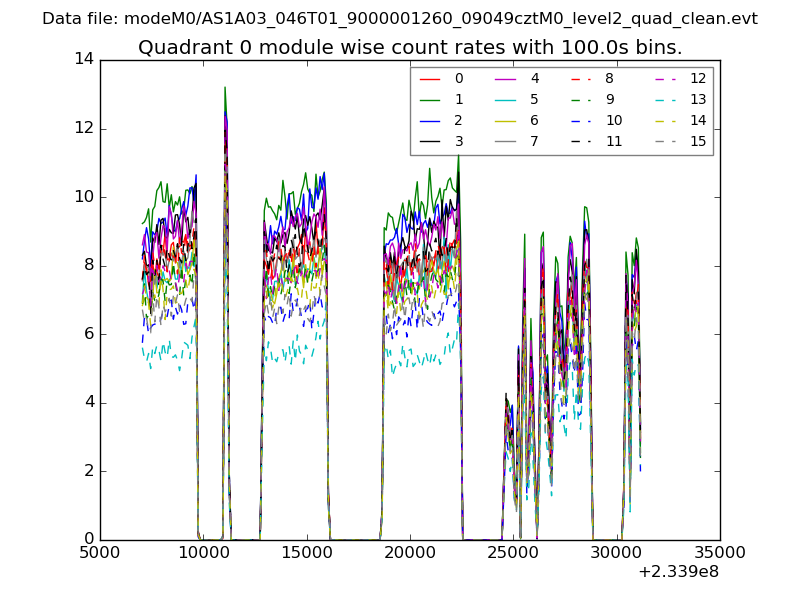 |
 |
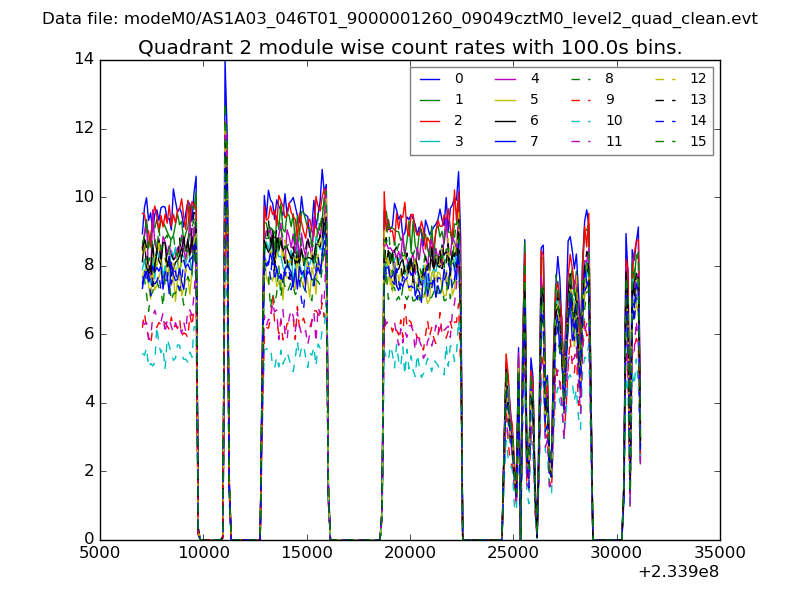
| Module-wise count rates for Quadrant B Data is divided into 100 sec bins |
 |
 |
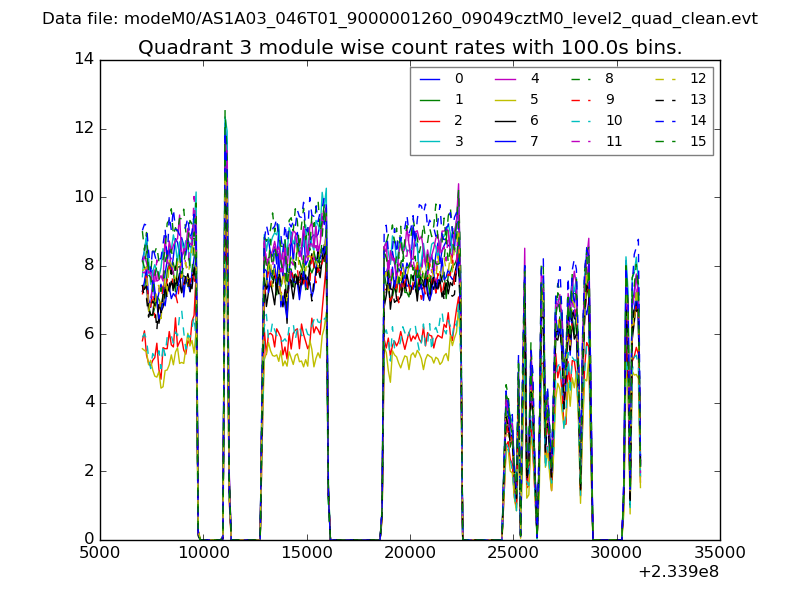
| Module-wise count rates for Quadrant C Data is divided into 100 sec bins |
 |
 |
| Module-wise count rates for Quadrant D Data is divided into 100 sec bins |
 |
 |
| Parameter | Plot |
|---|---|
| CZT HV Monitor | 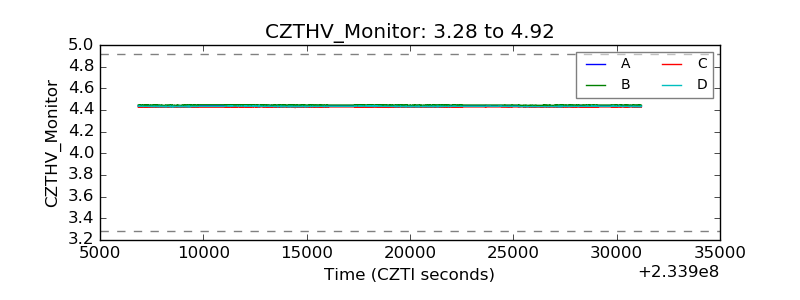 |
| D_VDD | 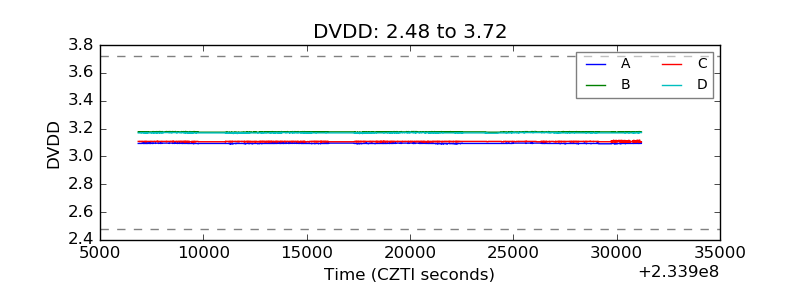 |
| Temperature 1 | 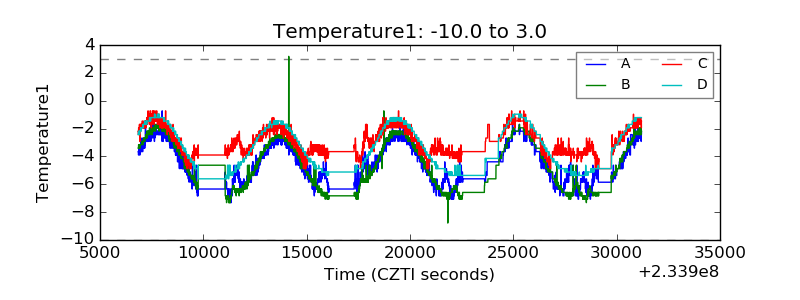 |
| Veto HV Monitor | 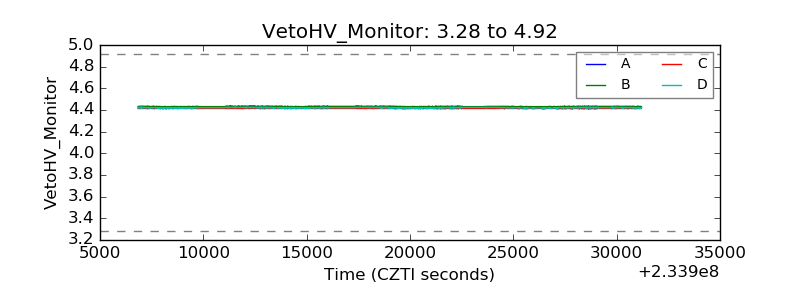 |
| Veto LLD | 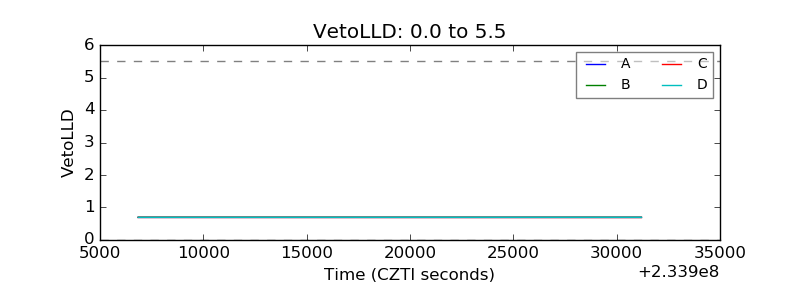 |
| Alpha Counter | 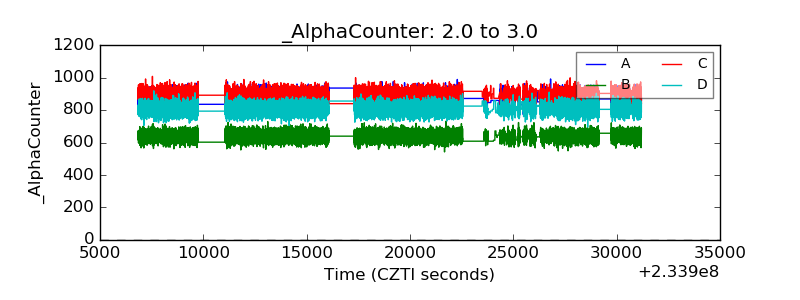 |
| _CPM_Rate | 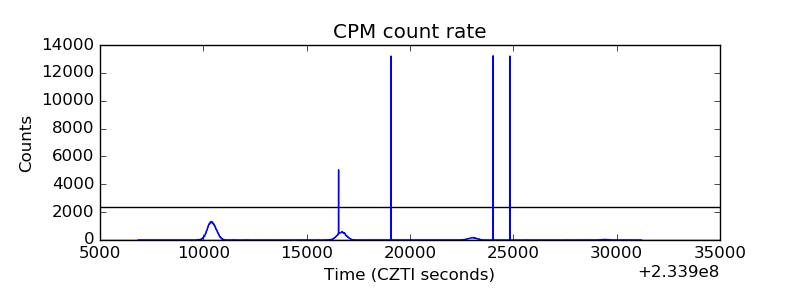 |
| CZT Counter | 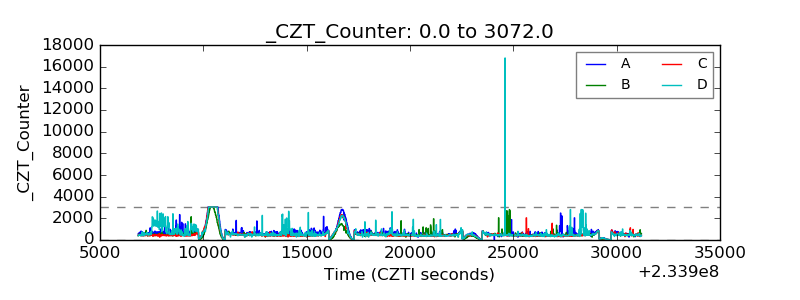 |
| +2.5 Volts monitor | 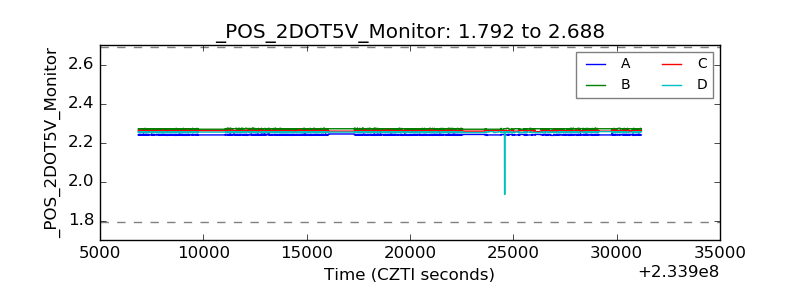 |
| +5 Volts monitor |  |
| _ROLL_ROT | 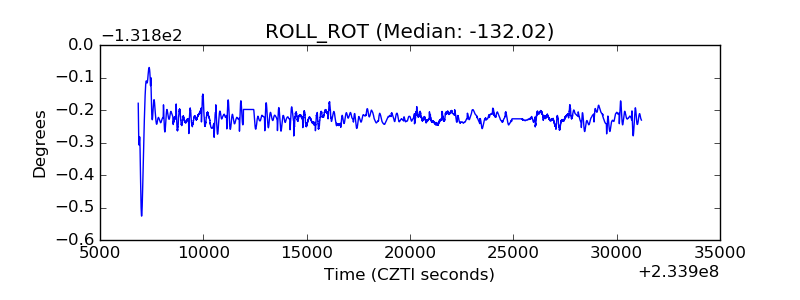 |
| _Roll_DEC | 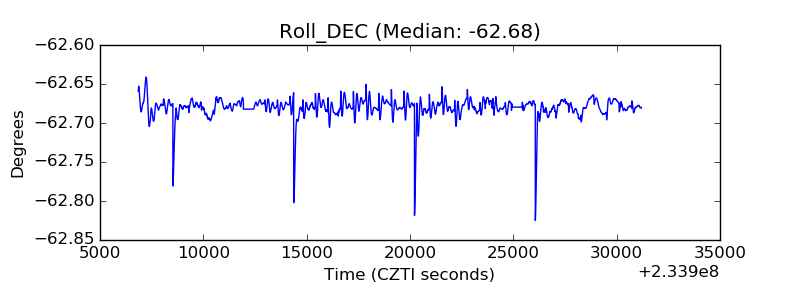 |
| _Roll_RA | 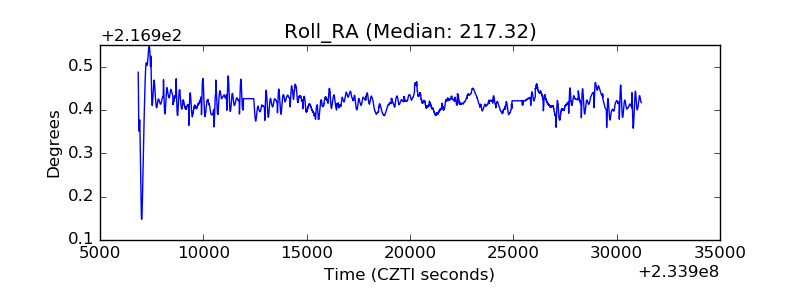 |
| Veto Counter | 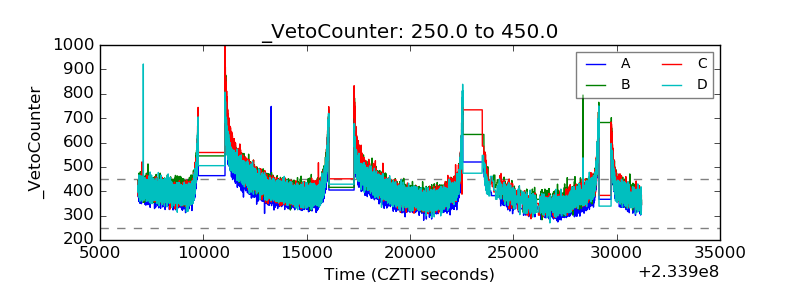 |