| Param | Original file | Final file |
|---|---|---|
| Filename | modeM0/AS1A03_046T01_9000001260_09050cztM0_level2.evt | modeM0/AS1A03_046T01_9000001260_09050cztM0_level2_quad_clean.evt |
| Size (bytes) | 509,981,760 | 104,192,640 |
| Size | 486.4 MB | 99.4 MB |
| Events in quadrant A | 4,123,350 | 661,171 |
| Events in quadrant B | 3,697,996 | 664,802 |
| Events in quadrant C | 3,440,375 | 654,320 |
| Events in quadrant D | 3,663,444 | 643,238 |
| Mode SS | |||
|---|---|---|---|
| Quadrant | BADHDUFLAG | Total packets | Discarded packets |
| A | 0 | 156 | 0 |
| B | 0 | 156 | 0 |
| C | 0 | 156 | 0 |
| D | 0 | 156 | 0 |
| Mode M9 | |||
|---|---|---|---|
| Quadrant | BADHDUFLAG | Total packets | Discarded packets |
| A | 0 | 1 | 0 |
| B | 0 | 1 | 0 |
| C | 0 | 1 | 0 |
| D | 0 | 1 | 0 |
| Mode M0 | |||
|---|---|---|---|
| Quadrant | BADHDUFLAG | Total packets | Discarded packets |
| A | 0 | 17264 | 50 |
| B | 0 | 16171 | 40 |
| C | 0 | 15821 | 45 |
| D | 0 | 16407 | 42 |
| Quadrant | Total seconds | Saturated seconds | Saturation percentage |
|---|---|---|---|
| A | 7643 | 184 | 2.407432% |
| B | 7646 | 206 | 2.694219% |
| C | 7643 | 96 | 1.256051% |
| D | 7648 | 138 | 1.804393% |
Noise dominated data is calculated using 1-second bins in cleaned event files. If a bin has >2000 counts, and if more than 50% of those come from <1% of pixels, then it is considered to be noise-dominated and hence unusable.
| Quadrant | # 1 sec bins | Bins with >0 counts | Bins with >2000 counts | High rate bins dominated by noise | Noise dominated (total time) | Noise dominated (detector-on time) | Marked lightcurve |
|---|---|---|---|---|---|---|---|
| A | 7803 | 7664 | 6 | 6 | 0.08% | 0.08% | 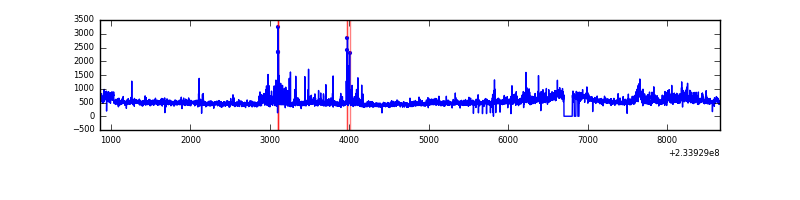 |
| B | 7803 | 7666 | 6 | 6 | 0.08% | 0.08% | 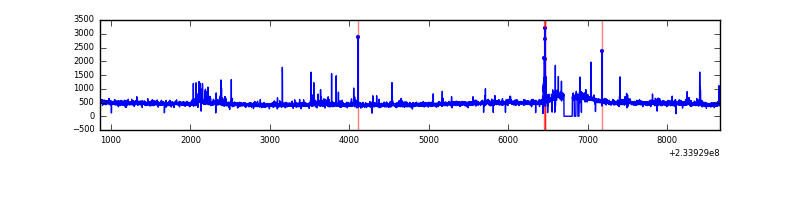 |
| C | 7803 | 7666 | 1 | 1 | 0.01% | 0.01% | 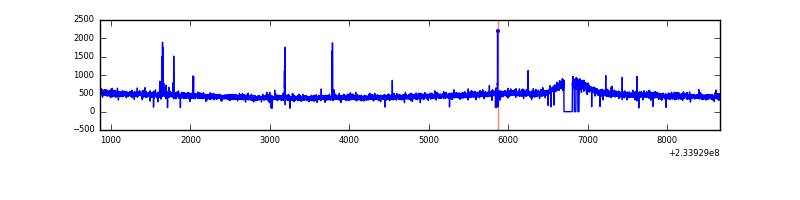 |
| D | 7803 | 7664 | 39 | 39 | 0.50% | 0.51% | 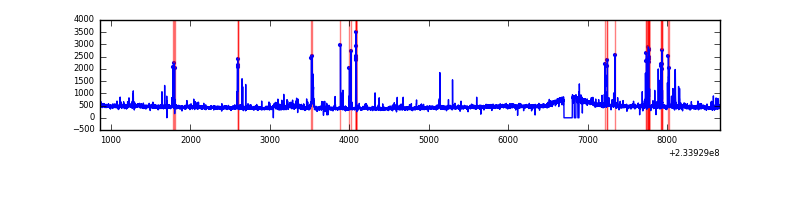 |
Top three noisy pixels from each quadrant. If the there are fewer than three noisy pixels in the level2.evt file, extra rows are filled as -1
| Pixel properties | Quadrant properties | ||||||
|---|---|---|---|---|---|---|---|
| Quadrant | DetID | PixID | Counts | Sigma | Mean | Median | Sigma |
| A | 8 | 5 | 522110 | 2901.83 | 892 | 868 | 179.6 |
| A | 5 | 16 | 70375 | 386.96 | 892 | 868 | 179.6 |
| A | 1 | 162 | 49721 | 271.97 | 892 | 868 | 179.6 |
| B | 10 | 16 | 134489 | 786.87 | 893 | 870 | 169.8 |
| B | 12 | 111 | 18614 | 104.49 | 893 | 870 | 169.8 |
| B | 0 | 214 | 15400 | 85.57 | 893 | 870 | 169.8 |
| C | 14 | 234 | 31755 | 153.6 | 867 | 869 | 201.1 |
| C | 8 | 128 | 14602 | 68.3 | 867 | 869 | 201.1 |
| C | 8 | 112 | 6928 | 30.13 | 867 | 869 | 201.1 |
| D | 2 | 14 | 234119 | 1062.64 | 866 | 843 | 219.5 |
| D | 6 | 225 | 69054 | 310.72 | 866 | 843 | 219.5 |
| D | 2 | 234 | 32473 | 144.08 | 866 | 843 | 219.5 |
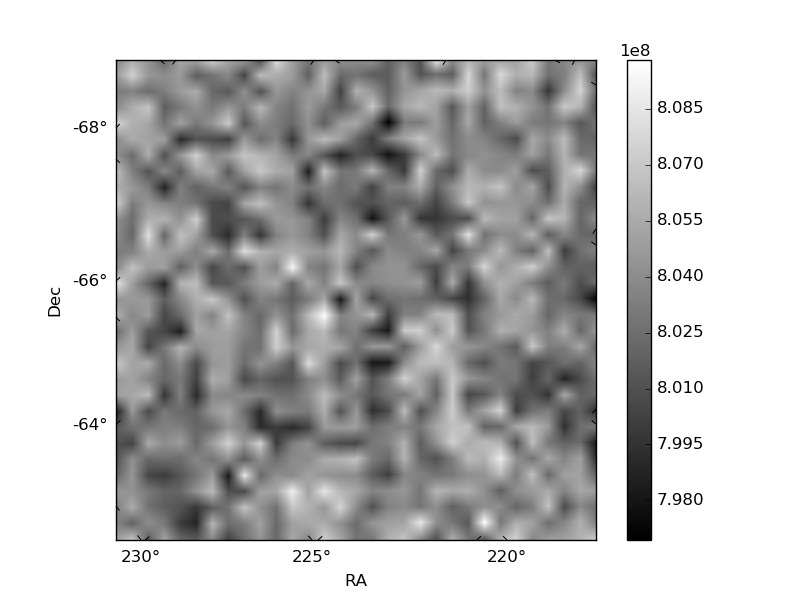
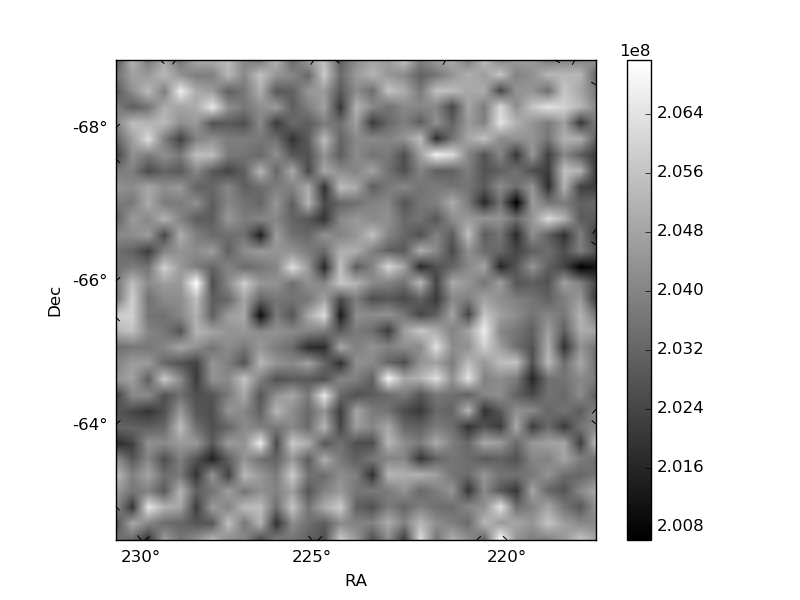
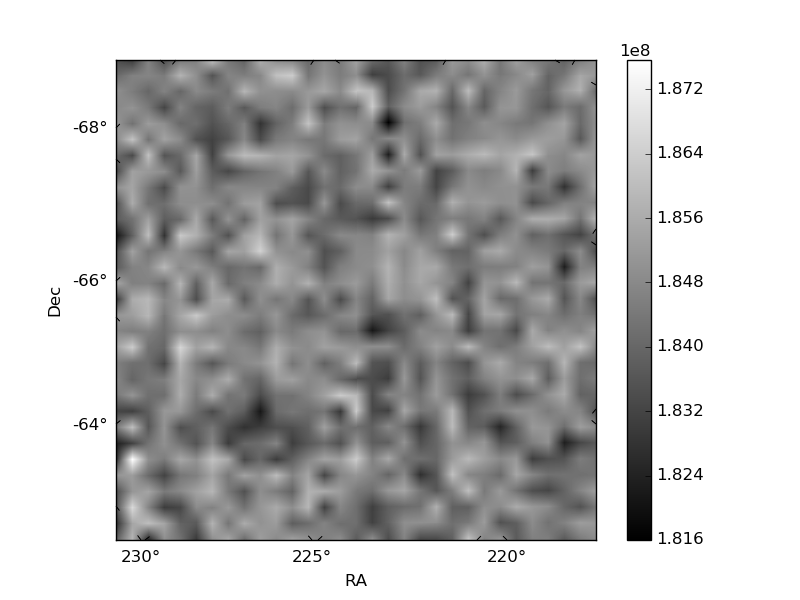
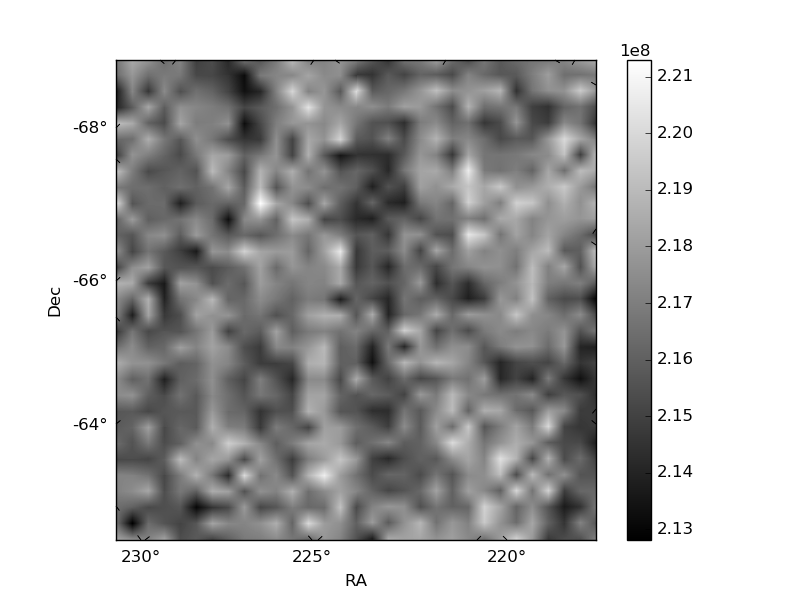
Histogram calculated using DETX and DETY for each event in the final _common_clean file
| Quadrant A | 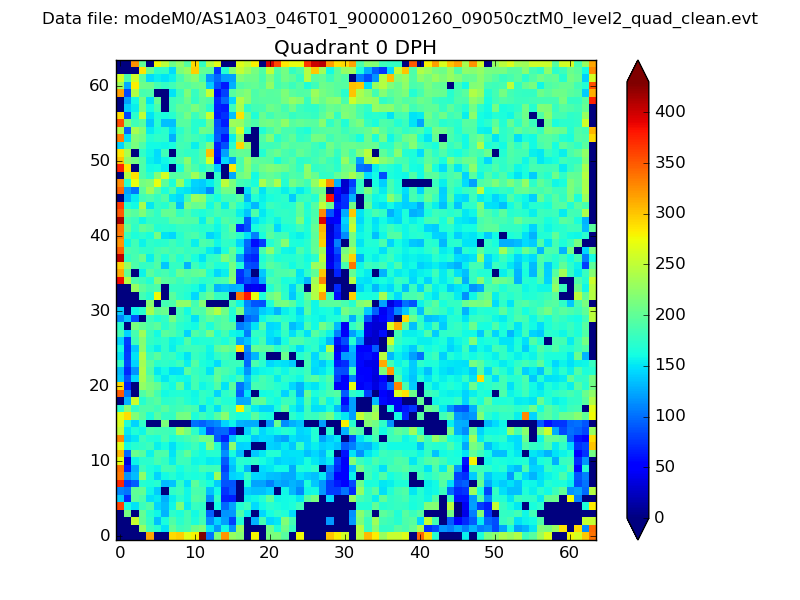 |
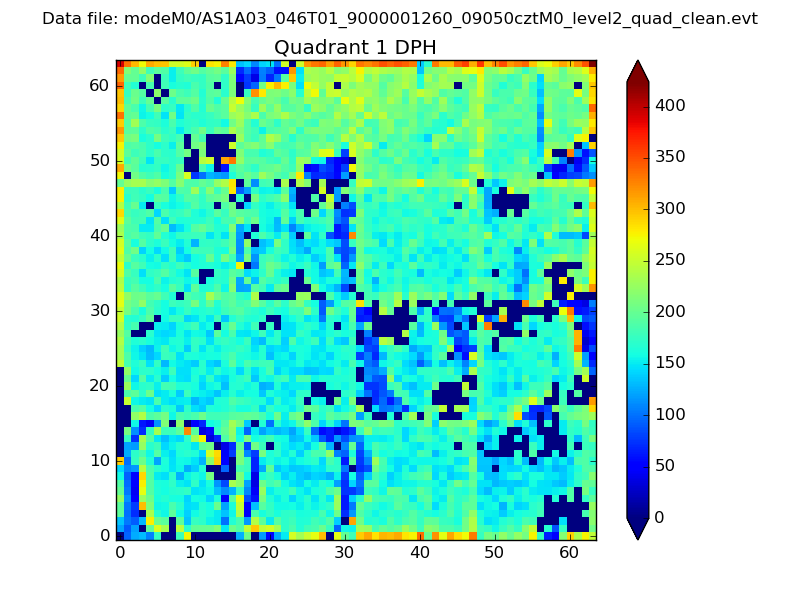 |
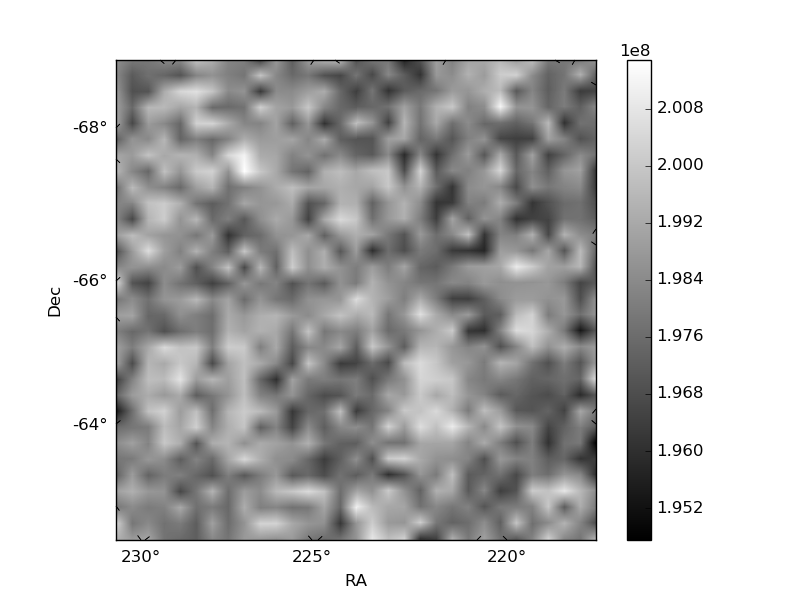
Quadrant B |
|---|---|---|---|
| Quadrant D | 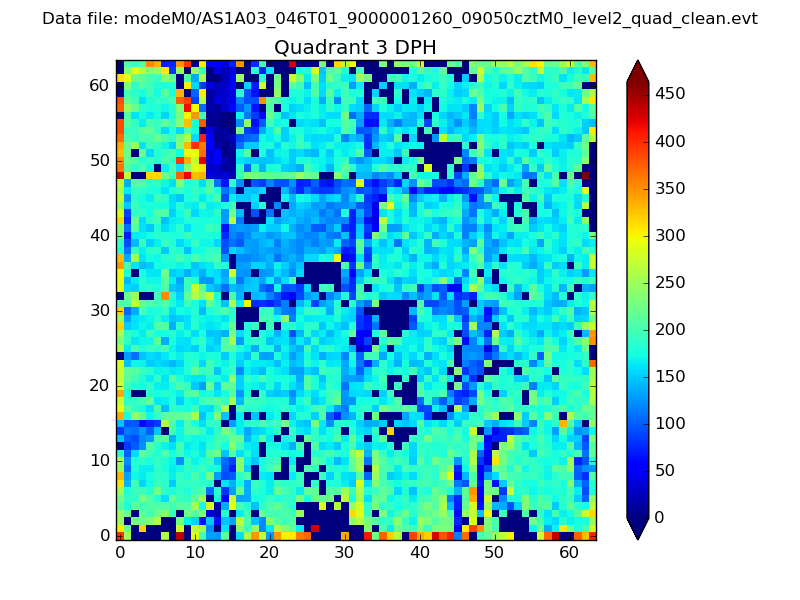 |
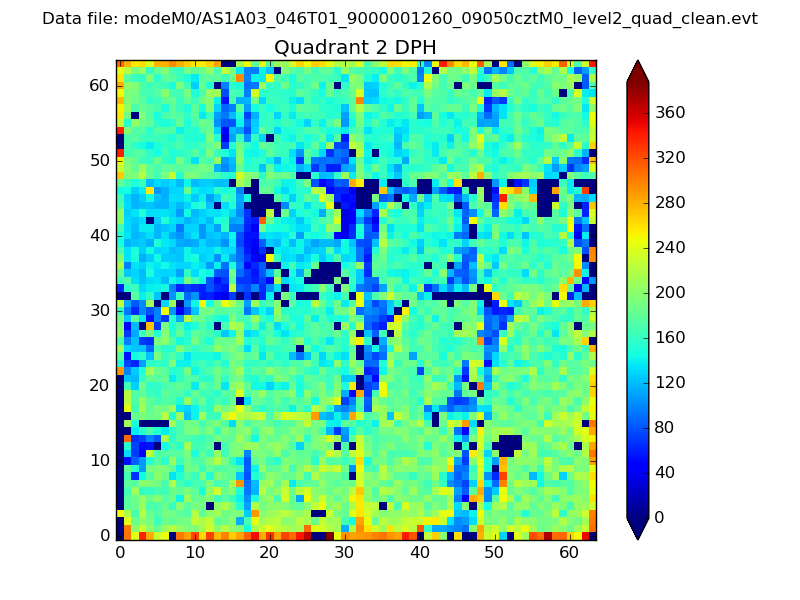 |
Quadrant C |
| Plot type | Count rate plots | Images |
|---|---|---|
| Comparison with Poisson distribution Blue bars denote a histogram of data divided into 1 sec bins. Red curve is a Poisson curve with rate = median count rate of data. |
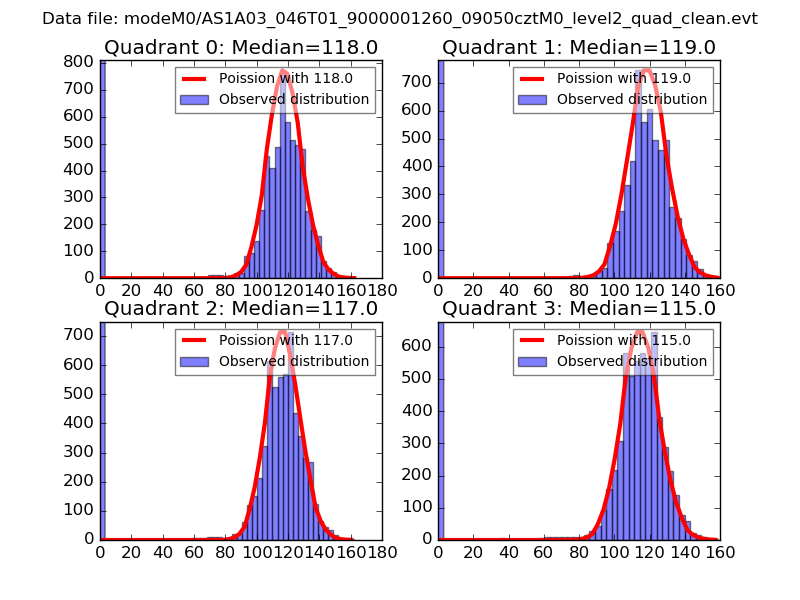 |
 |
| Quadrant-wise count rates Data is divided into 100 sec bins |
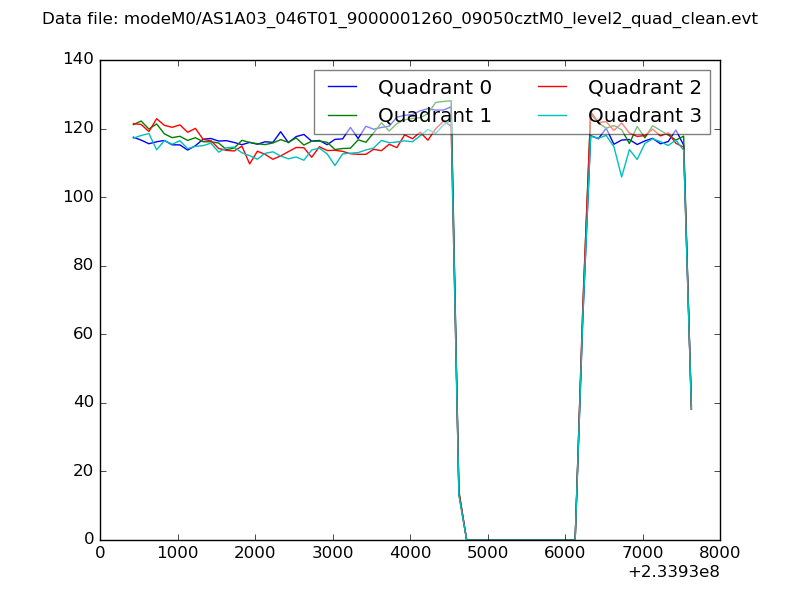 |
|
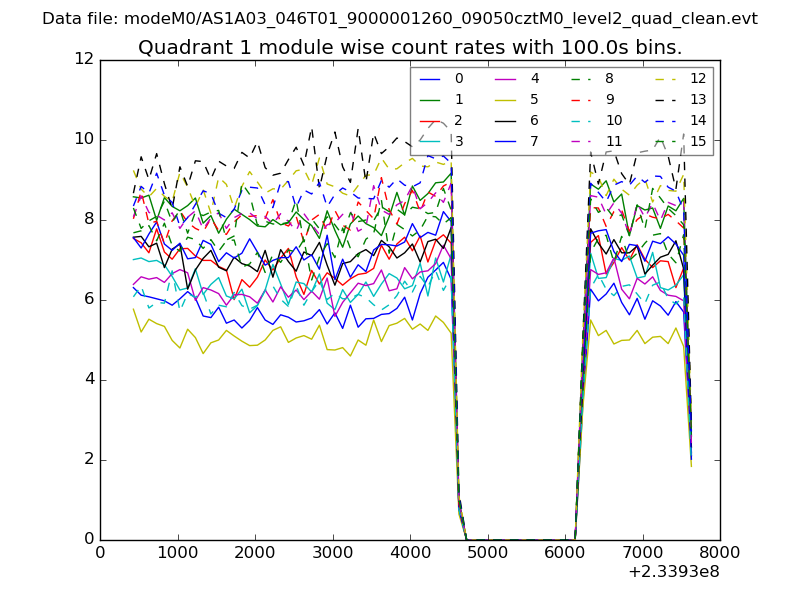
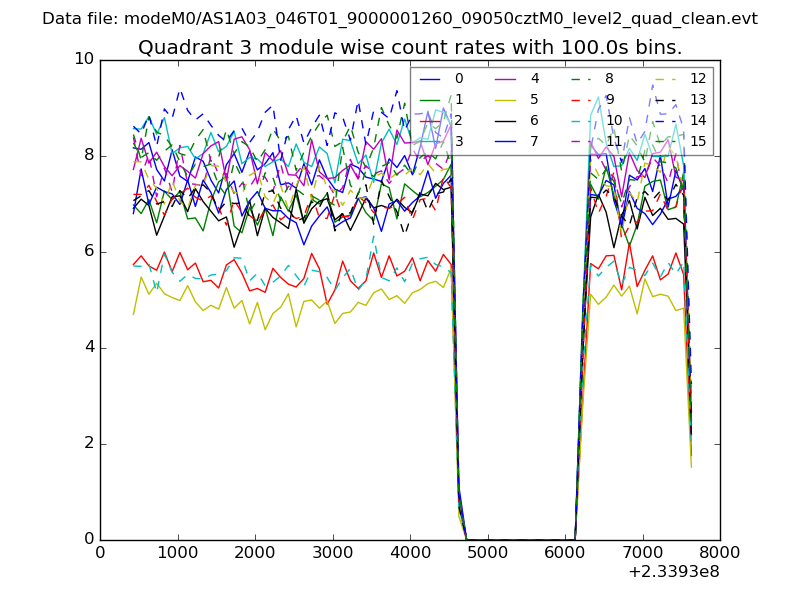
| Module-wise count rates for Quadrant A Data is divided into 100 sec bins |
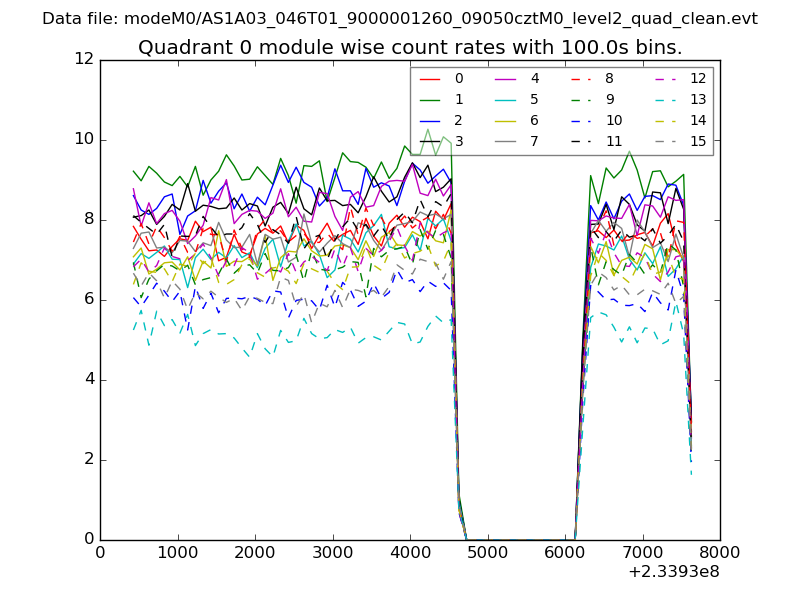 |
 |
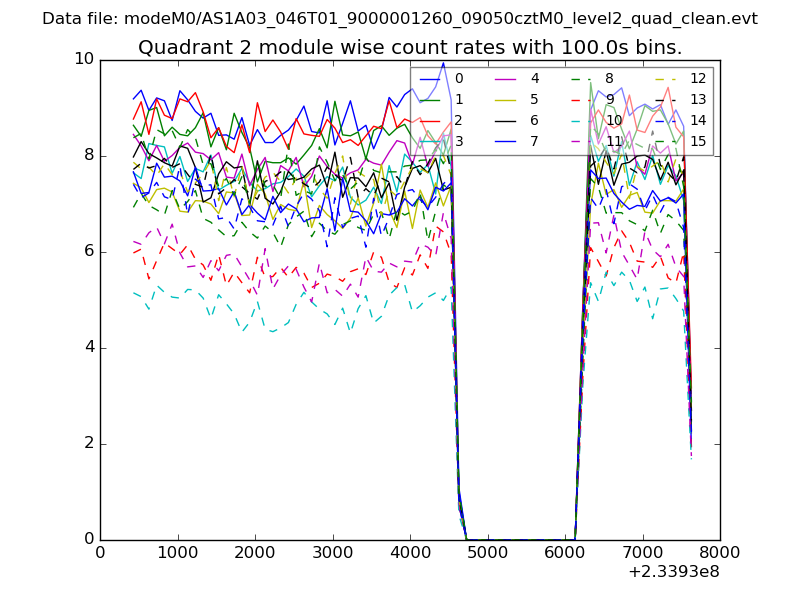
| Module-wise count rates for Quadrant B Data is divided into 100 sec bins |
 |
 |
| Module-wise count rates for Quadrant C Data is divided into 100 sec bins |
 |
 |
| Module-wise count rates for Quadrant D Data is divided into 100 sec bins |
 |
 |
| Parameter | Plot |
|---|---|
| CZT HV Monitor | 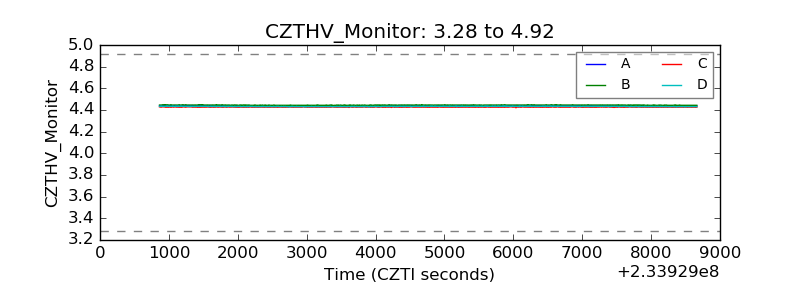 |
| D_VDD | 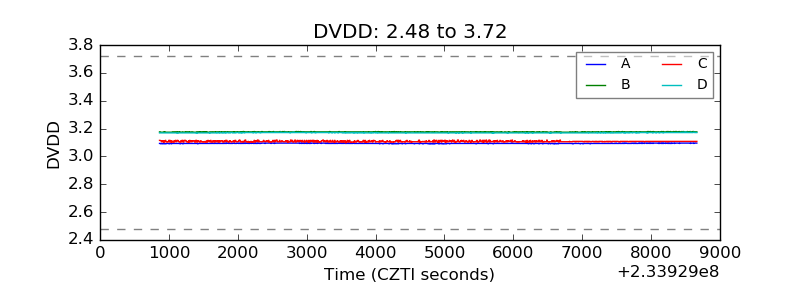 |
| Temperature 1 | 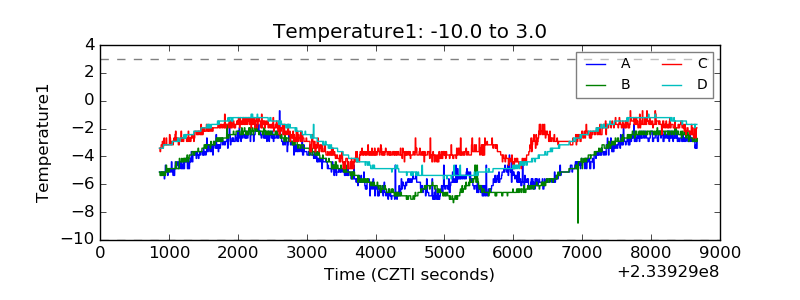 |
| Veto HV Monitor | 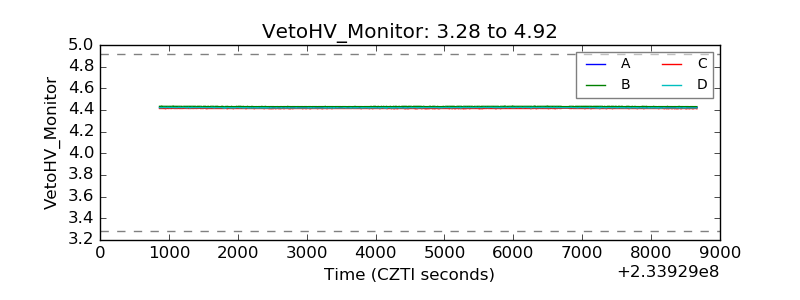 |
| Veto LLD | 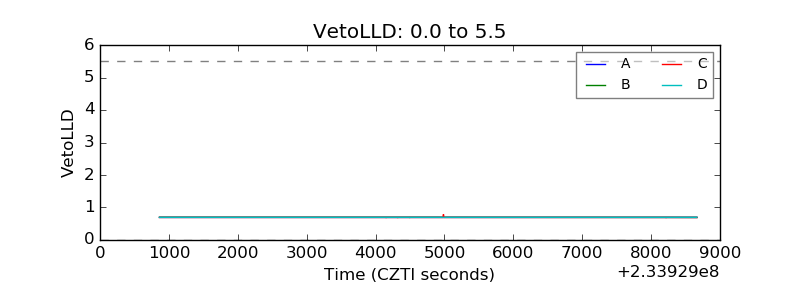 |
| Alpha Counter | 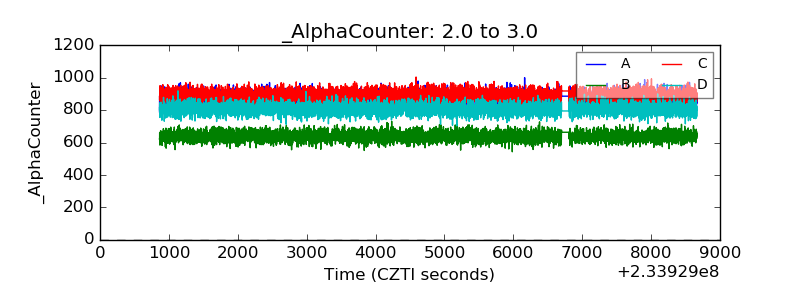 |
| _CPM_Rate | 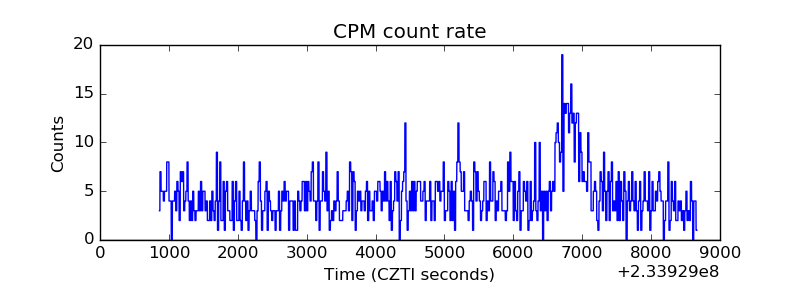 |
| CZT Counter | 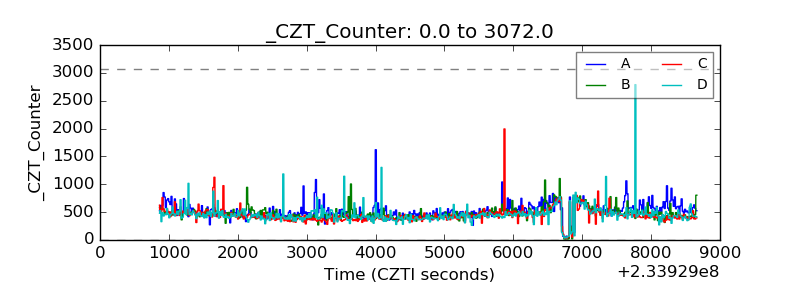 |
| +2.5 Volts monitor | 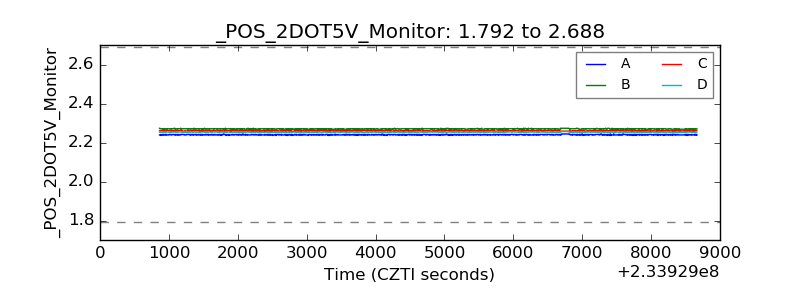 |
| +5 Volts monitor | 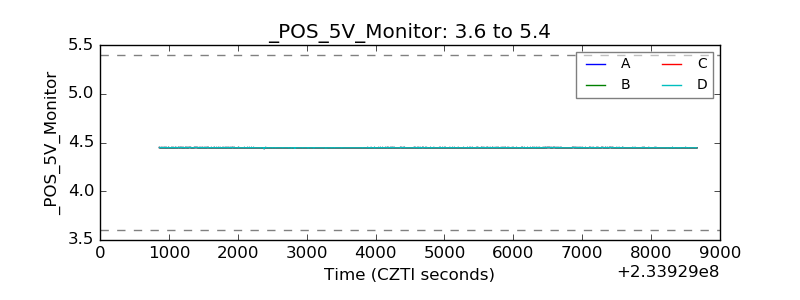 |
| _ROLL_ROT | 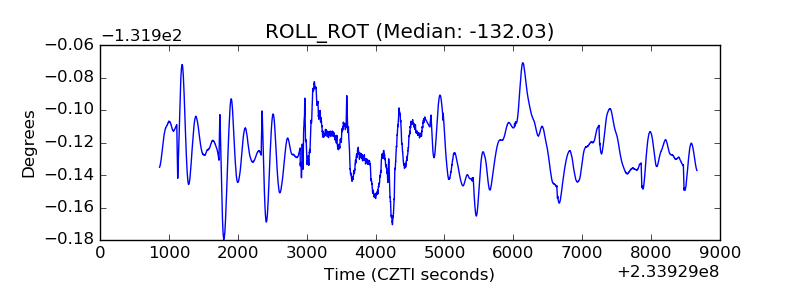 |
| _Roll_DEC | 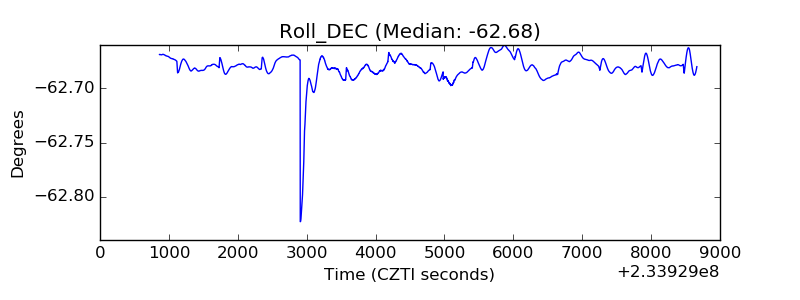 |
| _Roll_RA | 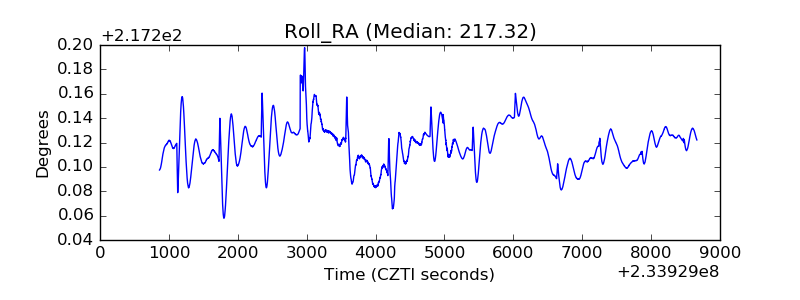 |
| Veto Counter | 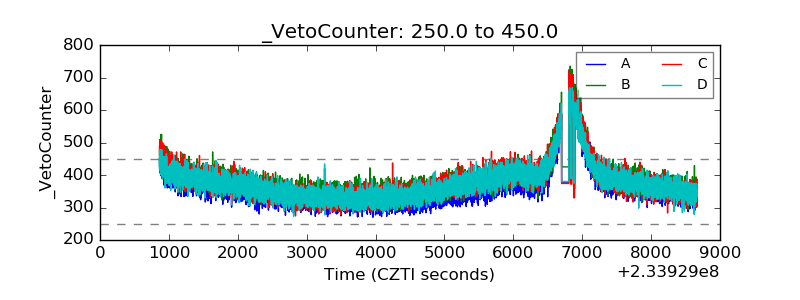 |