| Param | Original file | Final file |
|---|---|---|
| Filename | modeM0/AS1A03_046T01_9000001260_09051cztM0_level2.evt | modeM0/AS1A03_046T01_9000001260_09051cztM0_level2_quad_clean.evt |
| Size (bytes) | 514,730,880 | 108,835,200 |
| Size | 490.9 MB | 103.8 MB |
| Events in quadrant A | 4,467,056 | 699,444 |
| Events in quadrant B | 3,497,120 | 704,862 |
| Events in quadrant C | 3,311,673 | 690,529 |
| Events in quadrant D | 3,803,457 | 679,422 |
| Mode SS | |||
|---|---|---|---|
| Quadrant | BADHDUFLAG | Total packets | Discarded packets |
| A | 0 | 152 | 0 |
| B | 0 | 152 | 0 |
| C | 0 | 152 | 0 |
| D | 0 | 152 | 0 |
| Mode M9 | |||
|---|---|---|---|
| Quadrant | BADHDUFLAG | Total packets | Discarded packets |
| A | 0 | 2 | 0 |
| B | 0 | 2 | 0 |
| C | 0 | 2 | 0 |
| D | 0 | 2 | 0 |
| Mode M0 | |||
|---|---|---|---|
| Quadrant | BADHDUFLAG | Total packets | Discarded packets |
| A | 0 | 18478 | 45 |
| B | 0 | 15561 | 23 |
| C | 0 | 15482 | 28 |
| D | 0 | 16661 | 47 |
| Quadrant | Total seconds | Saturated seconds | Saturation percentage |
|---|---|---|---|
| A | 7498 | 85 | 1.133636% |
| B | 7503 | 79 | 1.052912% |
| C | 7503 | 43 | 0.573104% |
| D | 7498 | 120 | 1.600427% |
Noise dominated data is calculated using 1-second bins in cleaned event files. If a bin has >2000 counts, and if more than 50% of those come from <1% of pixels, then it is considered to be noise-dominated and hence unusable.
| Quadrant | # 1 sec bins | Bins with >0 counts | Bins with >2000 counts | High rate bins dominated by noise | Noise dominated (total time) | Noise dominated (detector-on time) | Marked lightcurve |
|---|---|---|---|---|---|---|---|
| A | 7694 | 7514 | 1 | 1 | 0.01% | 0.01% | 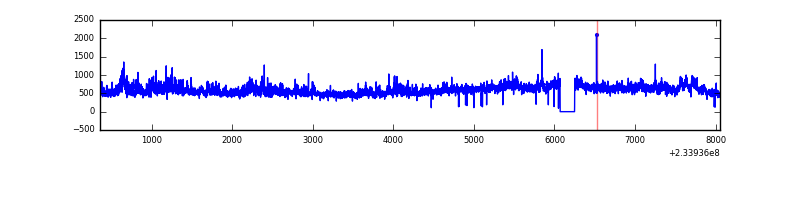 |
| B | 7694 | 7515 | 0 | 0 | 0.00% | 0.00% |  |
| C | 7694 | 7513 | 11 | 11 | 0.14% | 0.15% |  |
| D | 7694 | 7514 | 68 | 68 | 0.88% | 0.90% | 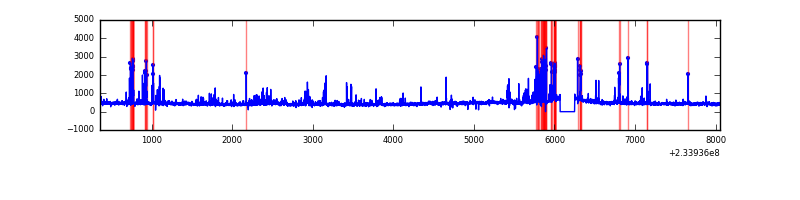 |
Top three noisy pixels from each quadrant. If the there are fewer than three noisy pixels in the level2.evt file, extra rows are filled as -1
| Pixel properties | Quadrant properties | ||||||
|---|---|---|---|---|---|---|---|
| Quadrant | DetID | PixID | Counts | Sigma | Mean | Median | Sigma |
| A | 8 | 5 | 898370 | 5116.77 | 863 | 843 | 175.4 |
| A | 1 | 162 | 111776 | 632.43 | 863 | 843 | 175.4 |
| A | 5 | 16 | 44508 | 248.93 | 863 | 843 | 175.4 |
| B | 6 | 51 | 25274 | 147.59 | 866 | 843 | 165.5 |
| B | 10 | 16 | 20640 | 119.6 | 866 | 843 | 165.5 |
| B | 0 | 214 | 18729 | 108.05 | 866 | 843 | 165.5 |
| C | 14 | 234 | 62534 | 321.97 | 831 | 833 | 191.6 |
| C | 13 | 61 | 6332 | 28.7 | 831 | 833 | 191.6 |
| C | 8 | 128 | 4944 | 21.45 | 831 | 833 | 191.6 |
| D | 2 | 14 | 302404 | 1401.65 | 826 | 804 | 215.2 |
| D | 1 | 52 | 194936 | 902.21 | 826 | 804 | 215.2 |
| D | 6 | 225 | 66876 | 307.06 | 826 | 804 | 215.2 |
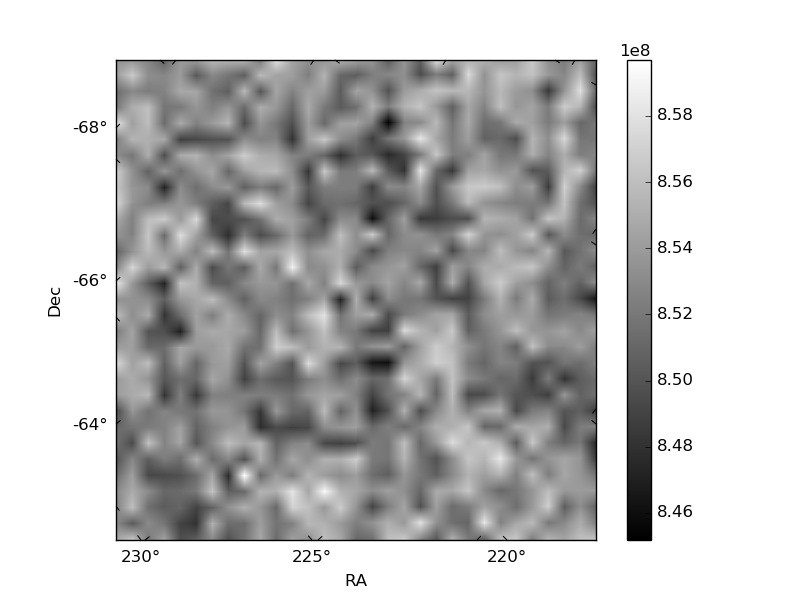
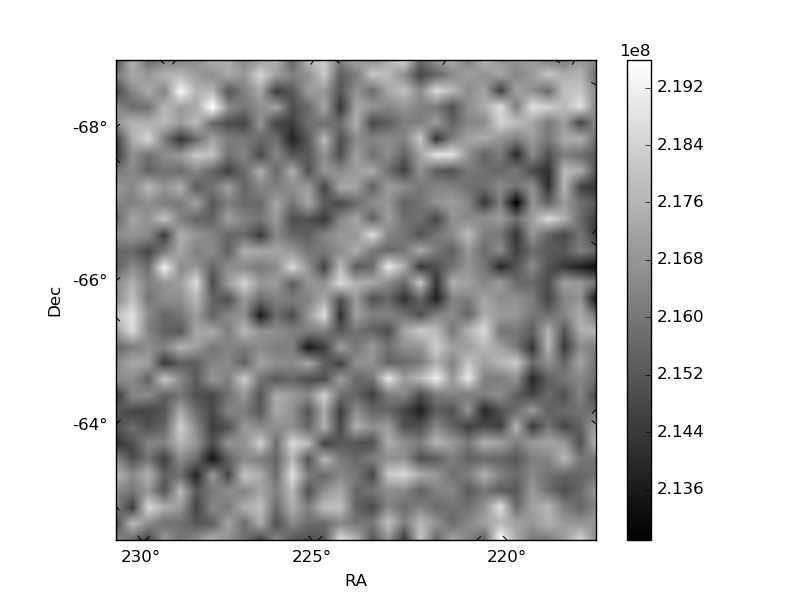
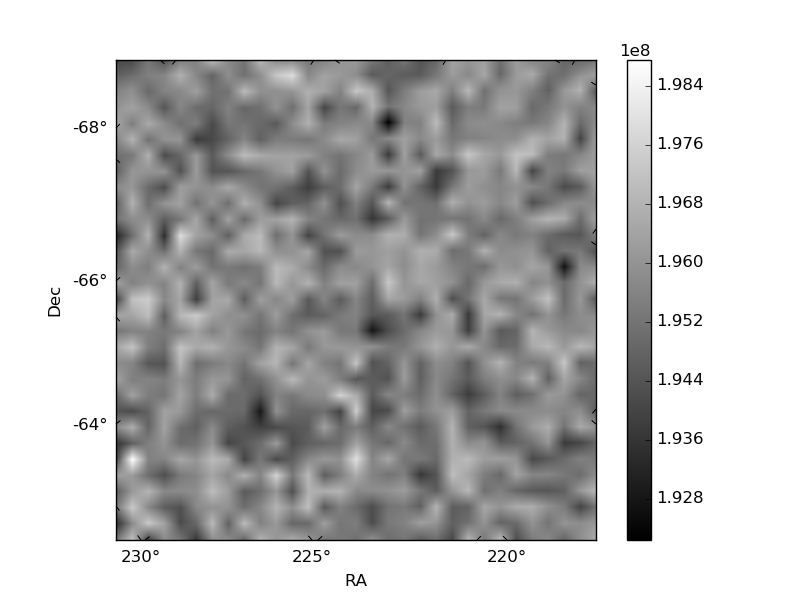
Histogram calculated using DETX and DETY for each event in the final _common_clean file
| Quadrant A | 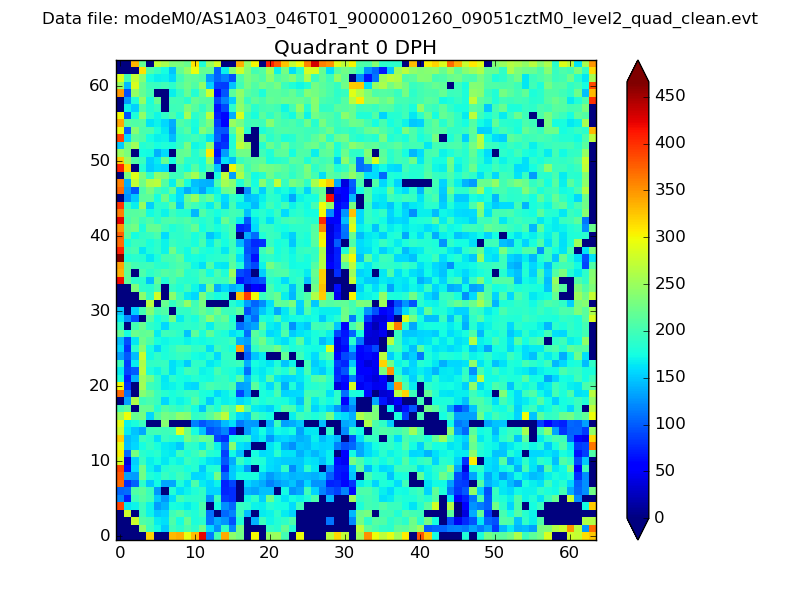 |
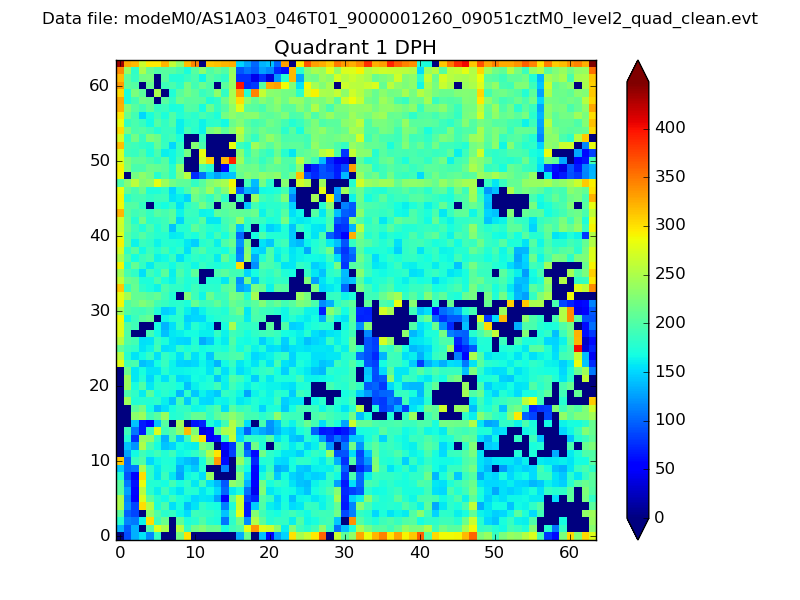 |
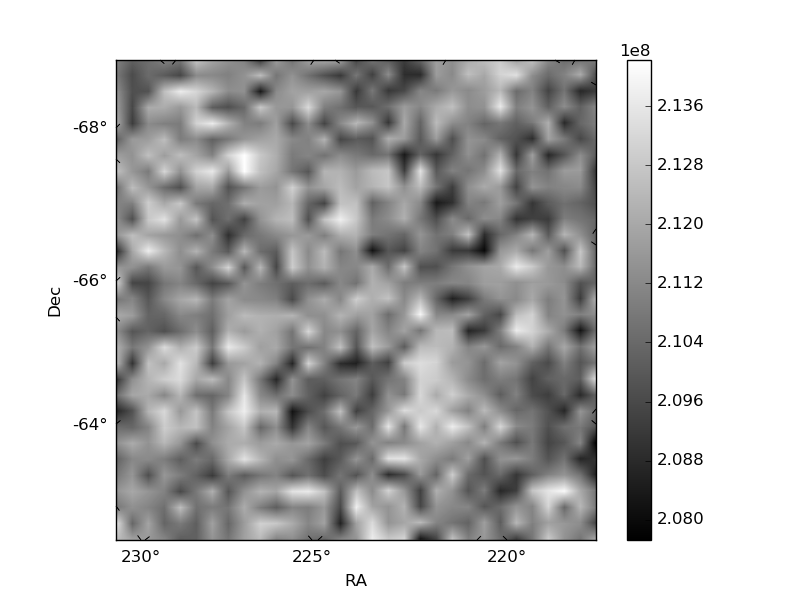
Quadrant B |
|---|---|---|---|
| Quadrant D |  |
 |
Quadrant C |
| Plot type | Count rate plots | Images |
|---|---|---|
| Comparison with Poisson distribution Blue bars denote a histogram of data divided into 1 sec bins. Red curve is a Poisson curve with rate = median count rate of data. |
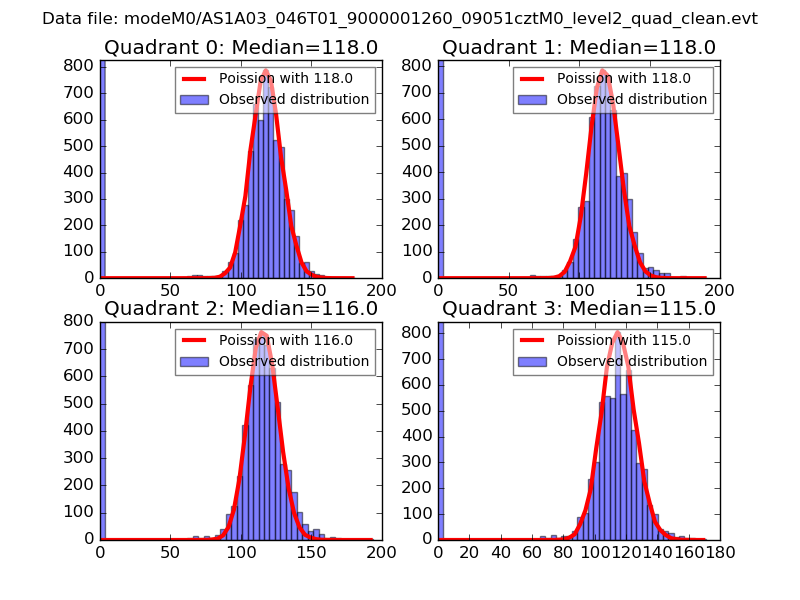 |
 |
| Quadrant-wise count rates Data is divided into 100 sec bins |
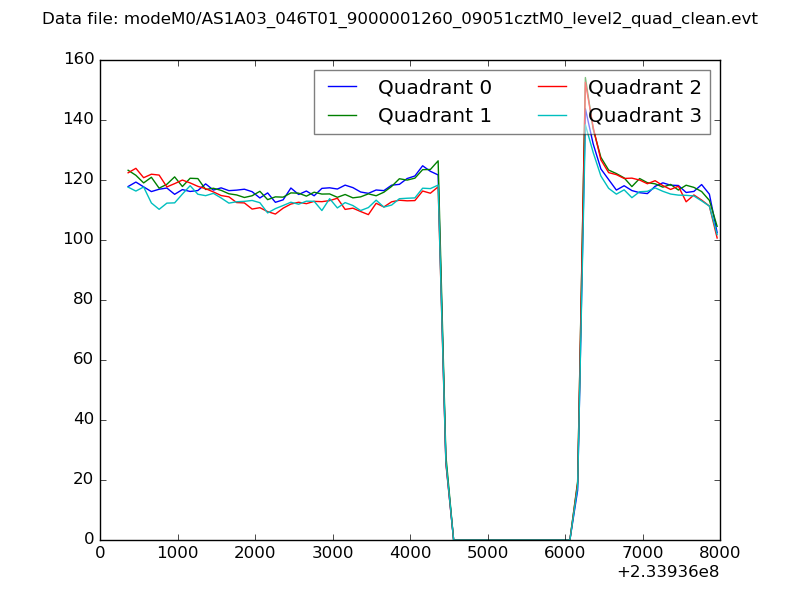 |
|
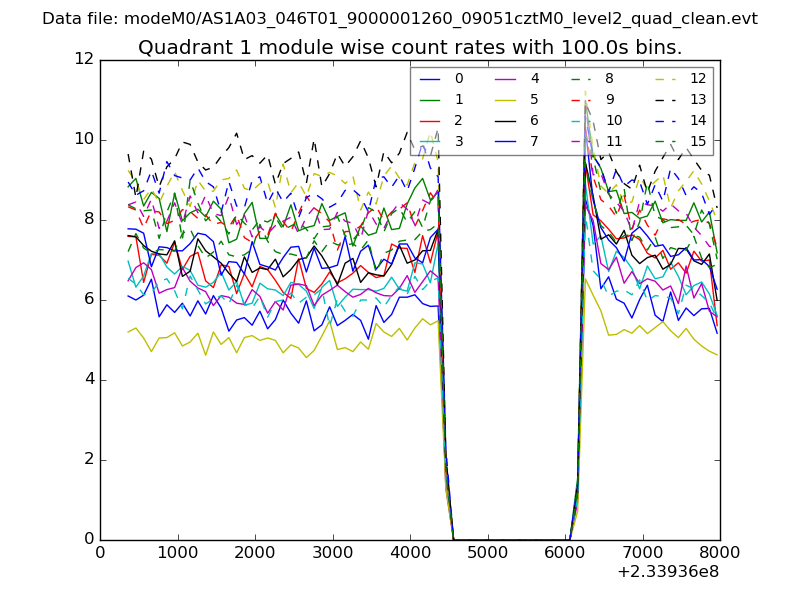
| Module-wise count rates for Quadrant A Data is divided into 100 sec bins |
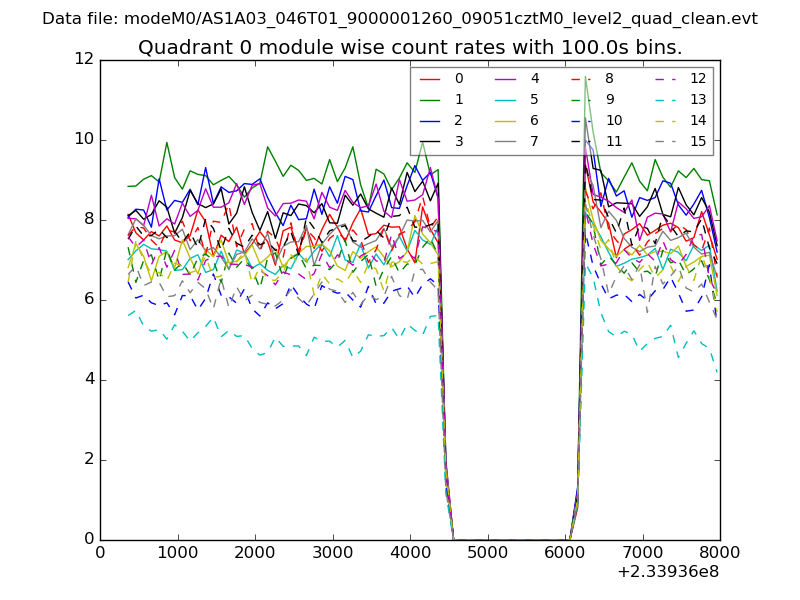 |
 |
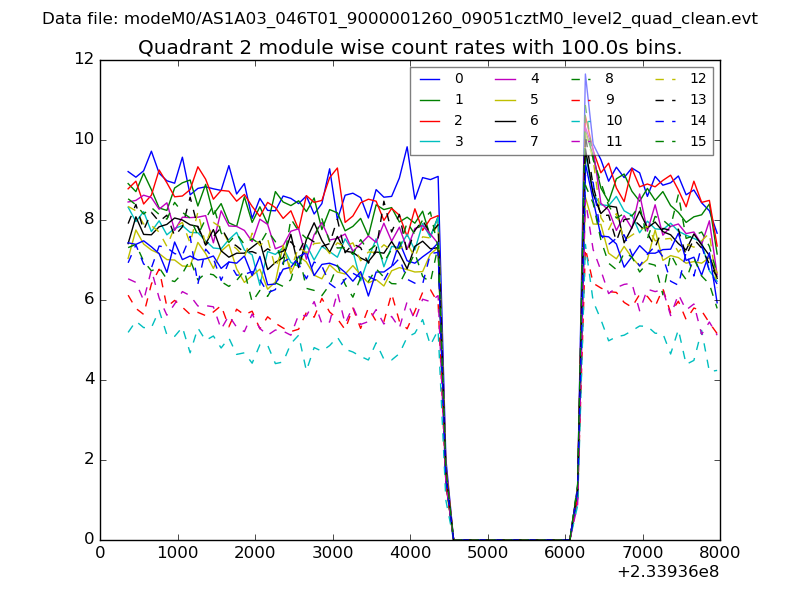
| Module-wise count rates for Quadrant B Data is divided into 100 sec bins |
 |
 |
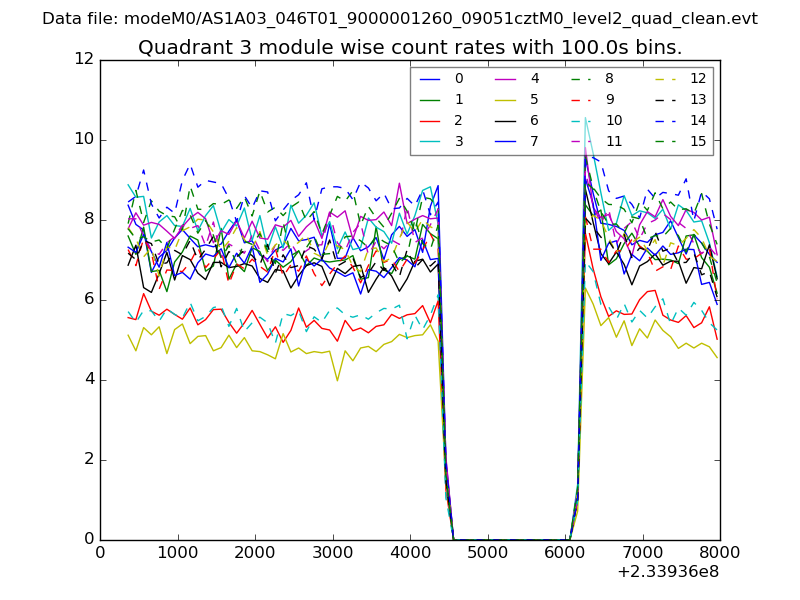
| Module-wise count rates for Quadrant C Data is divided into 100 sec bins |
 |
 |
| Module-wise count rates for Quadrant D Data is divided into 100 sec bins |
 |
 |
| Parameter | Plot |
|---|---|
| CZT HV Monitor | 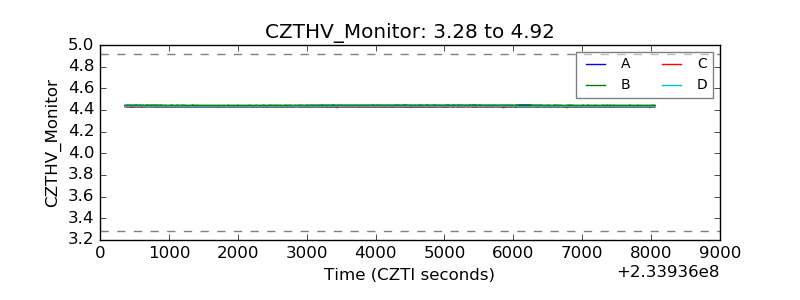 |
| D_VDD | 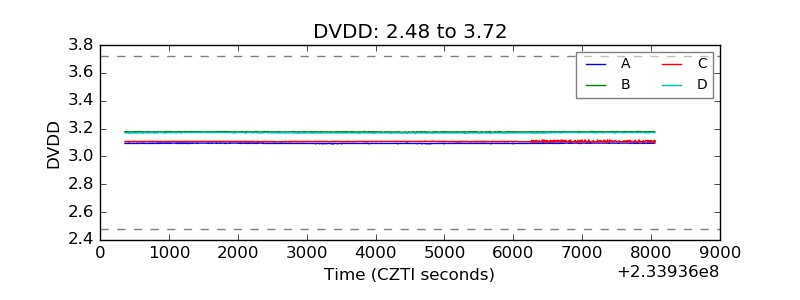 |
| Temperature 1 | 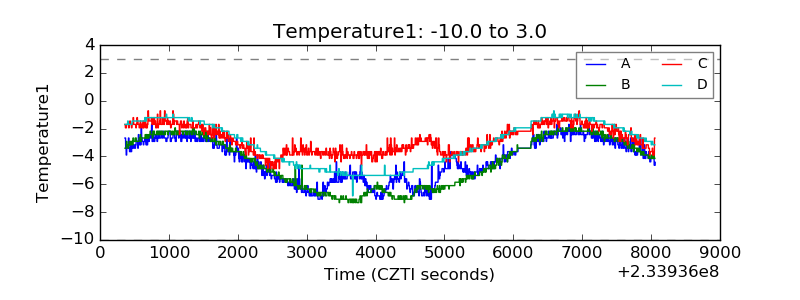 |
| Veto HV Monitor | 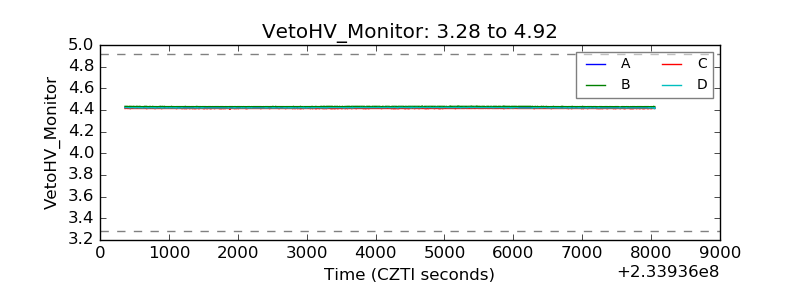 |
| Veto LLD | 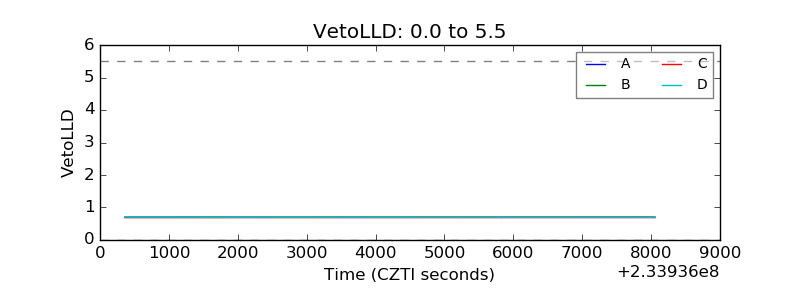 |
| Alpha Counter | 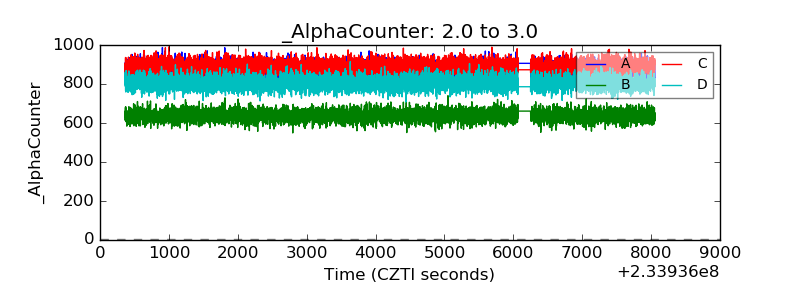 |
| _CPM_Rate | 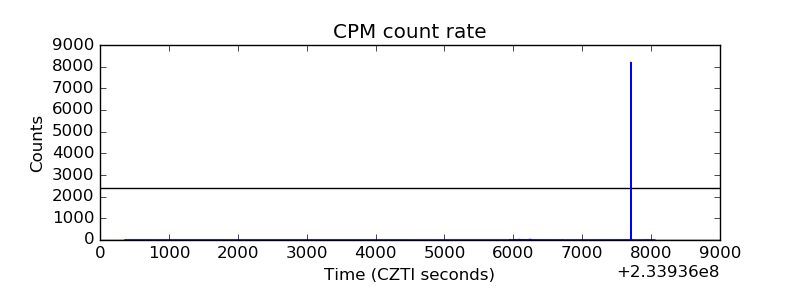 |
| CZT Counter | 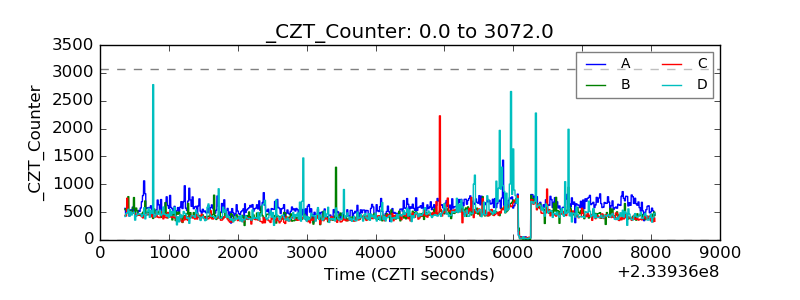 |
| +2.5 Volts monitor | 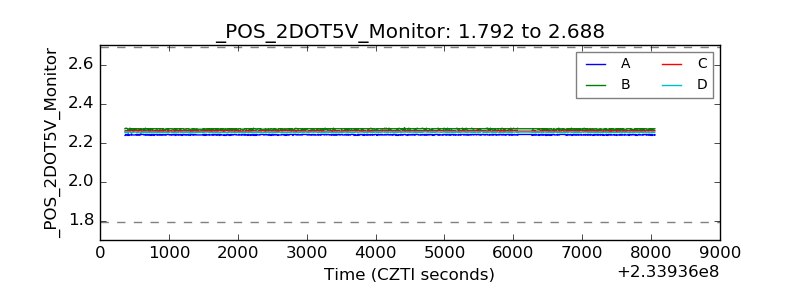 |
| +5 Volts monitor |  |
| _ROLL_ROT | 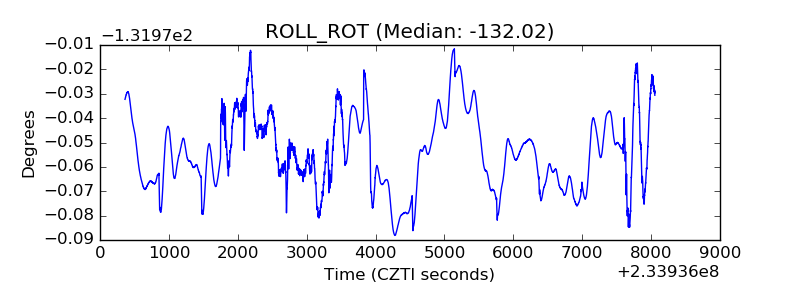 |
| _Roll_DEC | 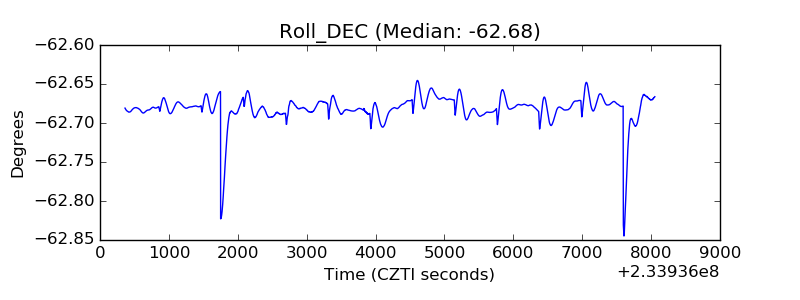 |
| _Roll_RA | 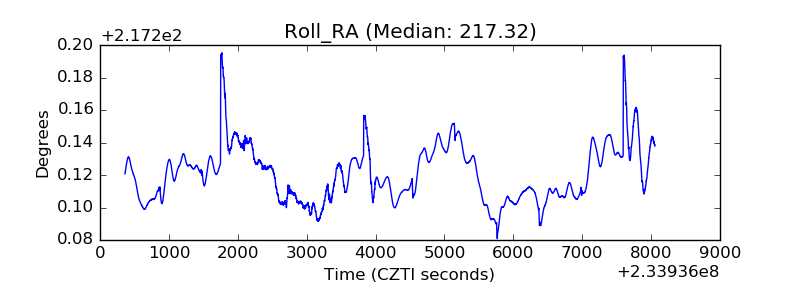 |
| Veto Counter | 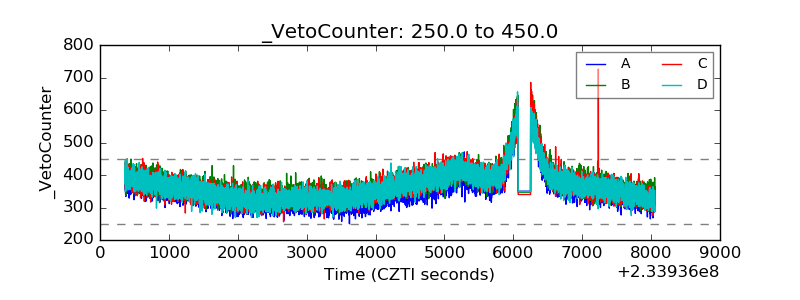 |