| Param | Original file | Final file |
|---|---|---|
| Filename | modeM0/AS1A03_046T01_9000001260_09052cztM0_level2.evt | modeM0/AS1A03_046T01_9000001260_09052cztM0_level2_quad_clean.evt |
| Size (bytes) | 345,893,760 | 66,464,640 |
| Size | 329.9 MB | 63.4 MB |
| Events in quadrant A | 3,049,721 | 418,416 |
| Events in quadrant B | 2,394,779 | 424,983 |
| Events in quadrant C | 2,214,268 | 414,957 |
| Events in quadrant D | 2,475,960 | 404,089 |
| Mode SS | |||
|---|---|---|---|
| Quadrant | BADHDUFLAG | Total packets | Discarded packets |
| A | 0 | 148 | 50 |
| B | 0 | 148 | 54 |
| C | 0 | 148 | 52 |
| D | 0 | 148 | 36 |
| Mode M9 | |||
|---|---|---|---|
| Quadrant | BADHDUFLAG | Total packets | Discarded packets |
| A | 0 | 4 | 1 |
| B | 0 | 4 | 1 |
| C | 0 | 4 | 1 |
| D | 0 | 4 | 1 |
| Mode M0 | |||
|---|---|---|---|
| Quadrant | BADHDUFLAG | Total packets | Discarded packets |
| A | 0 | 17914 | 5593 |
| B | 0 | 14946 | 4553 |
| C | 0 | 14624 | 4454 |
| D | 0 | 15782 | 4931 |
| Quadrant | Total seconds | Saturated seconds | Saturation percentage |
|---|---|---|---|
| A | 4899 | 124 | 2.531129% |
| B | 5027 | 25 | 0.497315% |
| C | 5016 | 9 | 0.179426% |
| D | 4953 | 51 | 1.029679% |
Noise dominated data is calculated using 1-second bins in cleaned event files. If a bin has >2000 counts, and if more than 50% of those come from <1% of pixels, then it is considered to be noise-dominated and hence unusable.
| Quadrant | # 1 sec bins | Bins with >0 counts | Bins with >2000 counts | High rate bins dominated by noise | Noise dominated (total time) | Noise dominated (detector-on time) | Marked lightcurve |
|---|---|---|---|---|---|---|---|
| A | 7644 | 5779 | 24 | 24 | 0.31% | 0.42% | 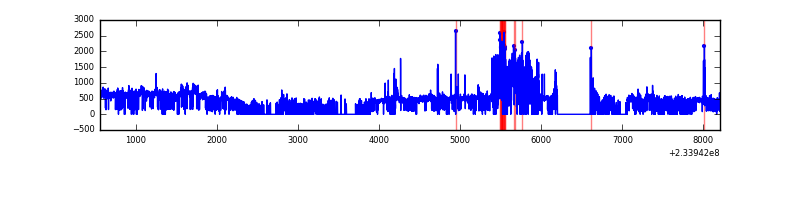 |
| B | 7644 | 5880 | 1 | 1 | 0.01% | 0.02% | 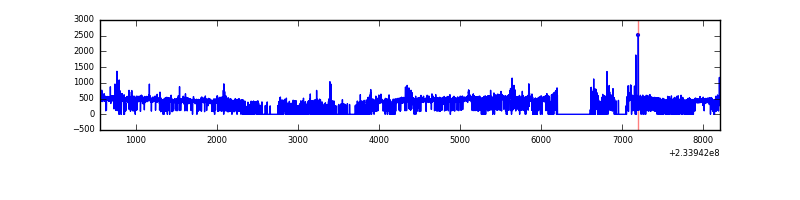 |
| C | 7644 | 5858 | 2 | 2 | 0.03% | 0.03% | 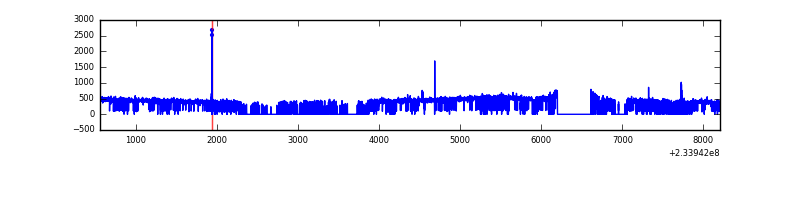 |
| D | 7644 | 5794 | 36 | 36 | 0.47% | 0.62% | 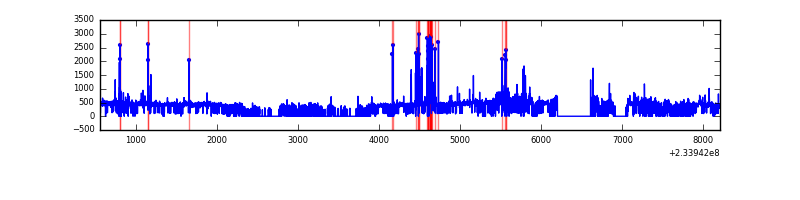 |
Top three noisy pixels from each quadrant. If the there are fewer than three noisy pixels in the level2.evt file, extra rows are filled as -1
| Pixel properties | Quadrant properties | ||||||
|---|---|---|---|---|---|---|---|
| Quadrant | DetID | PixID | Counts | Sigma | Mean | Median | Sigma |
| A | 8 | 5 | 739264 | 6351.74 | 565 | 553 | 116.3 |
| A | 15 | 174 | 40272 | 341.52 | 565 | 553 | 116.3 |
| A | 5 | 16 | 39184 | 332.17 | 565 | 553 | 116.3 |
| B | 0 | 198 | 30908 | 268.95 | 583 | 569 | 112.8 |
| B | 6 | 51 | 15847 | 135.44 | 583 | 569 | 112.8 |
| B | 0 | 214 | 14749 | 125.7 | 583 | 569 | 112.8 |
| C | 14 | 234 | 13210 | 97.07 | 560 | 561 | 130.3 |
| C | 8 | 128 | 8991 | 64.69 | 560 | 561 | 130.3 |
| C | 8 | 112 | 4438 | 29.75 | 560 | 561 | 130.3 |
| D | 2 | 14 | 218455 | 1507.58 | 552 | 535 | 144.5 |
| D | 1 | 52 | 56153 | 384.77 | 552 | 535 | 144.5 |
| D | 6 | 225 | 45045 | 307.92 | 552 | 535 | 144.5 |
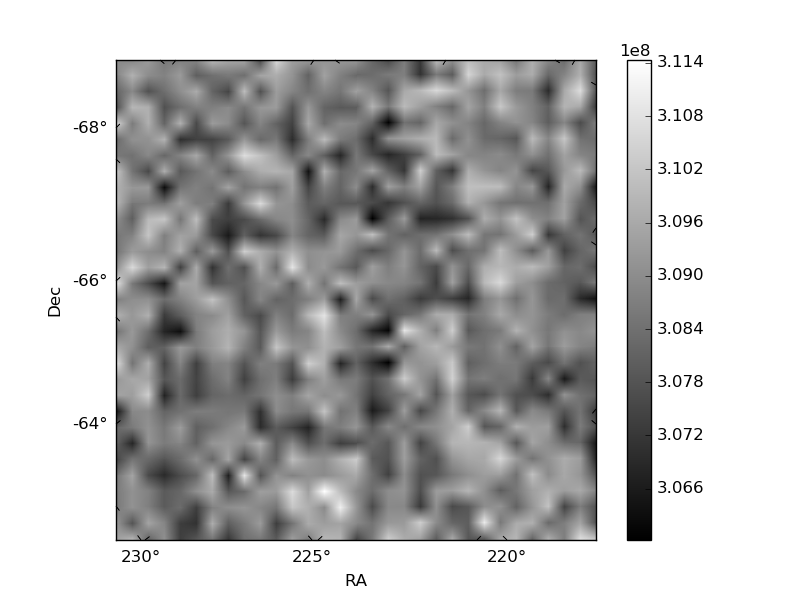
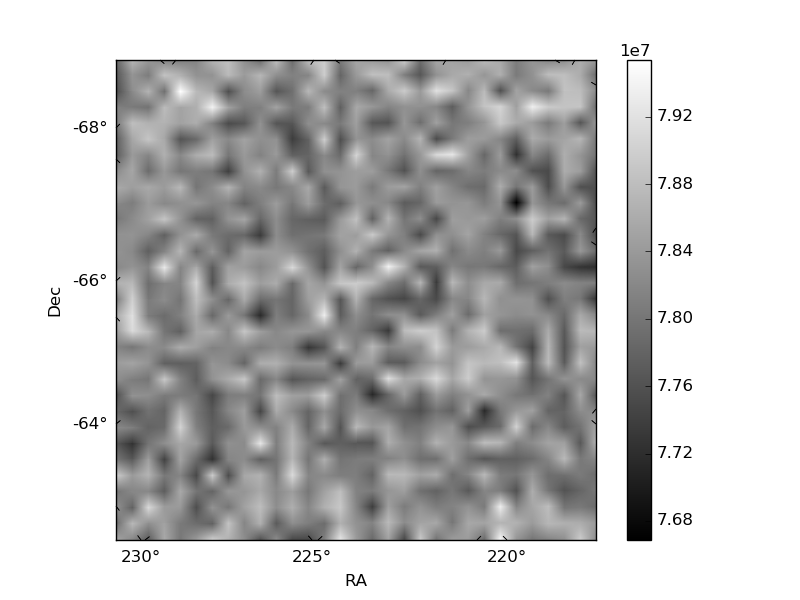
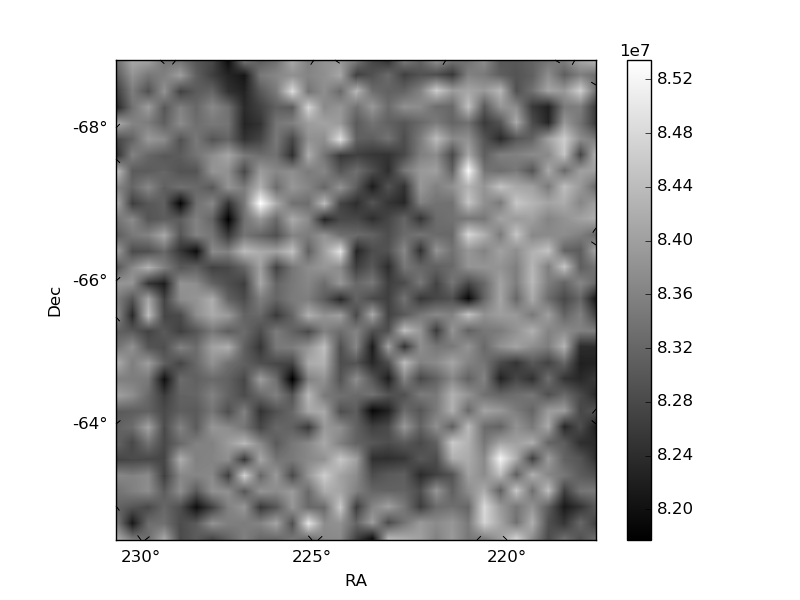
Histogram calculated using DETX and DETY for each event in the final _common_clean file
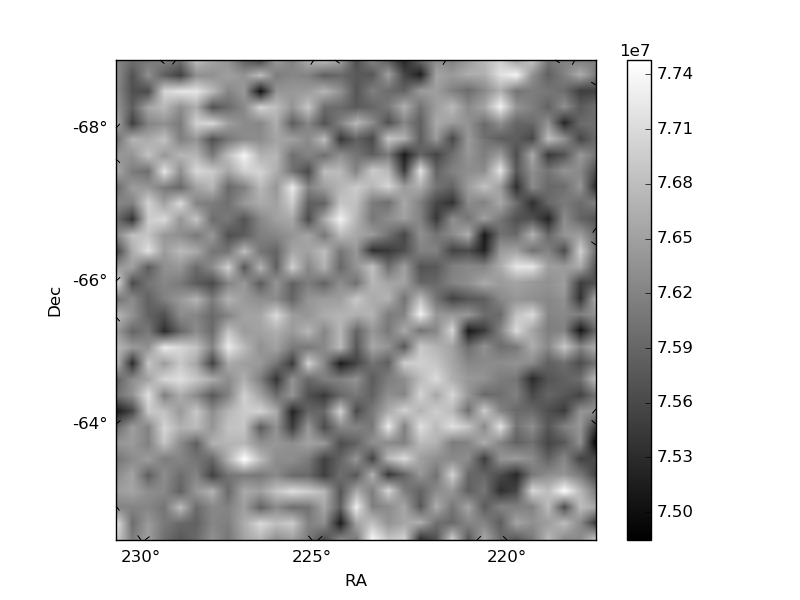
| Quadrant A | 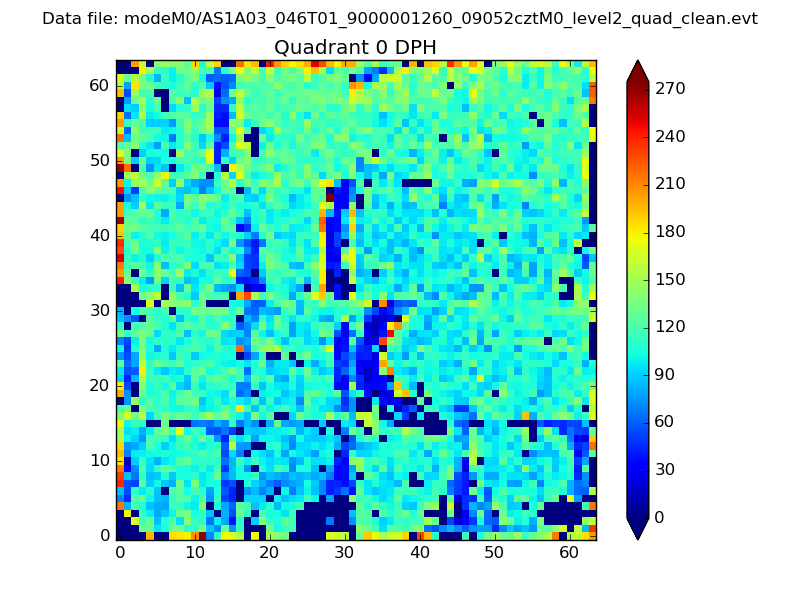 |
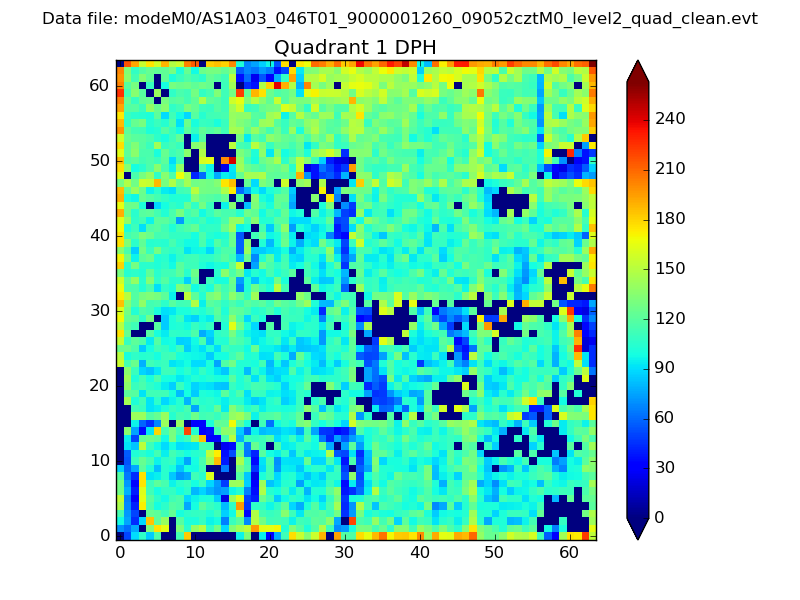 |
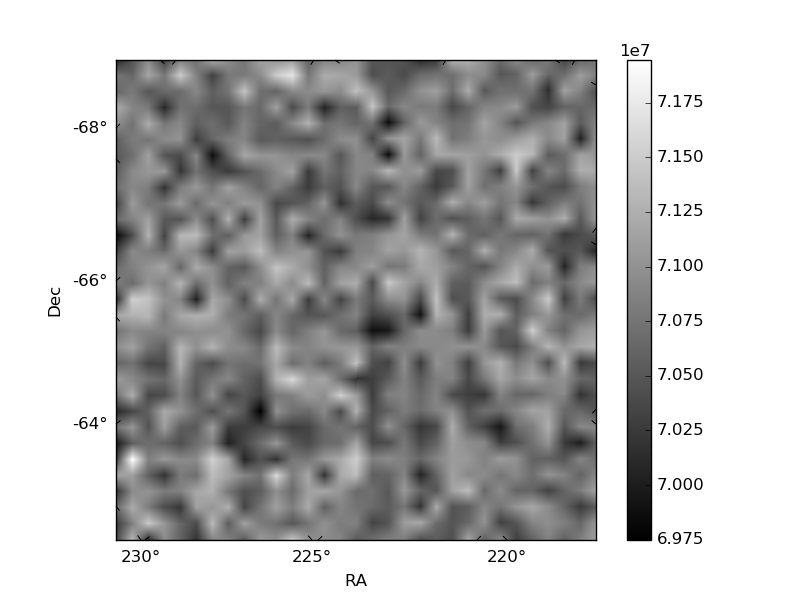
Quadrant B |
|---|---|---|---|
| Quadrant D | 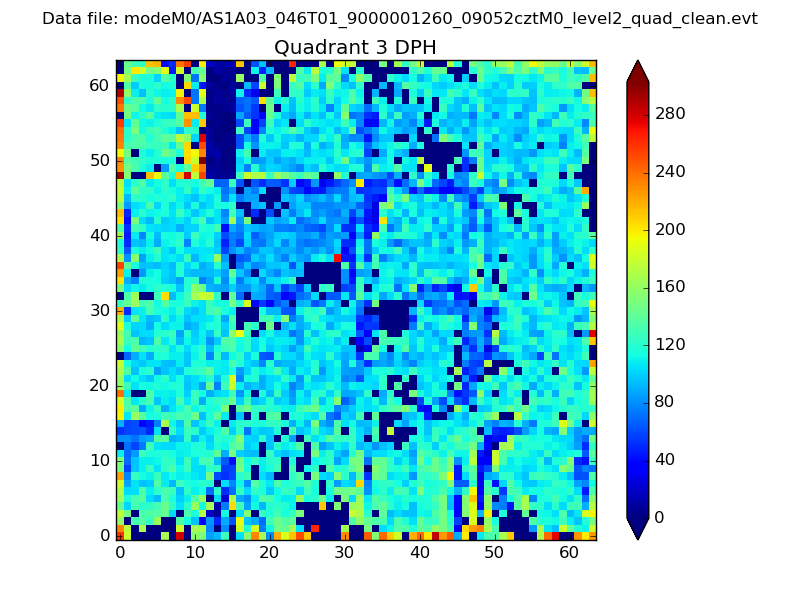 |
 |
Quadrant C |
| Plot type | Count rate plots | Images |
|---|---|---|
| Comparison with Poisson distribution Blue bars denote a histogram of data divided into 1 sec bins. Red curve is a Poisson curve with rate = median count rate of data. |
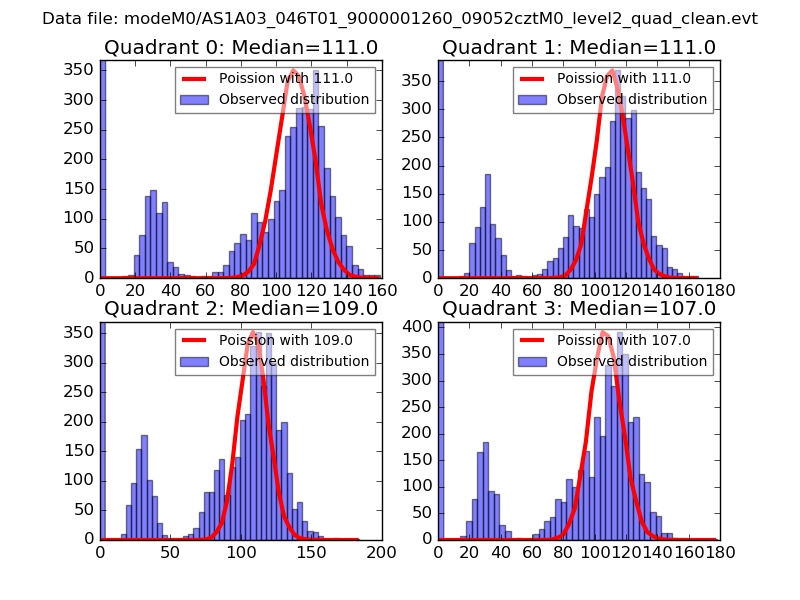 |
 |
| Quadrant-wise count rates Data is divided into 100 sec bins |
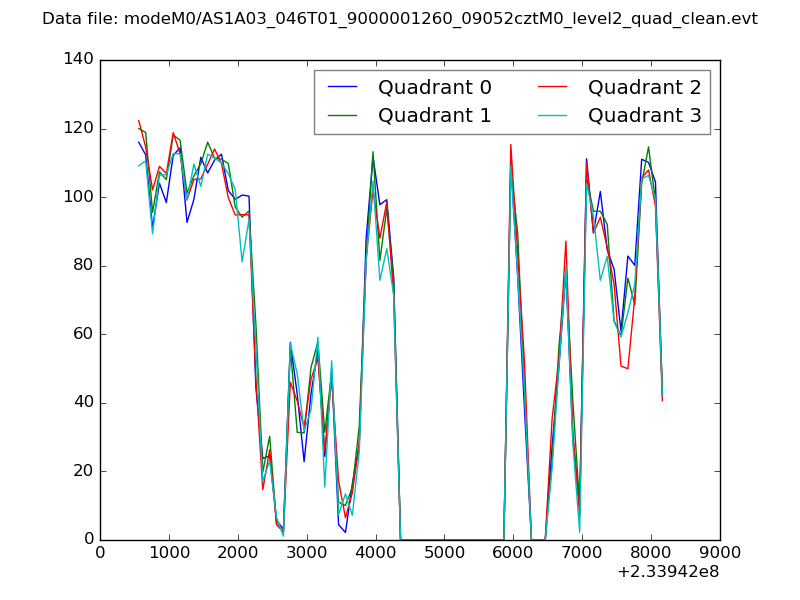 |
|
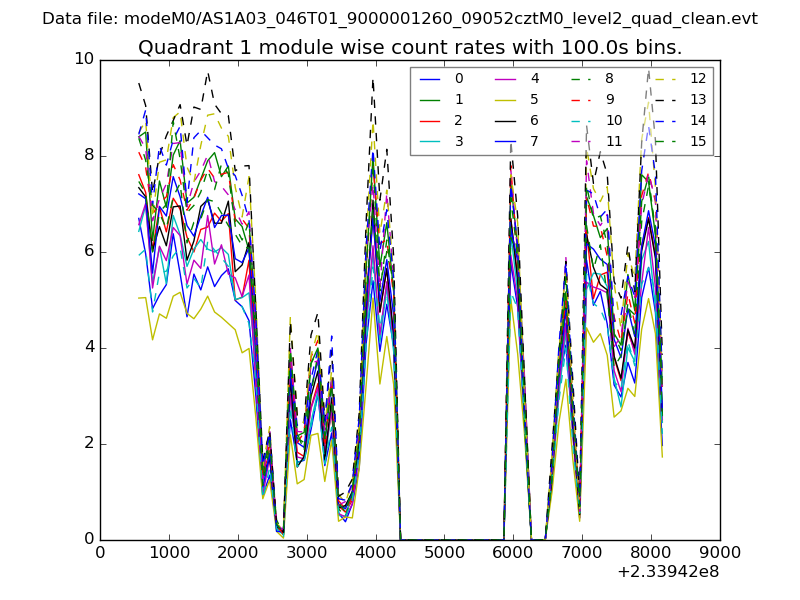
| Module-wise count rates for Quadrant A Data is divided into 100 sec bins |
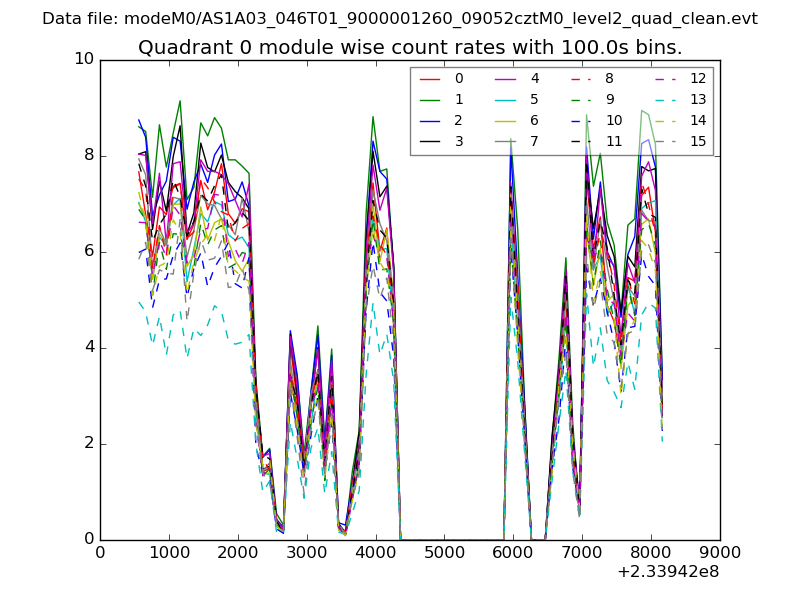 |
 |
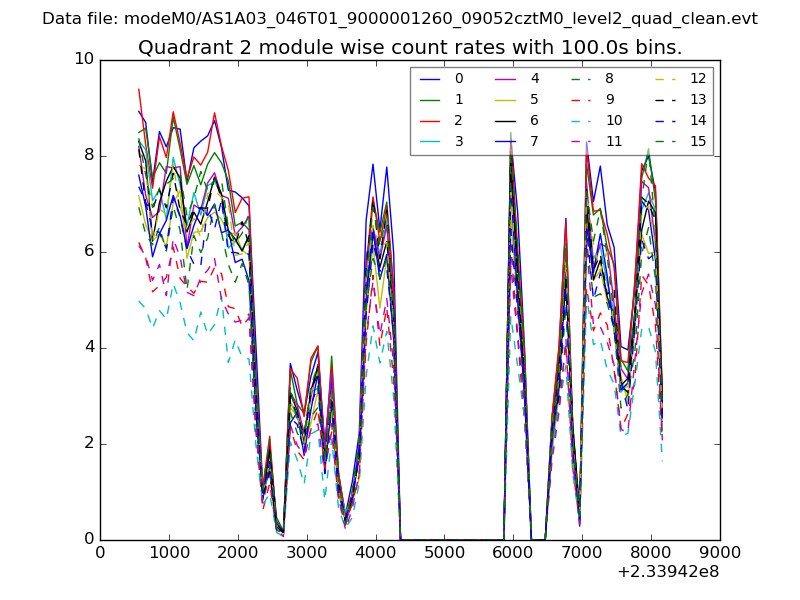
| Module-wise count rates for Quadrant B Data is divided into 100 sec bins |
 |
 |
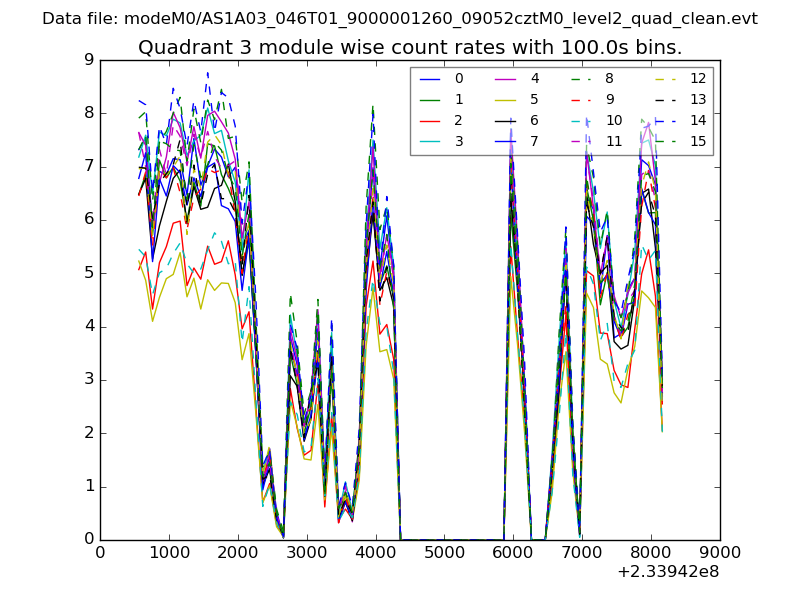
| Module-wise count rates for Quadrant C Data is divided into 100 sec bins |
 |
 |
| Module-wise count rates for Quadrant D Data is divided into 100 sec bins |
 |
 |
| Parameter | Plot |
|---|---|
| CZT HV Monitor | 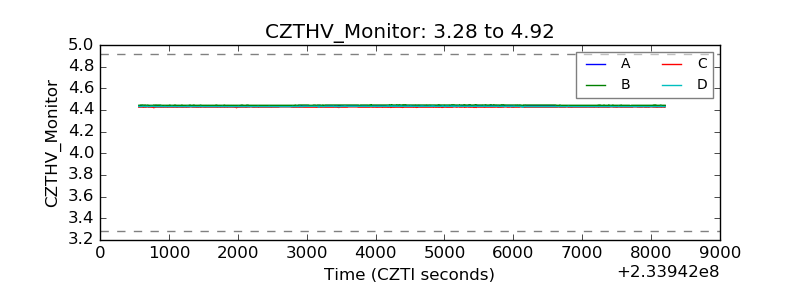 |
| D_VDD | 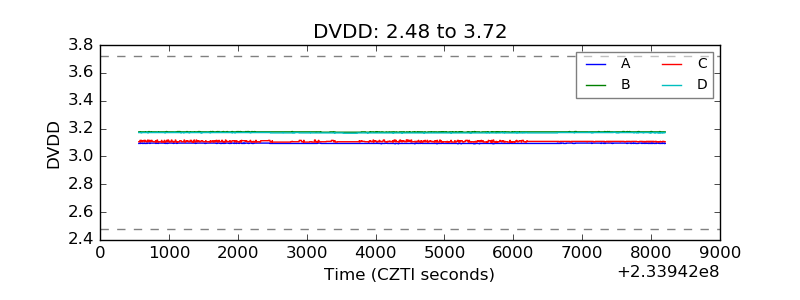 |
| Temperature 1 | 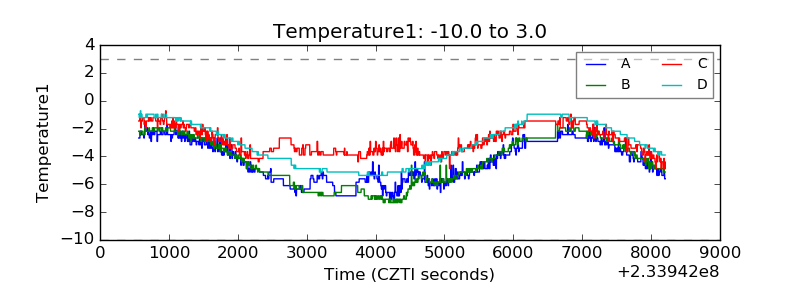 |
| Veto HV Monitor | 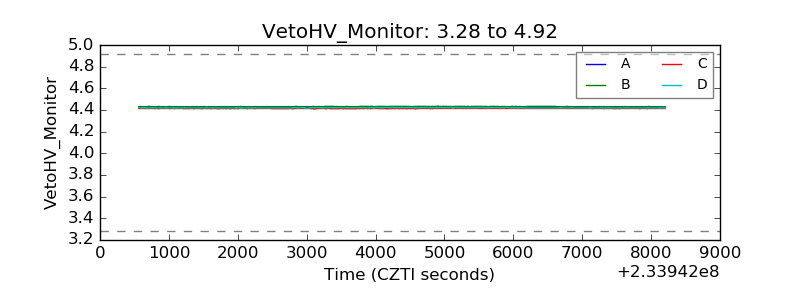 |
| Veto LLD | 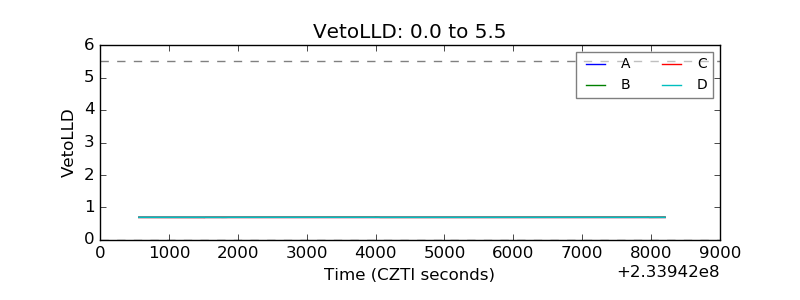 |
| Alpha Counter | 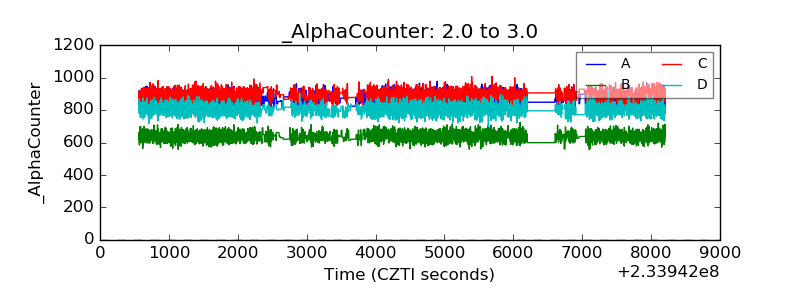 |
| _CPM_Rate | 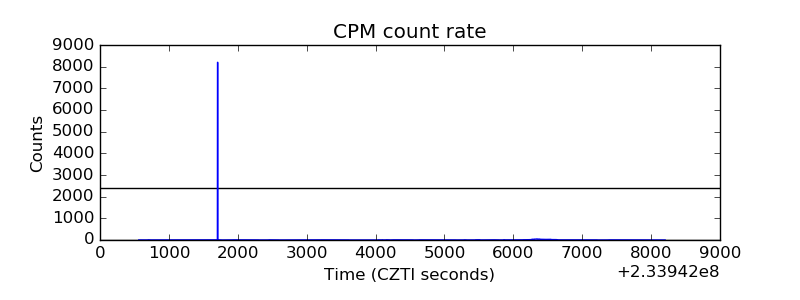 |
| CZT Counter |  |
| +2.5 Volts monitor |  |
| +5 Volts monitor |  |
| _ROLL_ROT | 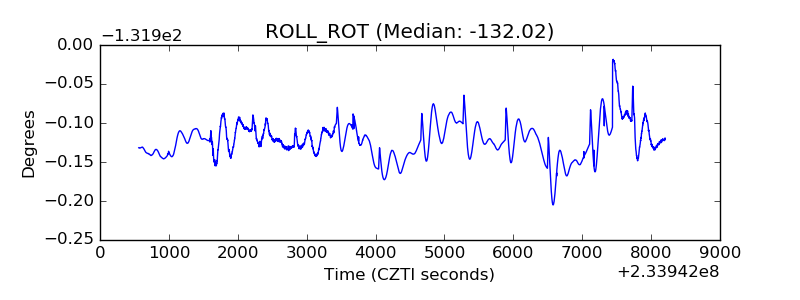 |
| _Roll_DEC | 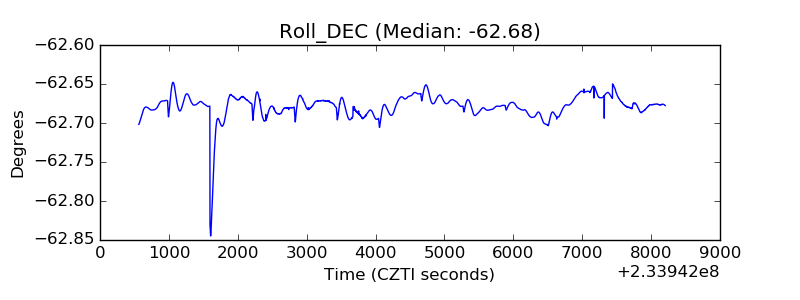 |
| _Roll_RA | 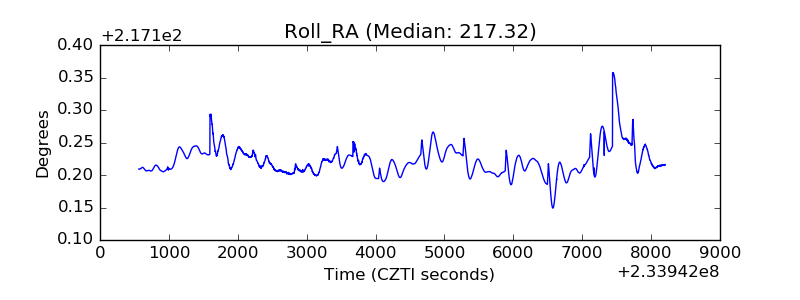 |
| Veto Counter | 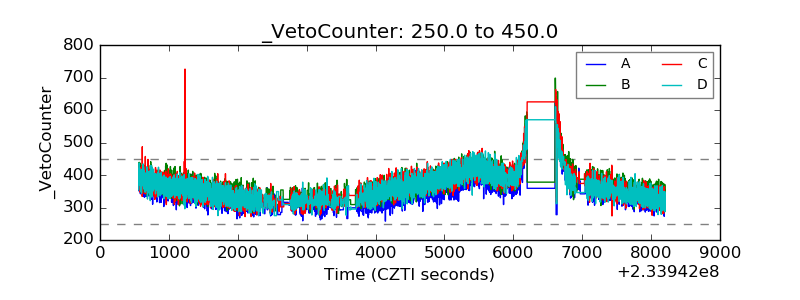 |