| Param | Original file | Final file |
|---|---|---|
| Filename | modeM0/AS1A03_046T01_9000001260_09054cztM0_level2.evt | modeM0/AS1A03_046T01_9000001260_09054cztM0_level2_quad_clean.evt |
| Size (bytes) | 828,650,880 | 168,151,680 |
| Size | 790.3 MB | 160.4 MB |
| Events in quadrant A | 7,460,229 | 1,068,750 |
| Events in quadrant B | 5,630,048 | 1,084,886 |
| Events in quadrant C | 5,288,411 | 1,052,537 |
| Events in quadrant D | 5,889,051 | 1,041,978 |
| Mode SS | |||
|---|---|---|---|
| Quadrant | BADHDUFLAG | Total packets | Discarded packets |
| A | 0 | 254 | 0 |
| B | 0 | 254 | 0 |
| C | 0 | 254 | 2 |
| D | 0 | 254 | 6 |
| Mode M9 | |||
|---|---|---|---|
| Quadrant | BADHDUFLAG | Total packets | Discarded packets |
| A | 0 | 14 | 0 |
| B | 0 | 14 | 0 |
| C | 0 | 14 | 0 |
| D | 0 | 14 | 0 |
| Mode M0 | |||
|---|---|---|---|
| Quadrant | BADHDUFLAG | Total packets | Discarded packets |
| A | 0 | 31307 | 1151 |
| B | 0 | 25837 | 650 |
| C | 0 | 25557 | 737 |
| D | 0 | 27654 | 1244 |
| Quadrant | Total seconds | Saturated seconds | Saturation percentage |
|---|---|---|---|
| A | 12173 | 351 | 2.883431% |
| B | 12245 | 45 | 0.367497% |
| C | 12216 | 30 | 0.245580% |
| D | 12158 | 138 | 1.135055% |
Noise dominated data is calculated using 1-second bins in cleaned event files. If a bin has >2000 counts, and if more than 50% of those come from <1% of pixels, then it is considered to be noise-dominated and hence unusable.
| Quadrant | # 1 sec bins | Bins with >0 counts | Bins with >2000 counts | High rate bins dominated by noise | Noise dominated (total time) | Noise dominated (detector-on time) | Marked lightcurve |
|---|---|---|---|---|---|---|---|
| A | 13938 | 12499 | 418 | 418 | 3.00% | 3.34% | 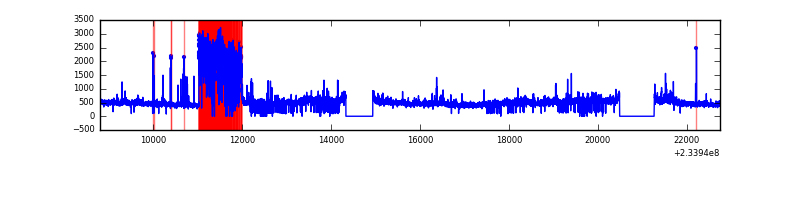 |
| B | 13938 | 12513 | 12 | 12 | 0.09% | 0.10% | 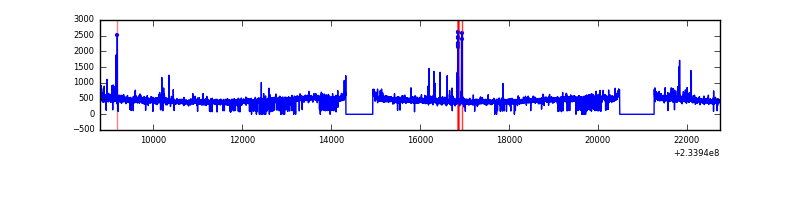 |
| C | 13938 | 12522 | 17 | 17 | 0.12% | 0.14% | 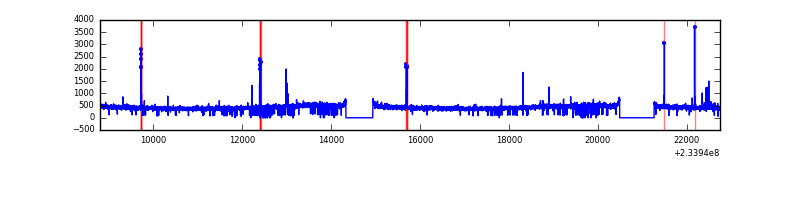 |
| D | 13938 | 12472 | 99 | 99 | 0.71% | 0.79% | 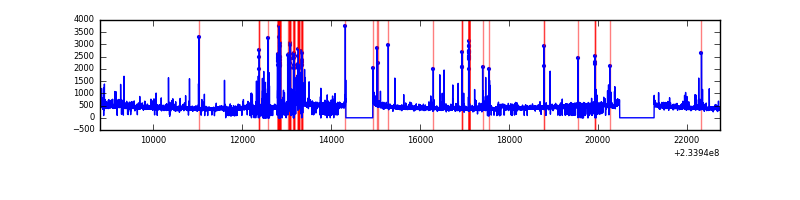 |
Top three noisy pixels from each quadrant. If the there are fewer than three noisy pixels in the level2.evt file, extra rows are filled as -1
| Pixel properties | Quadrant properties | ||||||
|---|---|---|---|---|---|---|---|
| Quadrant | DetID | PixID | Counts | Sigma | Mean | Median | Sigma |
| A | 8 | 5 | 2079832 | 7435.13 | 1372 | 1343 | 279.5 |
| A | 5 | 16 | 52406 | 182.66 | 1372 | 1343 | 279.5 |
| A | 1 | 162 | 34834 | 119.8 | 1372 | 1343 | 279.5 |
| B | 4 | 80 | 44659 | 162.67 | 1393 | 1357 | 266.2 |
| B | 0 | 213 | 33423 | 120.46 | 1393 | 1357 | 266.2 |
| B | 0 | 229 | 30267 | 108.61 | 1393 | 1357 | 266.2 |
| C | 14 | 234 | 95010 | 304.56 | 1331 | 1336 | 307.6 |
| C | 13 | 61 | 10319 | 29.2 | 1331 | 1336 | 307.6 |
| C | 8 | 222 | 3731 | 7.79 | 1331 | 1336 | 307.6 |
| D | 2 | 14 | 541489 | 1560.98 | 1315 | 1279 | 346.1 |
| D | 1 | 52 | 122281 | 349.65 | 1315 | 1279 | 346.1 |
| D | 6 | 225 | 79579 | 226.25 | 1315 | 1279 | 346.1 |
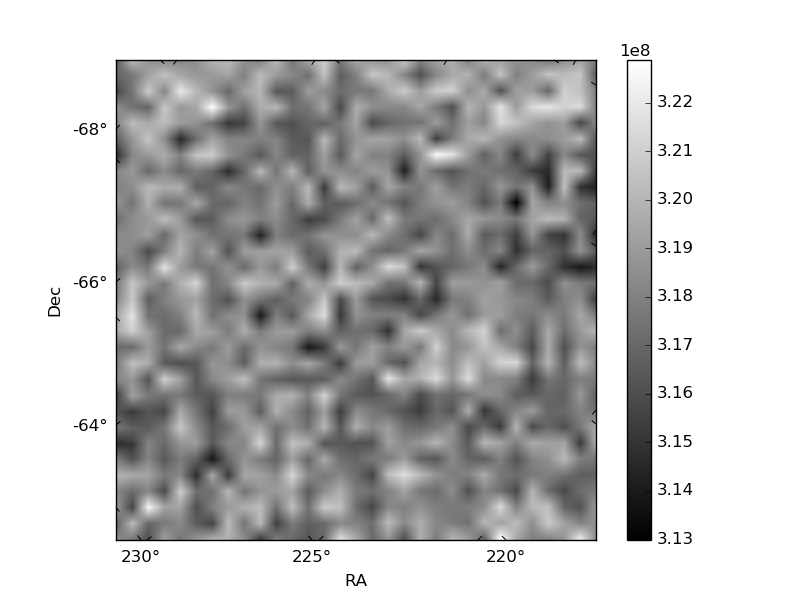
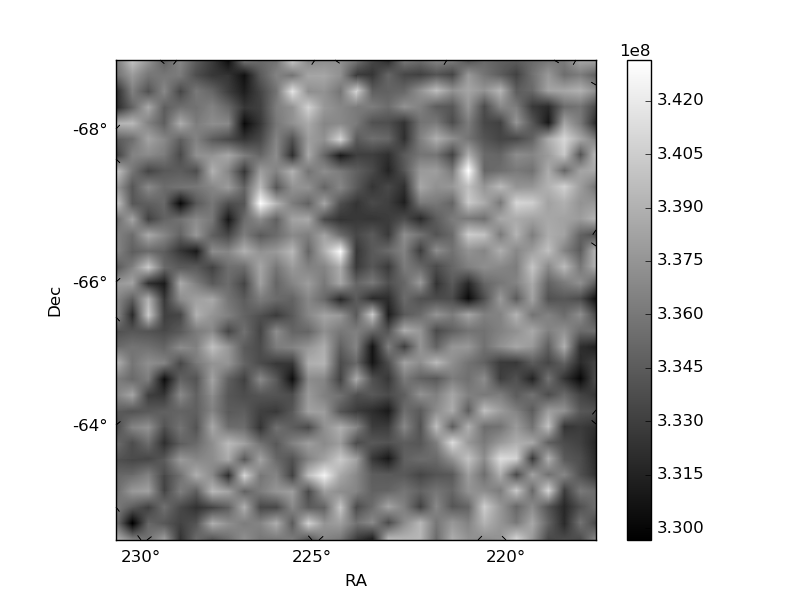
Histogram calculated using DETX and DETY for each event in the final _common_clean file
| Quadrant A |  |
 |
Quadrant B |
|---|---|---|---|
| Quadrant D | 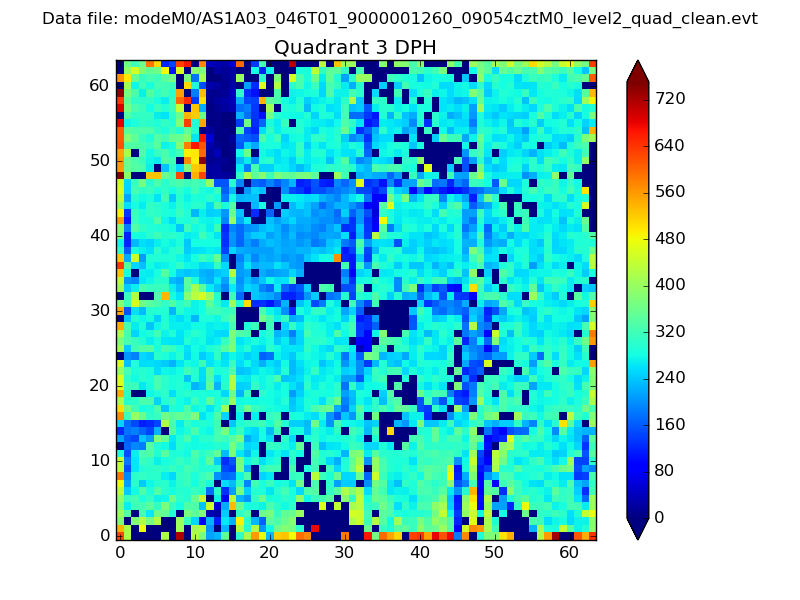 |
 |
Quadrant C |
| Plot type | Count rate plots | Images |
|---|---|---|
| Comparison with Poisson distribution Blue bars denote a histogram of data divided into 1 sec bins. Red curve is a Poisson curve with rate = median count rate of data. |
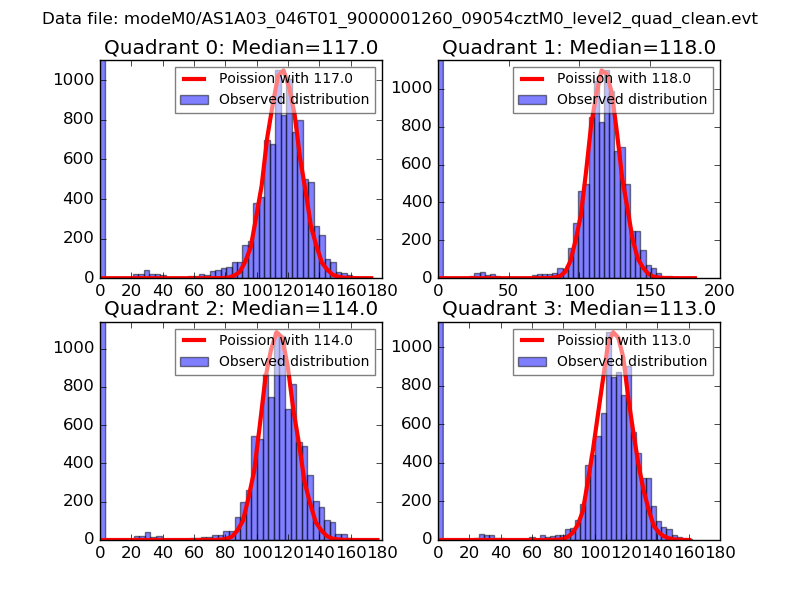 |
 |
| Quadrant-wise count rates Data is divided into 100 sec bins |
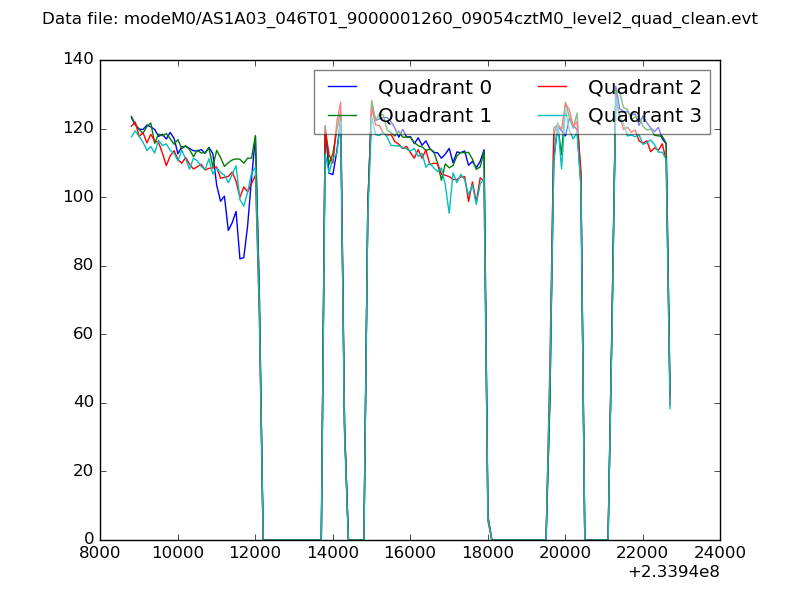 |
|
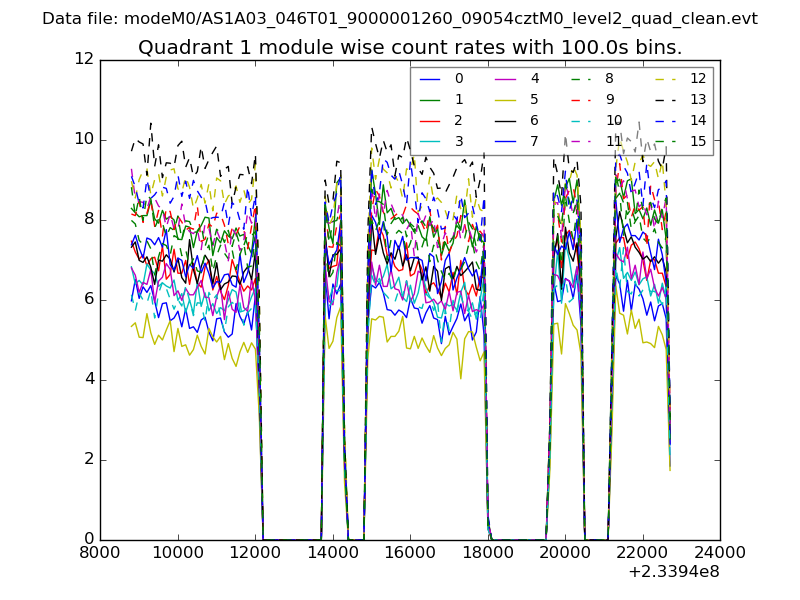
| Module-wise count rates for Quadrant A Data is divided into 100 sec bins |
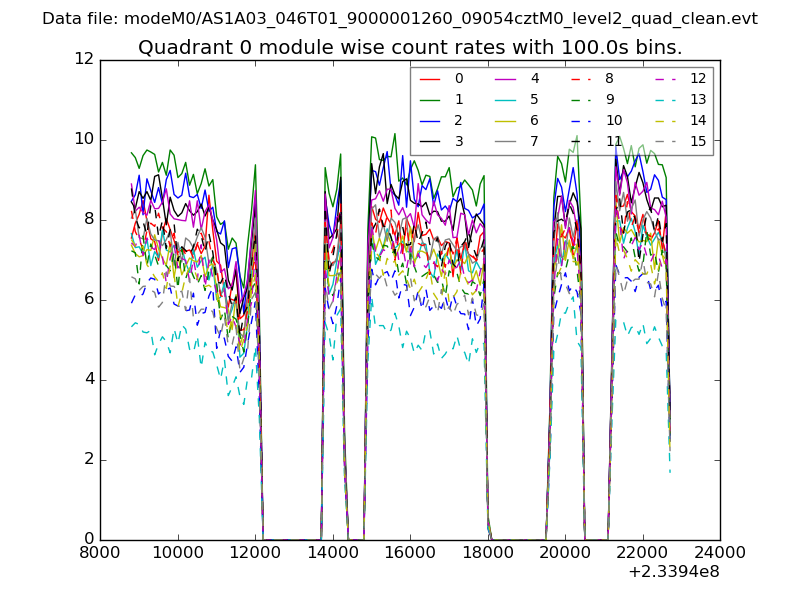 |
 |
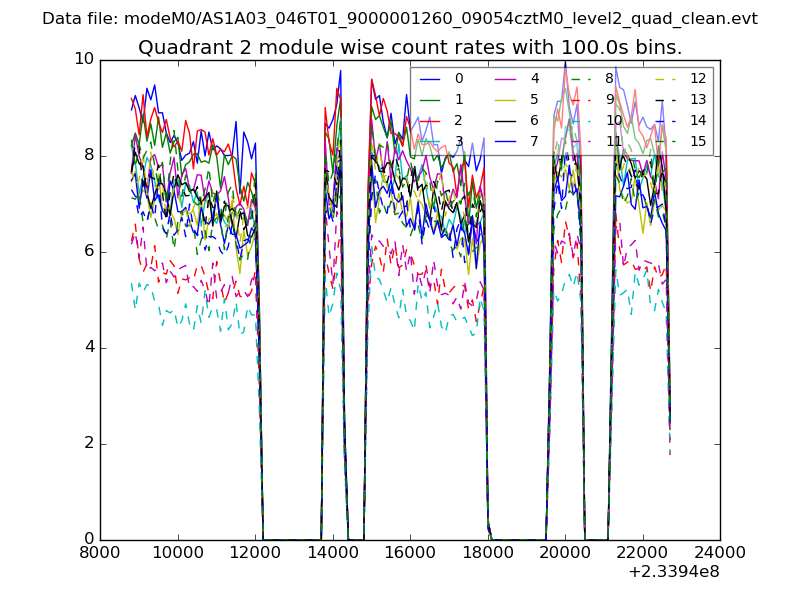
| Module-wise count rates for Quadrant B Data is divided into 100 sec bins |
 |
 |
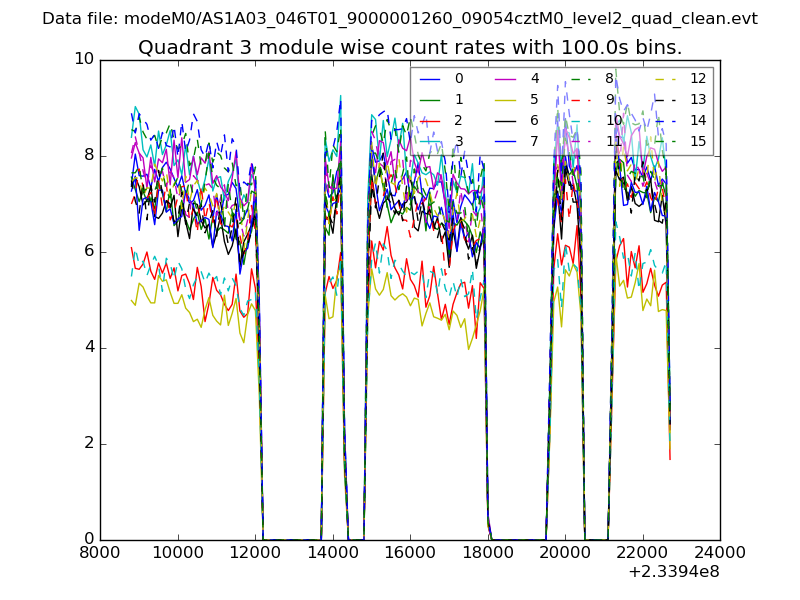
| Module-wise count rates for Quadrant C Data is divided into 100 sec bins |
 |
 |
| Module-wise count rates for Quadrant D Data is divided into 100 sec bins |
 |
 |
| Parameter | Plot |
|---|---|
| CZT HV Monitor | 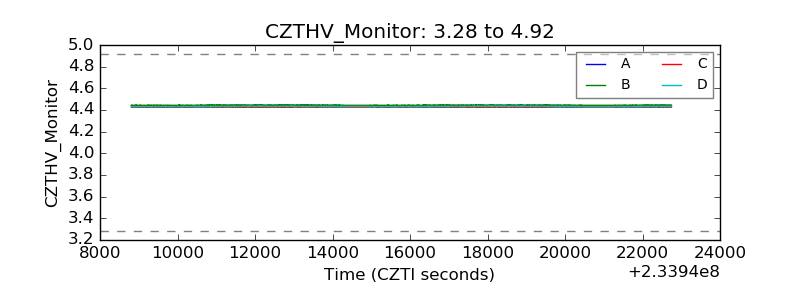 |
| D_VDD | 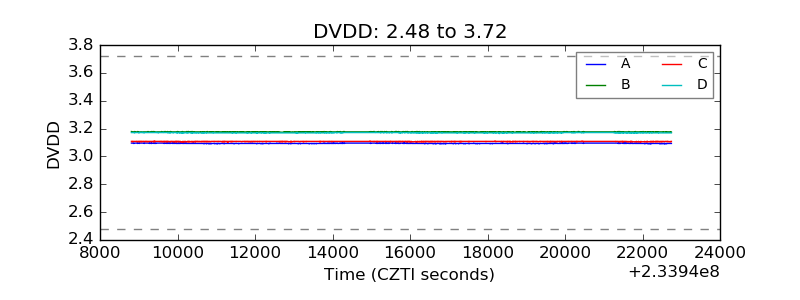 |
| Temperature 1 | 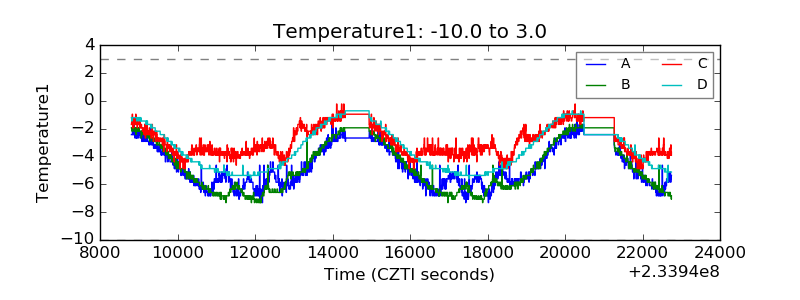 |
| Veto HV Monitor | 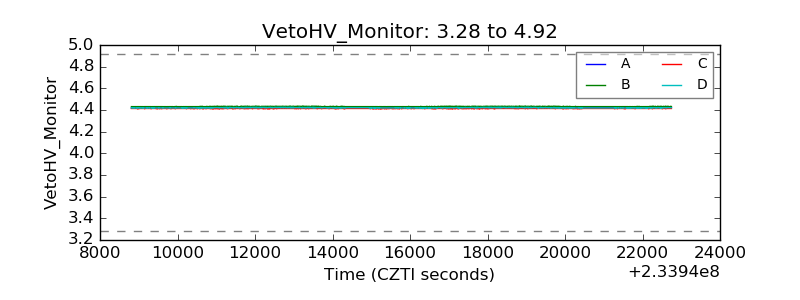 |
| Veto LLD | 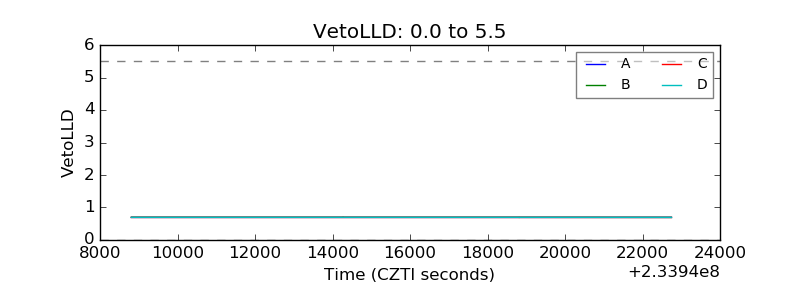 |
| Alpha Counter | 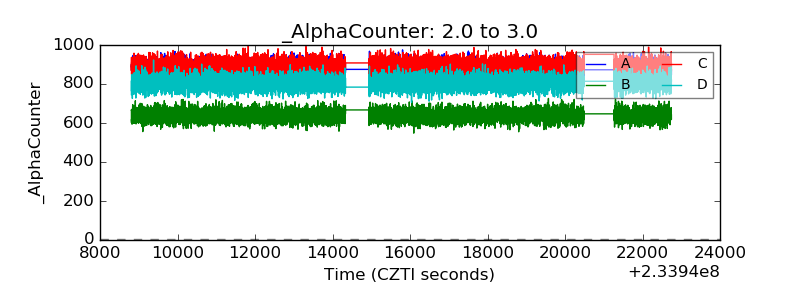 |
| _CPM_Rate | 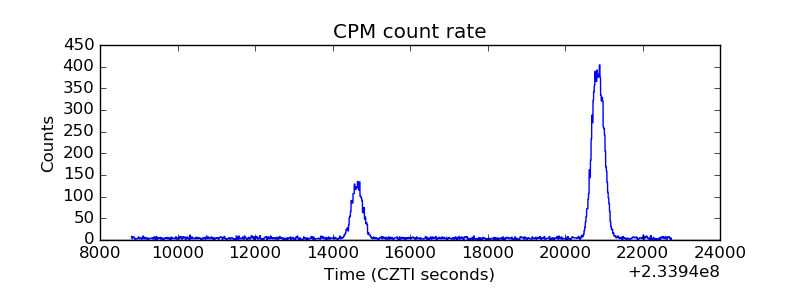 |
| CZT Counter |  |
| +2.5 Volts monitor |  |
| +5 Volts monitor |  |
| _ROLL_ROT | 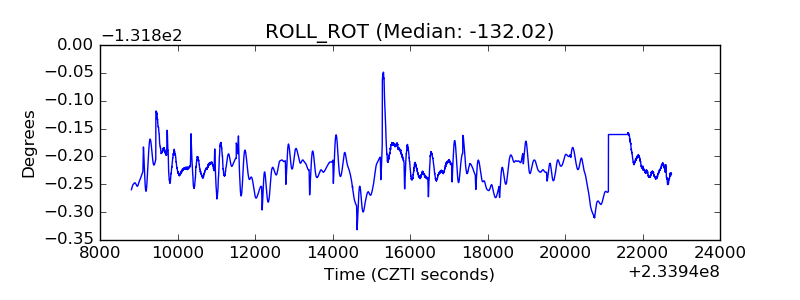 |
| _Roll_DEC | 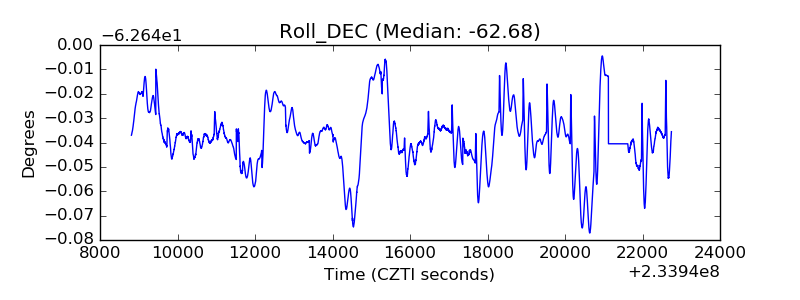 |
| _Roll_RA | 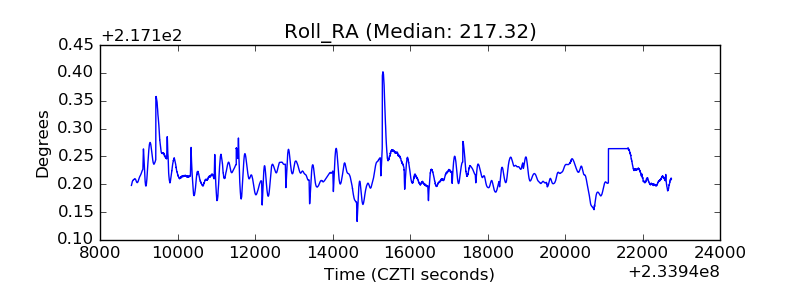 |
| Veto Counter | 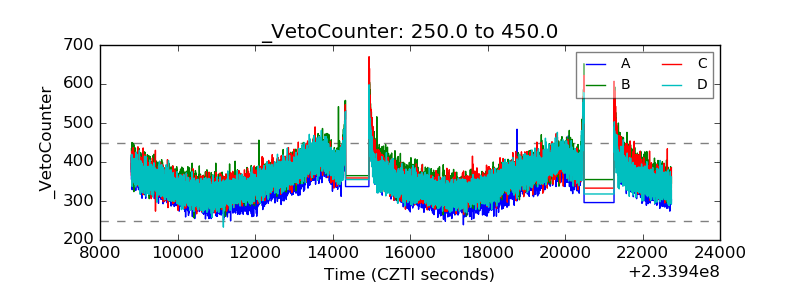 |