| Param | Original file | Final file |
|---|---|---|
| Filename | modeM0/AS1A03_046T01_9000001260_09055cztM0_level2.evt | modeM0/AS1A03_046T01_9000001260_09055cztM0_level2_quad_clean.evt |
| Size (bytes) | 1,552,253,760 | 302,158,080 |
| Size | 1.4 GB | 288.2 MB |
| Events in quadrant A | 13,671,256 | 1,921,359 |
| Events in quadrant B | 10,577,858 | 1,932,914 |
| Events in quadrant C | 9,907,782 | 1,877,773 |
| Events in quadrant D | 11,314,474 | 1,853,063 |
| Mode SS | |||
|---|---|---|---|
| Quadrant | BADHDUFLAG | Total packets | Discarded packets |
| A | 0 | 464 | 0 |
| B | 0 | 464 | 0 |
| C | 0 | 464 | 0 |
| D | 0 | 464 | 0 |
| Mode M9 | |||
|---|---|---|---|
| Quadrant | BADHDUFLAG | Total packets | Discarded packets |
| A | 0 | 27 | 0 |
| B | 0 | 27 | 0 |
| C | 0 | 27 | 0 |
| D | 0 | 27 | 0 |
| Mode M0 | |||
|---|---|---|---|
| Quadrant | BADHDUFLAG | Total packets | Discarded packets |
| A | 0 | 55712 | 25 |
| B | 0 | 47206 | 25 |
| C | 0 | 46316 | 34 |
| D | 0 | 50449 | 37 |
| Quadrant | Total seconds | Saturated seconds | Saturation percentage |
|---|---|---|---|
| A | 22767 | 589 | 2.587078% |
| B | 22767 | 103 | 0.452409% |
| C | 22759 | 62 | 0.272420% |
| D | 22761 | 334 | 1.467422% |
Noise dominated data is calculated using 1-second bins in cleaned event files. If a bin has >2000 counts, and if more than 50% of those come from <1% of pixels, then it is considered to be noise-dominated and hence unusable.
| Quadrant | # 1 sec bins | Bins with >0 counts | Bins with >2000 counts | High rate bins dominated by noise | Noise dominated (total time) | Noise dominated (detector-on time) | Marked lightcurve |
|---|---|---|---|---|---|---|---|
| A | 25528 | 22776 | 527 | 527 | 2.06% | 2.31% |  |
| B | 25529 | 22779 | 18 | 18 | 0.07% | 0.08% |  |
| C | 25529 | 22779 | 36 | 36 | 0.14% | 0.16% | 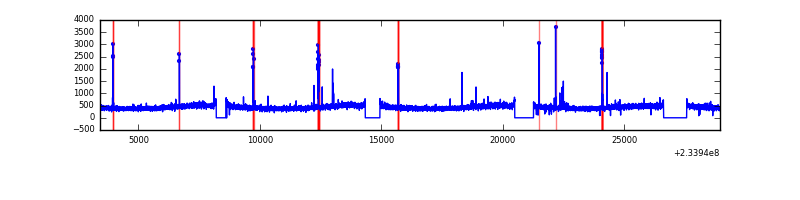 |
| D | 25529 | 22778 | 255 | 255 | 1.00% | 1.12% | 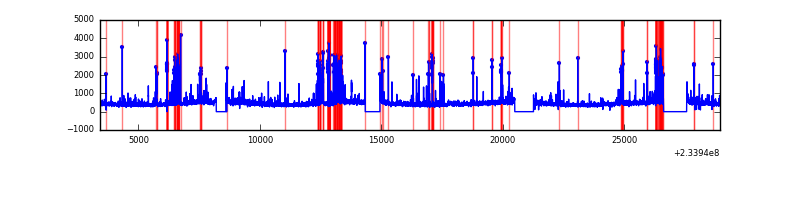 |
Top three noisy pixels from each quadrant. If the there are fewer than three noisy pixels in the level2.evt file, extra rows are filled as -1
| Pixel properties | Quadrant properties | ||||||
|---|---|---|---|---|---|---|---|
| Quadrant | DetID | PixID | Counts | Sigma | Mean | Median | Sigma |
| A | 8 | 5 | 3338232 | 6440.36 | 2570 | 2518 | 517.9 |
| A | 15 | 239 | 173284 | 329.7 | 2570 | 2518 | 517.9 |
| A | 5 | 16 | 130487 | 247.07 | 2570 | 2518 | 517.9 |
| B | 4 | 80 | 72314 | 141.83 | 2596 | 2535 | 492.0 |
| B | 6 | 51 | 59475 | 115.73 | 2596 | 2535 | 492.0 |
| B | 12 | 111 | 53433 | 103.45 | 2596 | 2535 | 492.0 |
| C | 14 | 234 | 163284 | 280.09 | 2493 | 2504 | 574.0 |
| C | 13 | 61 | 19050 | 28.82 | 2493 | 2504 | 574.0 |
| C | 8 | 128 | 12179 | 16.85 | 2493 | 2504 | 574.0 |
| D | 2 | 14 | 1103007 | 1726.6 | 2475 | 2410 | 637.4 |
| D | 1 | 52 | 399537 | 623.01 | 2475 | 2410 | 637.4 |
| D | 6 | 225 | 105487 | 161.71 | 2475 | 2410 | 637.4 |
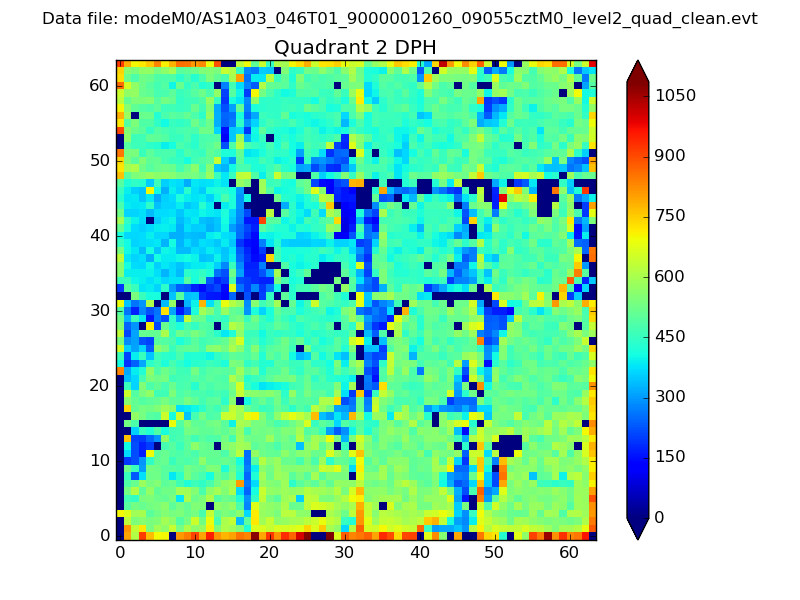
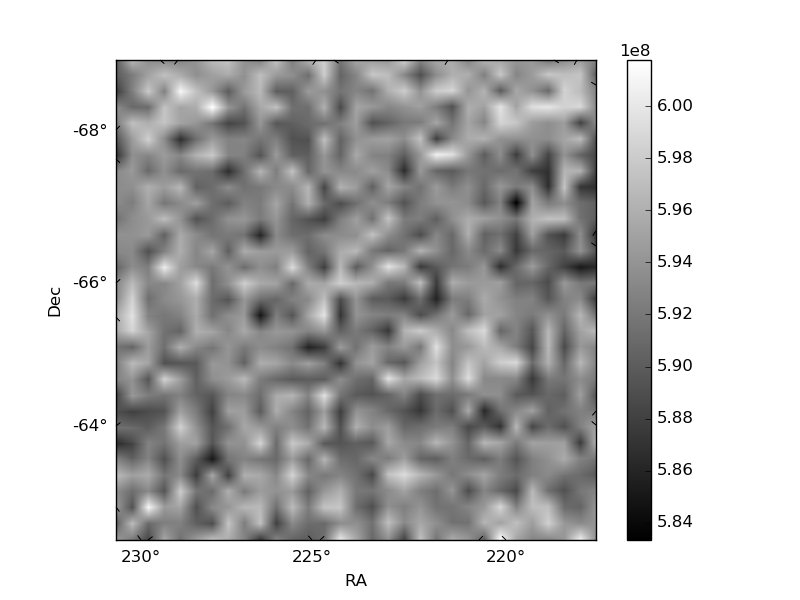
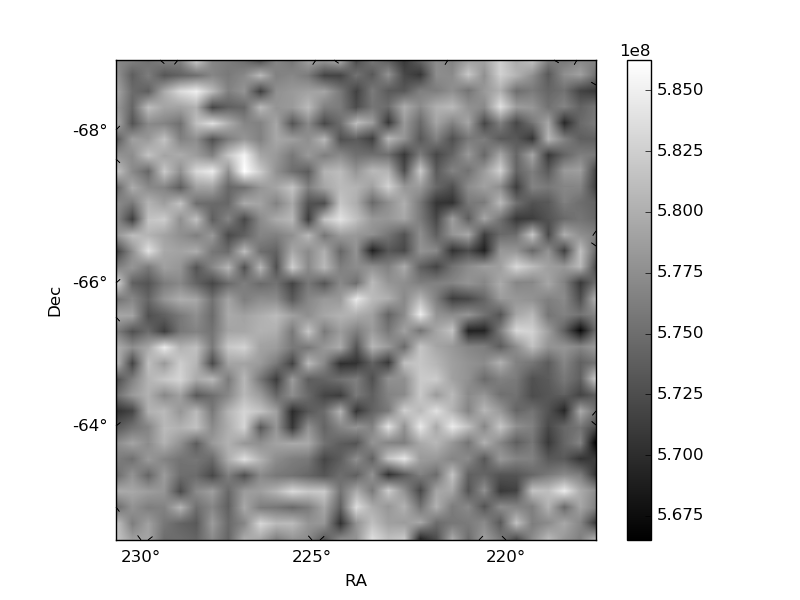
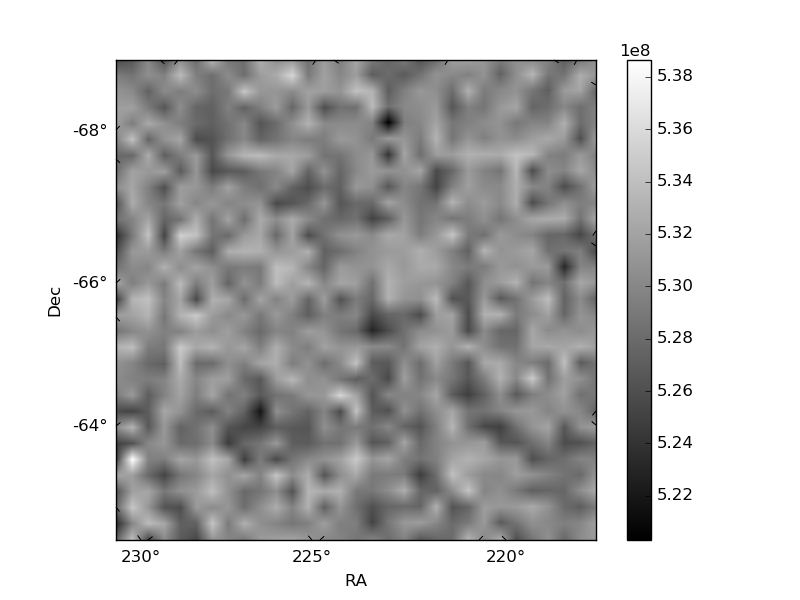
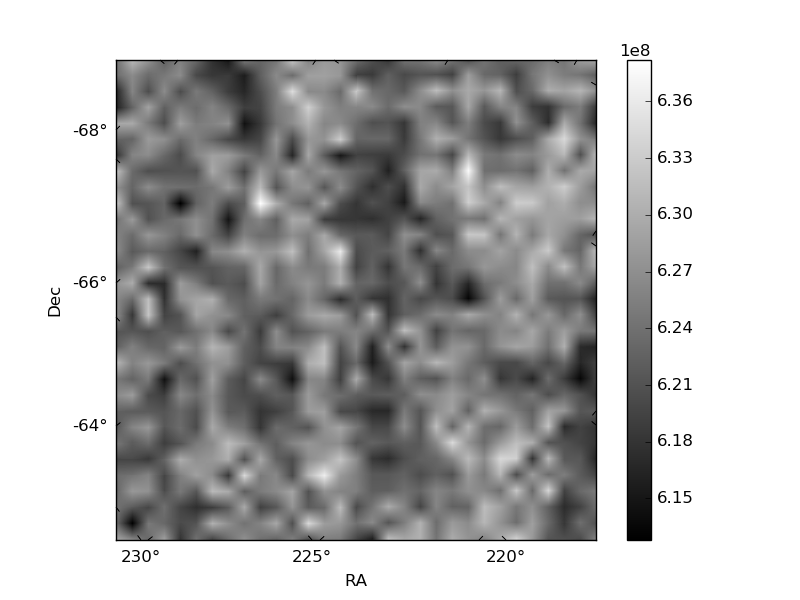
Histogram calculated using DETX and DETY for each event in the final _common_clean file
| Quadrant A | 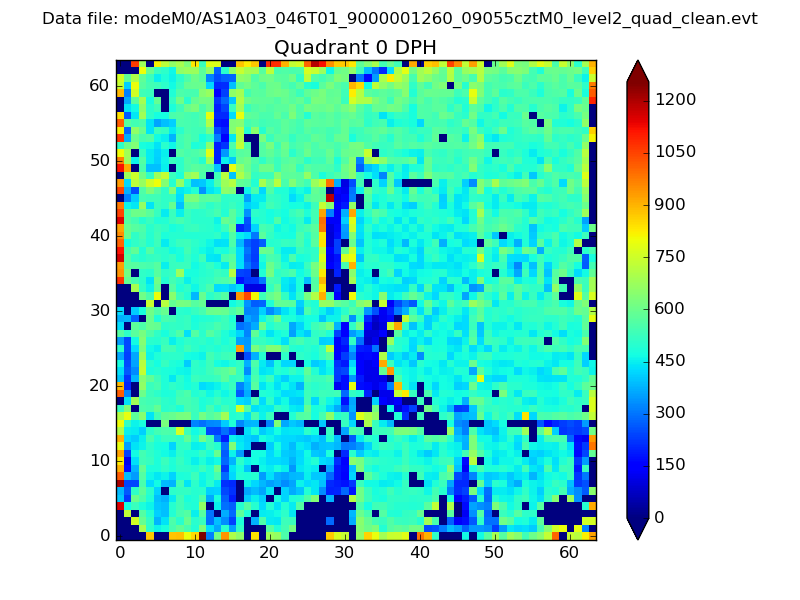 |
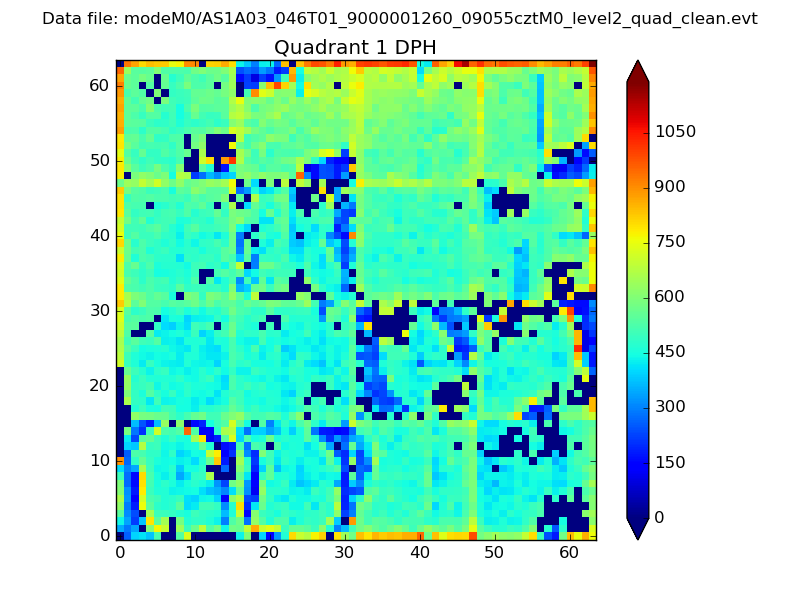 |
Quadrant B |
|---|---|---|---|
| Quadrant D | 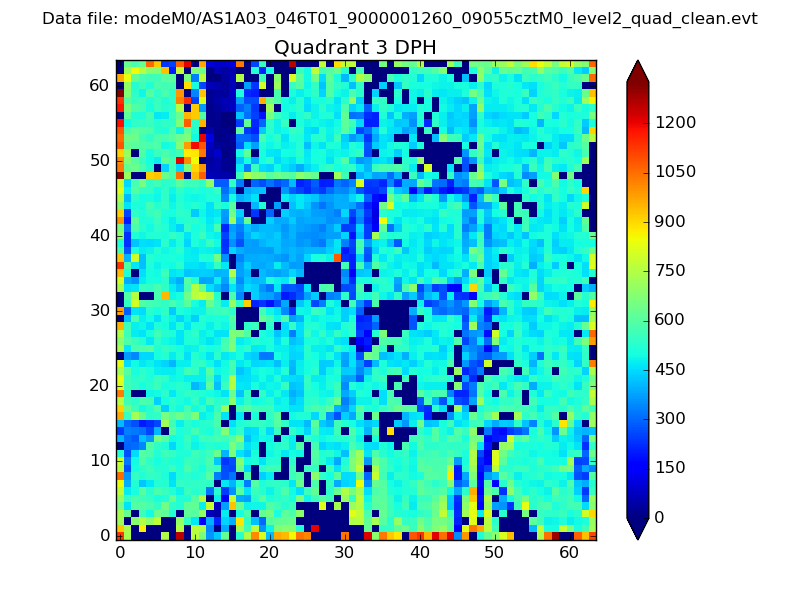 |
 |
Quadrant C |
| Plot type | Count rate plots | Images |
|---|---|---|
| Comparison with Poisson distribution Blue bars denote a histogram of data divided into 1 sec bins. Red curve is a Poisson curve with rate = median count rate of data. |
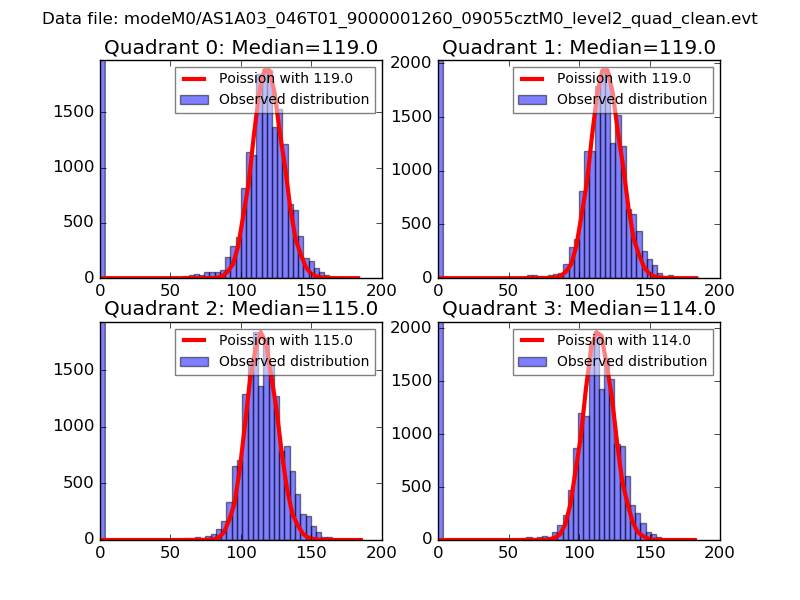 |
 |
| Quadrant-wise count rates Data is divided into 100 sec bins |
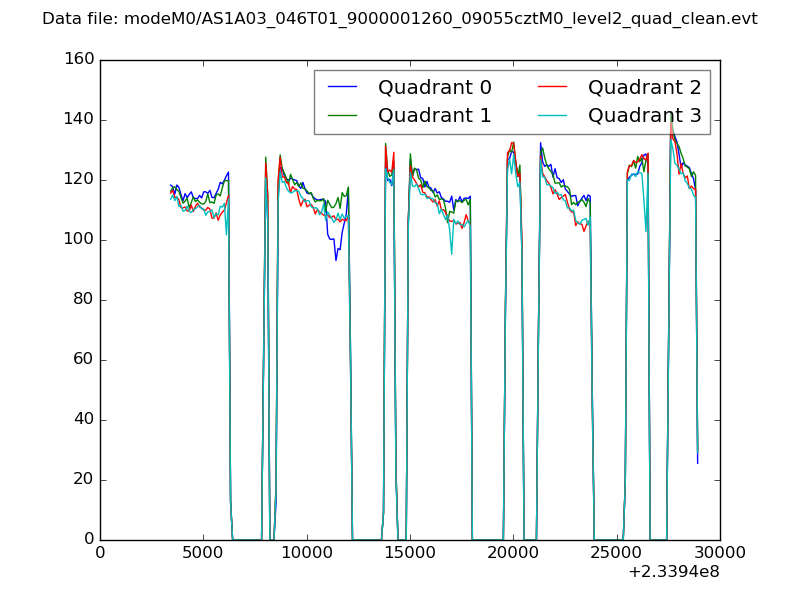 |
|
| Module-wise count rates for Quadrant A Data is divided into 100 sec bins |
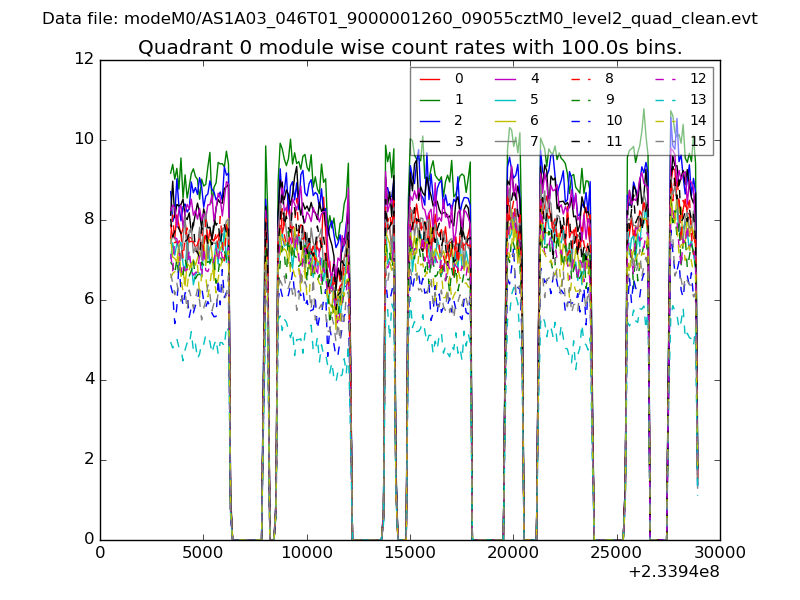 |
 |
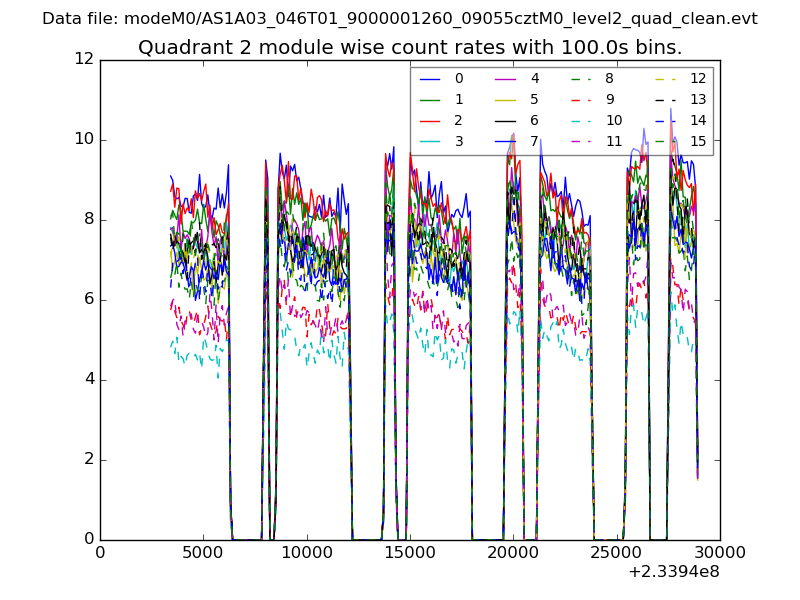
| Module-wise count rates for Quadrant B Data is divided into 100 sec bins |
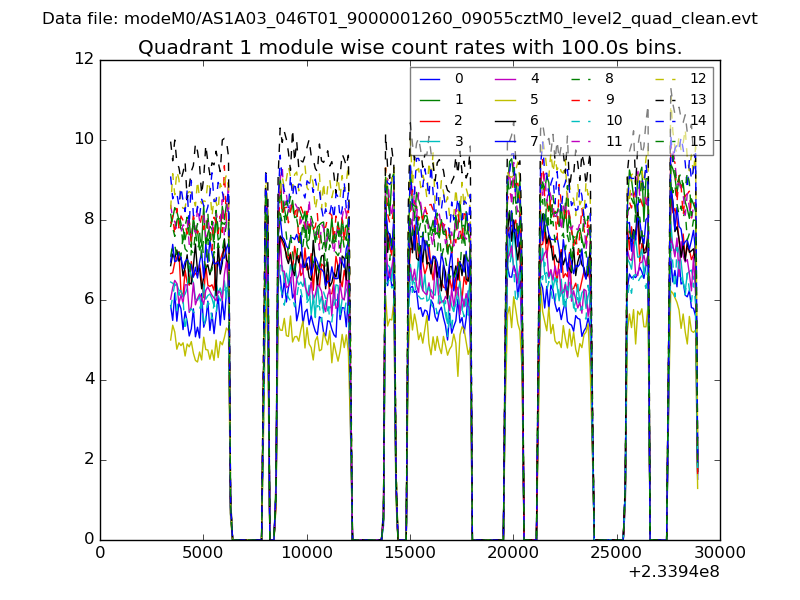 |
 |
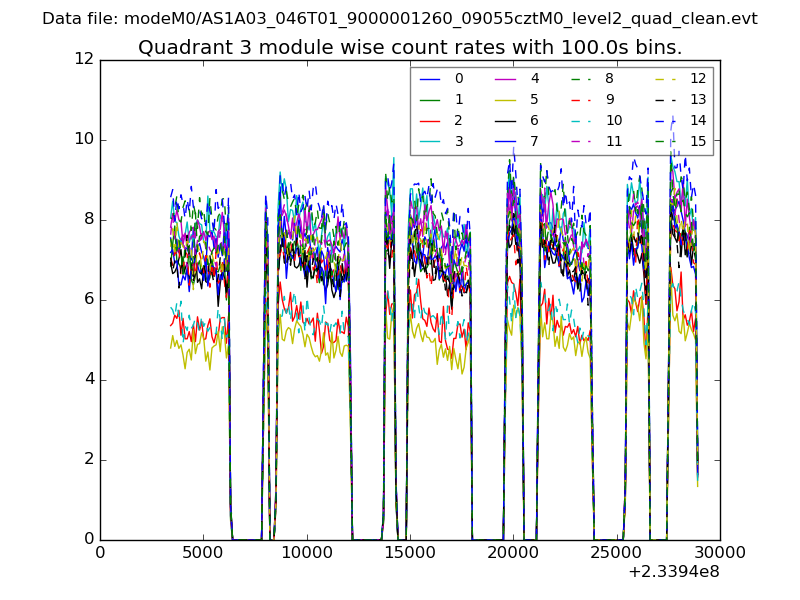
| Module-wise count rates for Quadrant C Data is divided into 100 sec bins |
 |
 |
| Module-wise count rates for Quadrant D Data is divided into 100 sec bins |
 |
 |
| Parameter | Plot |
|---|---|
| CZT HV Monitor | 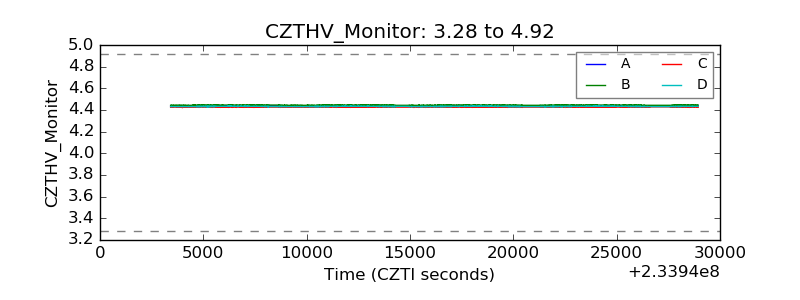 |
| D_VDD | 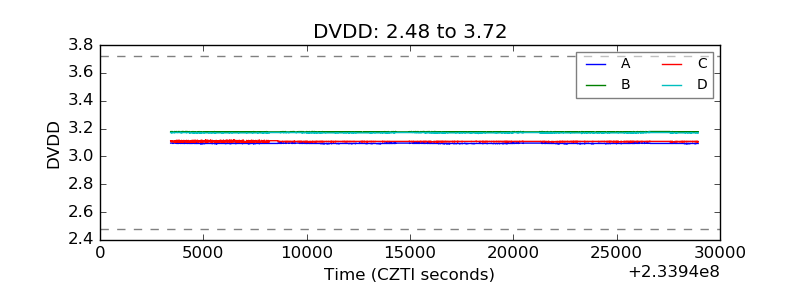 |
| Temperature 1 | 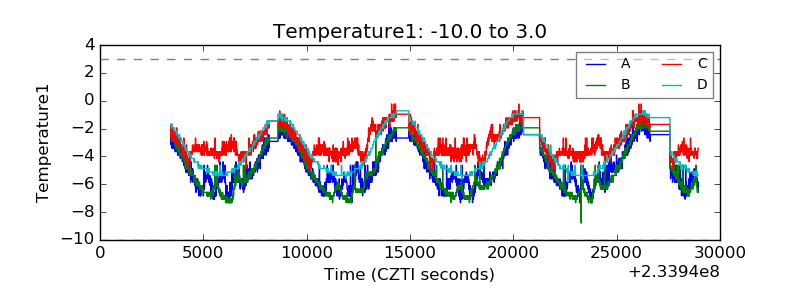 |
| Veto HV Monitor | 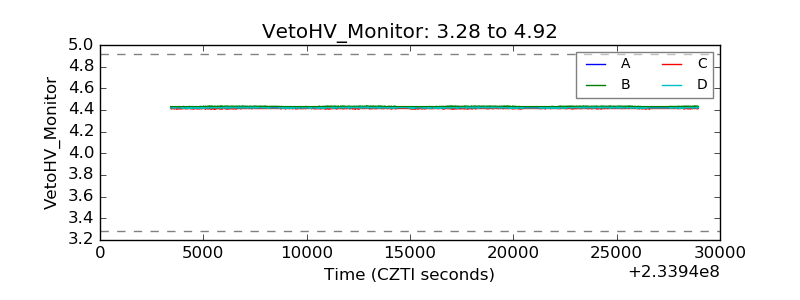 |
| Veto LLD | 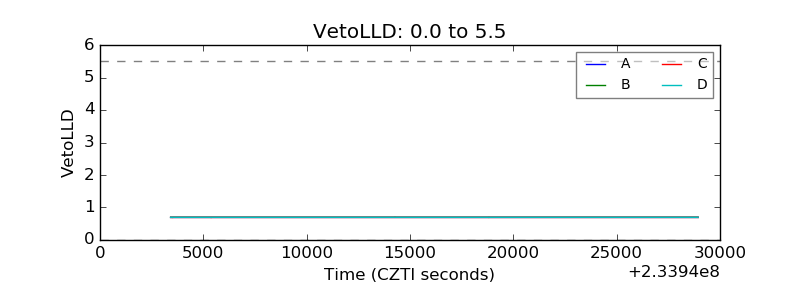 |
| Alpha Counter | 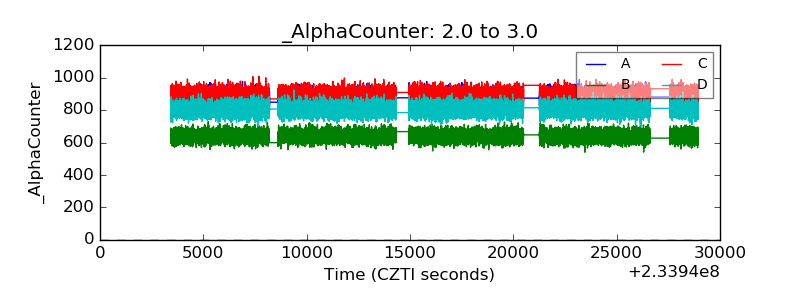 |
| _CPM_Rate | 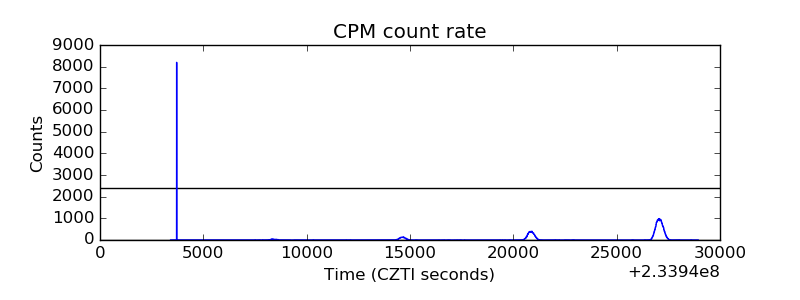 |
| CZT Counter | 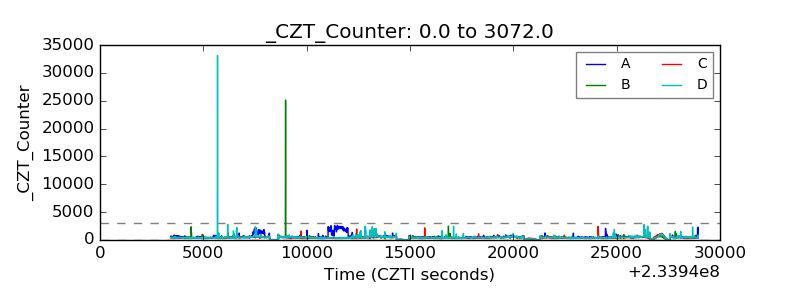 |
| +2.5 Volts monitor |  |
| +5 Volts monitor |  |
| _ROLL_ROT | 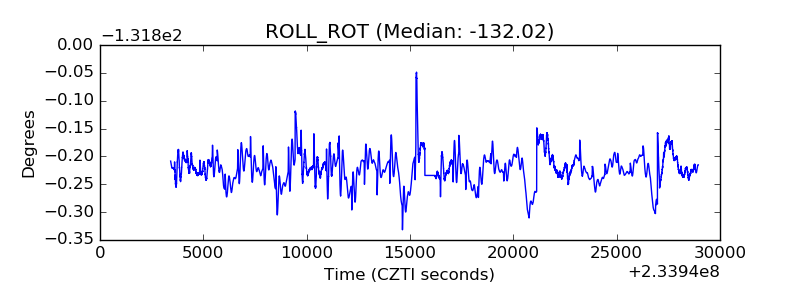 |
| _Roll_DEC | 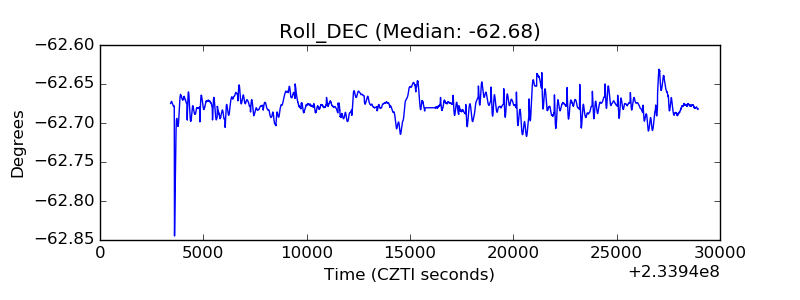 |
| _Roll_RA | 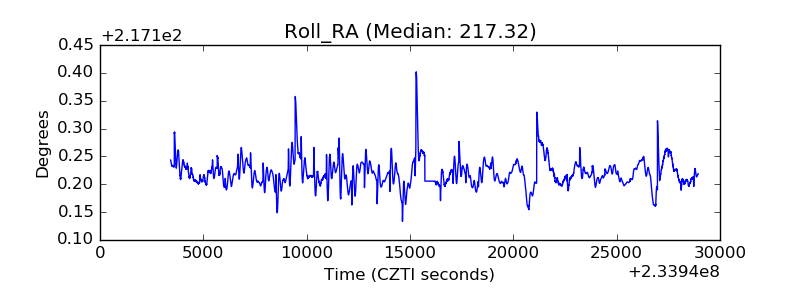 |
| Veto Counter | 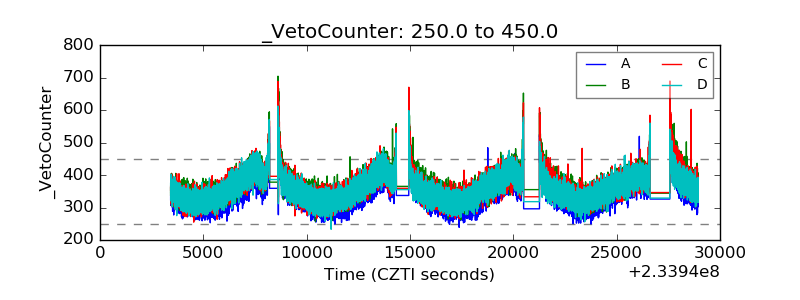 |