| Param | Original file | Final file |
|---|---|---|
| Filename | modeM0/AS1A03_046T01_9000001260_09058cztM0_level2.evt | modeM0/AS1A03_046T01_9000001260_09058cztM0_level2_quad_clean.evt |
| Size (bytes) | 526,622,400 | 107,461,440 |
| Size | 502.2 MB | 102.5 MB |
| Events in quadrant A | 3,629,206 | 701,327 |
| Events in quadrant B | 4,283,790 | 695,418 |
| Events in quadrant C | 3,280,159 | 699,855 |
| Events in quadrant D | 4,284,611 | 674,318 |
| Mode SS | |||
|---|---|---|---|
| Quadrant | BADHDUFLAG | Total packets | Discarded packets |
| A | 0 | 142 | 0 |
| B | 0 | 142 | 0 |
| C | 0 | 142 | 0 |
| D | 0 | 142 | 0 |
| Mode M9 | |||
|---|---|---|---|
| Quadrant | BADHDUFLAG | Total packets | Discarded packets |
| A | 0 | 23 | 0 |
| B | 0 | 23 | 0 |
| C | 0 | 23 | 0 |
| D | 0 | 23 | 0 |
| Mode M0 | |||
|---|---|---|---|
| Quadrant | BADHDUFLAG | Total packets | Discarded packets |
| A | 0 | 15420 | 3 |
| B | 0 | 17228 | 2 |
| C | 0 | 14396 | 2 |
| D | 0 | 17355 | 2 |
| Quadrant | Total seconds | Saturated seconds | Saturation percentage |
|---|---|---|---|
| A | 6943 | 14 | 0.201642% |
| B | 6943 | 257 | 3.701570% |
| C | 6943 | 27 | 0.388881% |
| D | 6943 | 295 | 4.248884% |
Noise dominated data is calculated using 1-second bins in cleaned event files. If a bin has >2000 counts, and if more than 50% of those come from <1% of pixels, then it is considered to be noise-dominated and hence unusable.
| Quadrant | # 1 sec bins | Bins with >0 counts | Bins with >2000 counts | High rate bins dominated by noise | Noise dominated (total time) | Noise dominated (detector-on time) | Marked lightcurve |
|---|---|---|---|---|---|---|---|
| A | 9228 | 6945 | 0 | 0 | 0.00% | 0.00% | 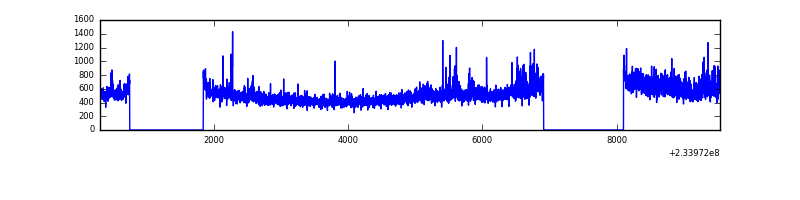 |
| B | 9228 | 6945 | 175 | 175 | 1.90% | 2.52% | 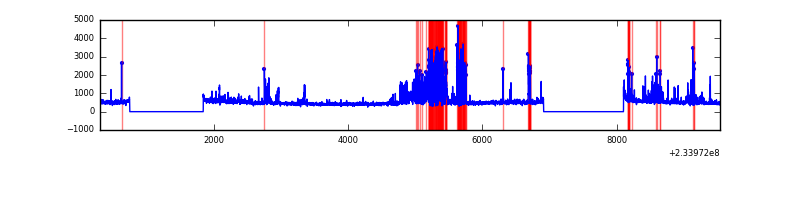 |
| C | 9228 | 6945 | 13 | 13 | 0.14% | 0.19% | 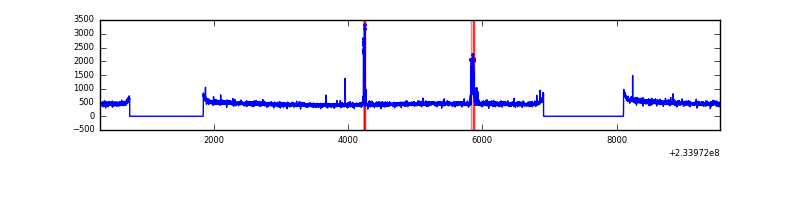 |
| D | 9228 | 6945 | 260 | 260 | 2.82% | 3.74% | 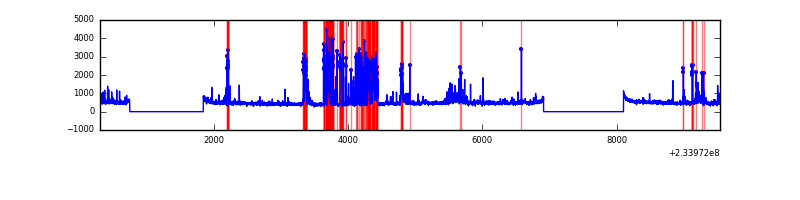 |
Top three noisy pixels from each quadrant. If the there are fewer than three noisy pixels in the level2.evt file, extra rows are filled as -1
| Pixel properties | Quadrant properties | ||||||
|---|---|---|---|---|---|---|---|
| Quadrant | DetID | PixID | Counts | Sigma | Mean | Median | Sigma |
| A | 8 | 5 | 342364 | 2051.89 | 830 | 812 | 166.5 |
| A | 15 | 239 | 70558 | 419.0 | 830 | 812 | 166.5 |
| A | 1 | 162 | 12176 | 68.27 | 830 | 812 | 166.5 |
| B | 10 | 16 | 862524 | 5564.82 | 831 | 813 | 154.8 |
| B | 4 | 48 | 120892 | 775.46 | 831 | 813 | 154.8 |
| B | 6 | 51 | 21725 | 135.05 | 831 | 813 | 154.8 |
| C | 14 | 234 | 89684 | 472.93 | 817 | 822 | 187.9 |
| C | 13 | 61 | 6282 | 29.06 | 817 | 822 | 187.9 |
| C | 14 | 67 | 2779 | 10.42 | 817 | 822 | 187.9 |
| D | 1 | 52 | 789634 | 3771.52 | 794 | 774 | 209.2 |
| D | 2 | 14 | 321246 | 1532.17 | 794 | 774 | 209.2 |
| D | 6 | 225 | 52918 | 249.3 | 794 | 774 | 209.2 |
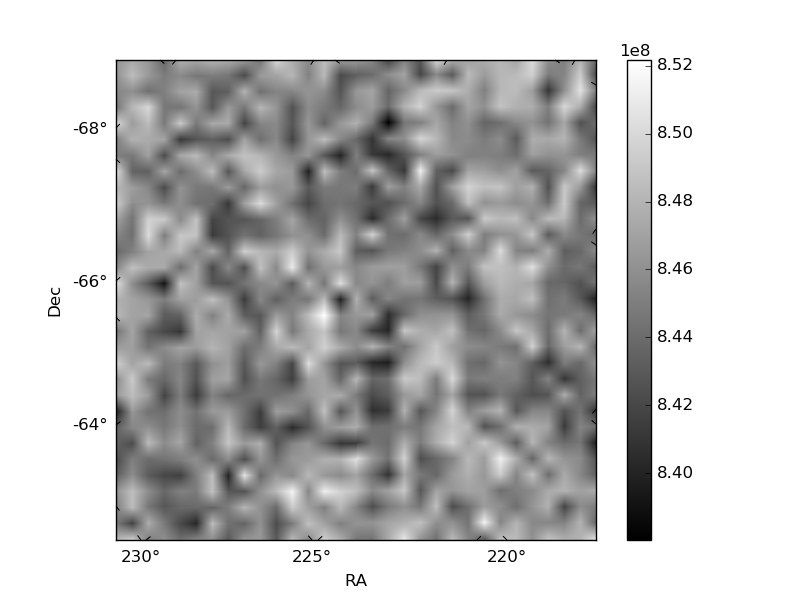
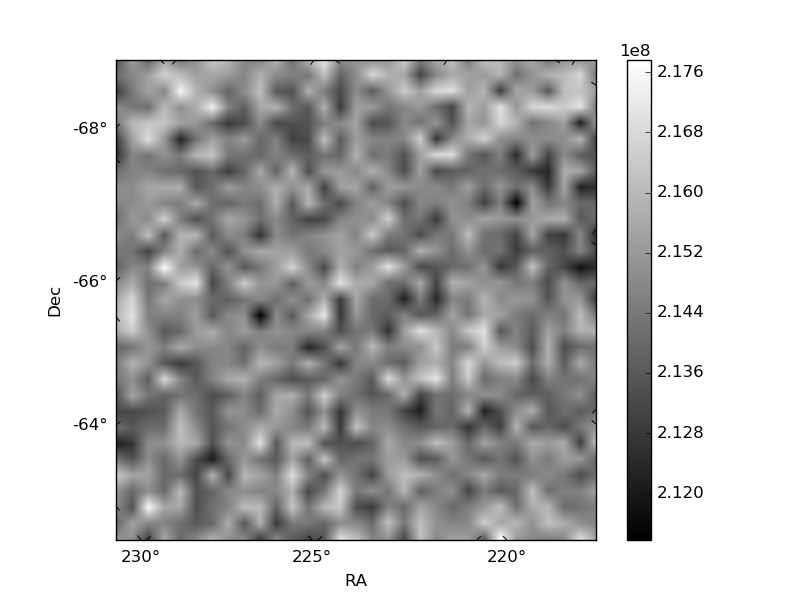
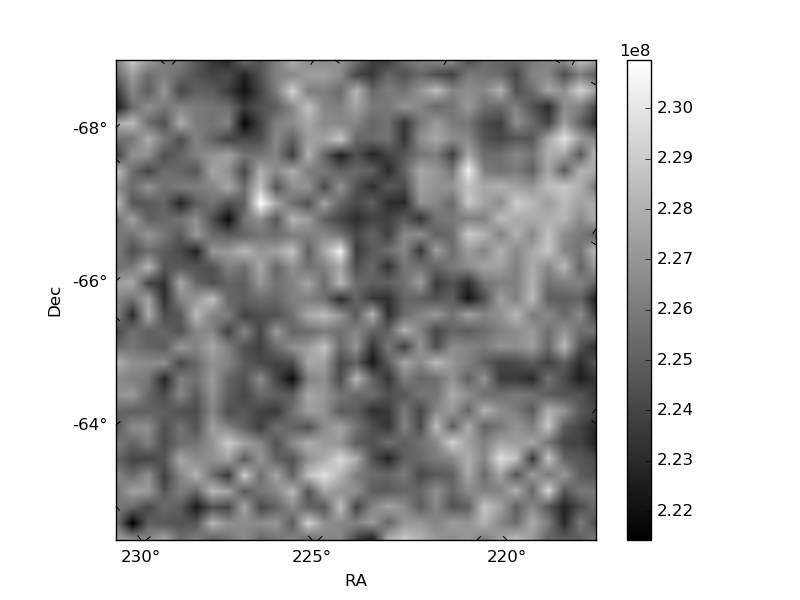
Histogram calculated using DETX and DETY for each event in the final _common_clean file
| Quadrant A | 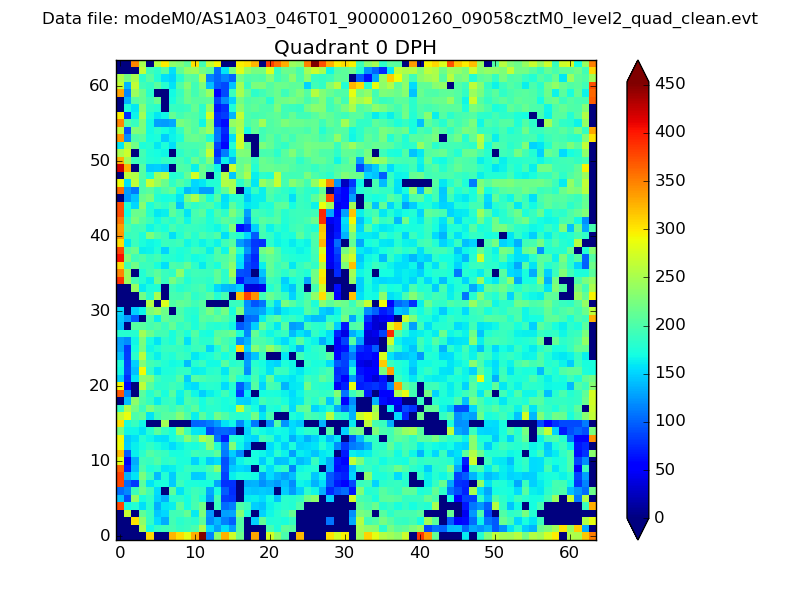 |
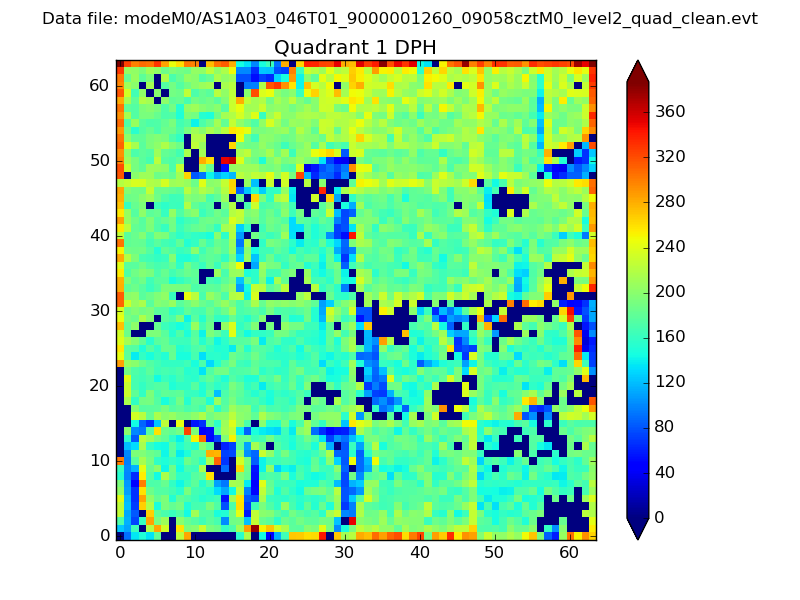 |
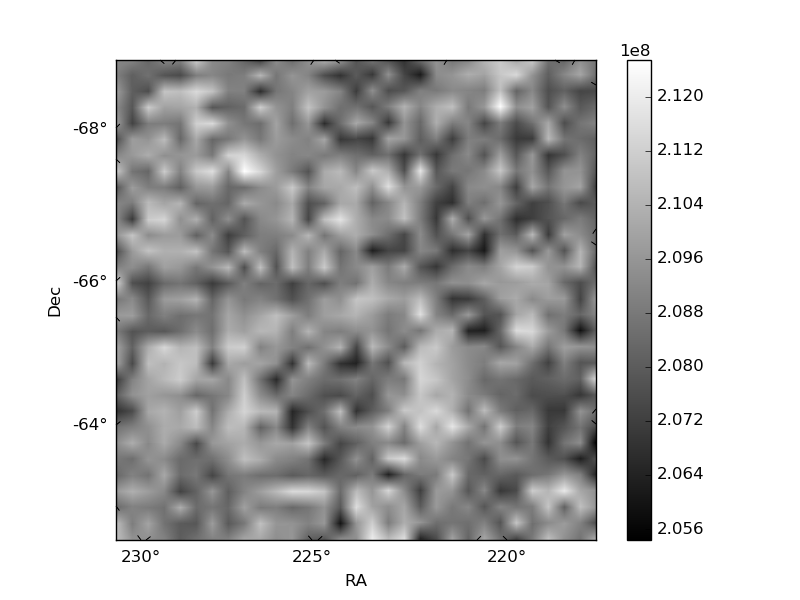
Quadrant B |
|---|---|---|---|
| Quadrant D | 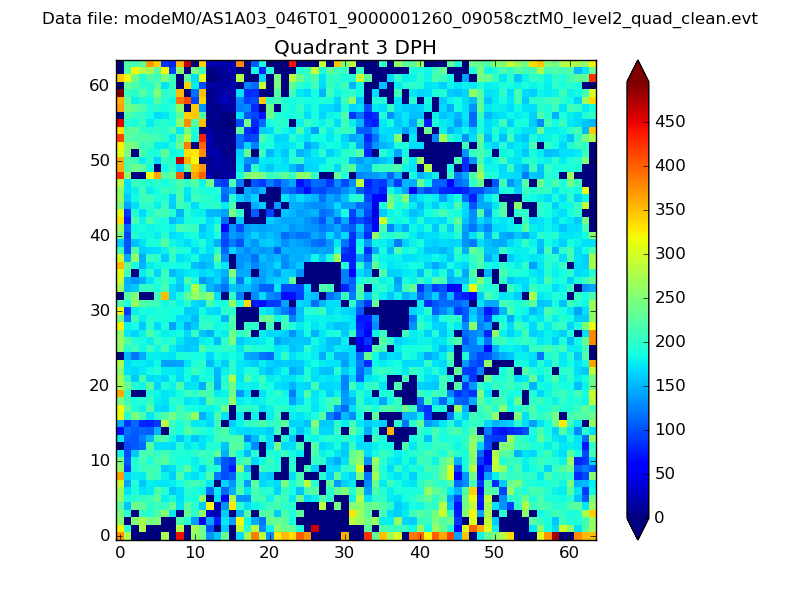 |
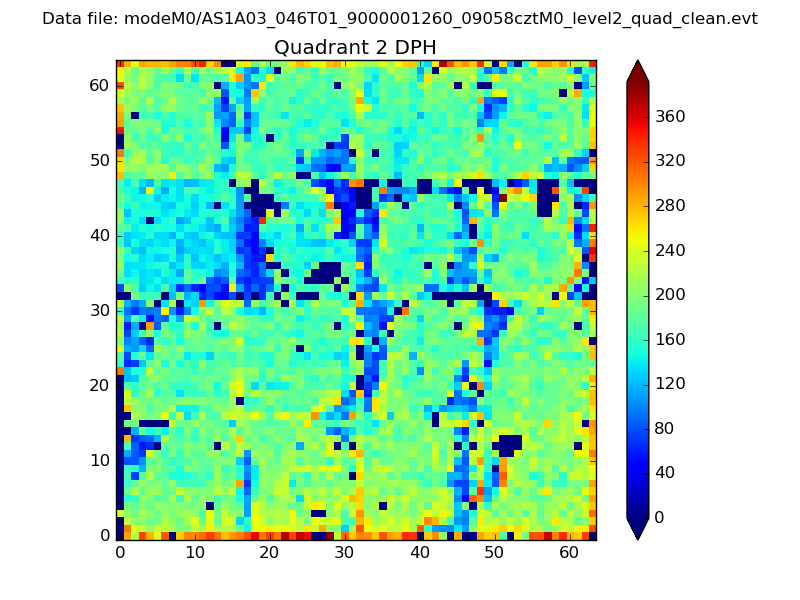 |
Quadrant C |
| Plot type | Count rate plots | Images |
|---|---|---|
| Comparison with Poisson distribution Blue bars denote a histogram of data divided into 1 sec bins. Red curve is a Poisson curve with rate = median count rate of data. |
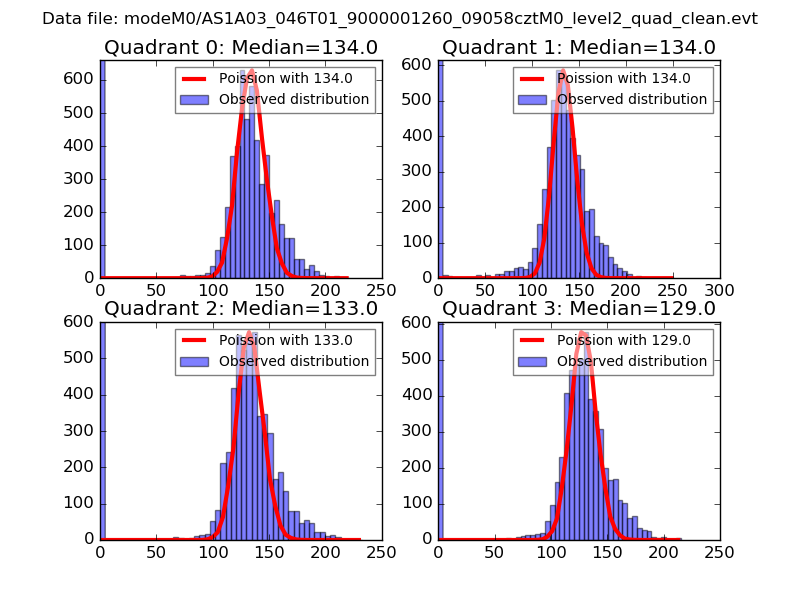 |
 |
| Quadrant-wise count rates Data is divided into 100 sec bins |
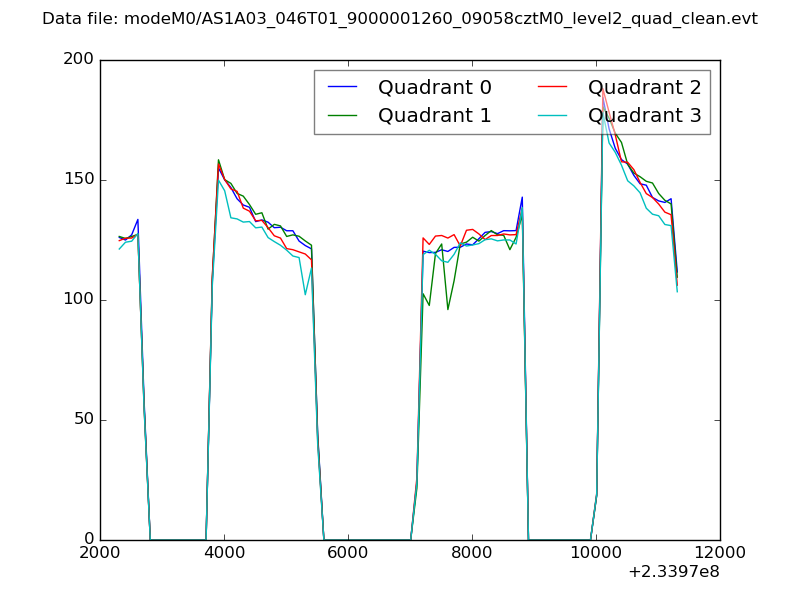 |
|
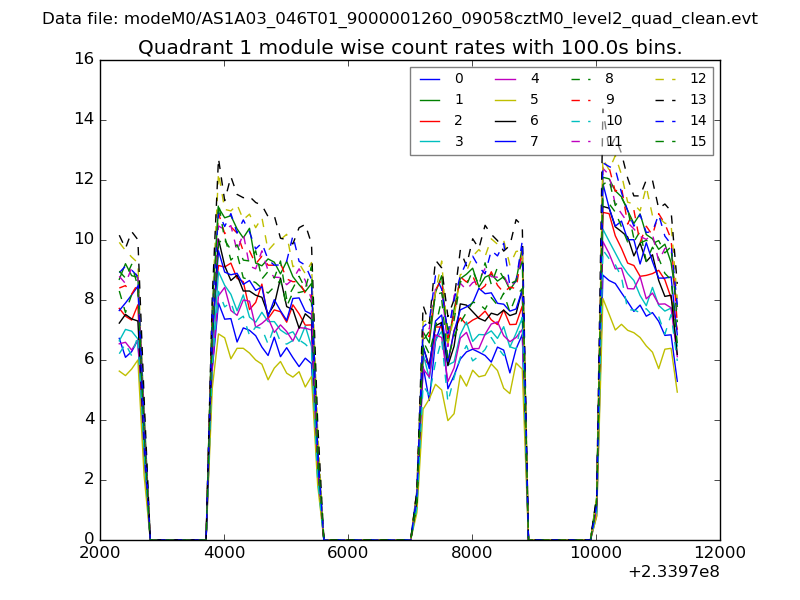
| Module-wise count rates for Quadrant A Data is divided into 100 sec bins |
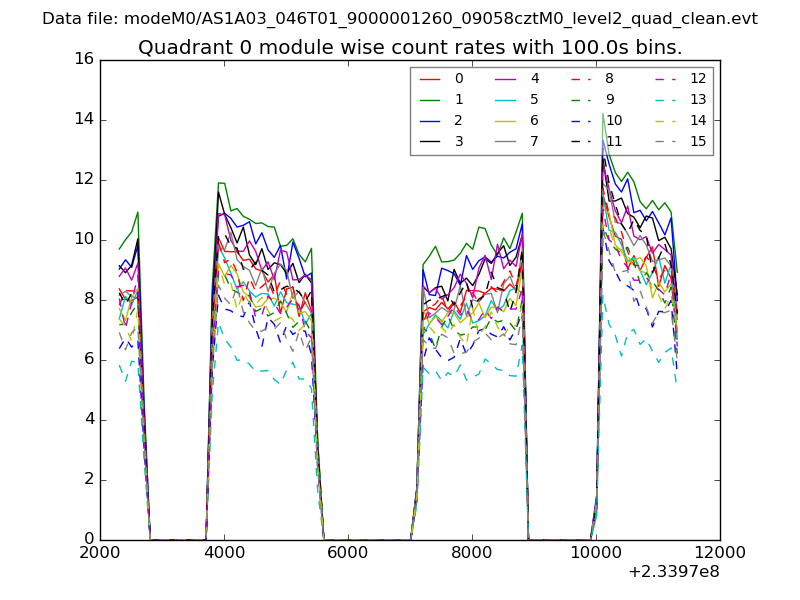 |
 |
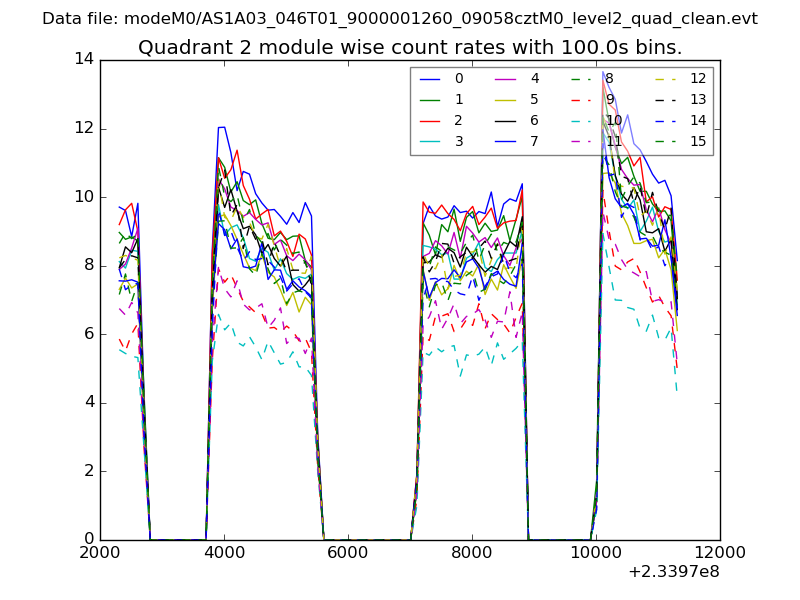
| Module-wise count rates for Quadrant B Data is divided into 100 sec bins |
 |
 |
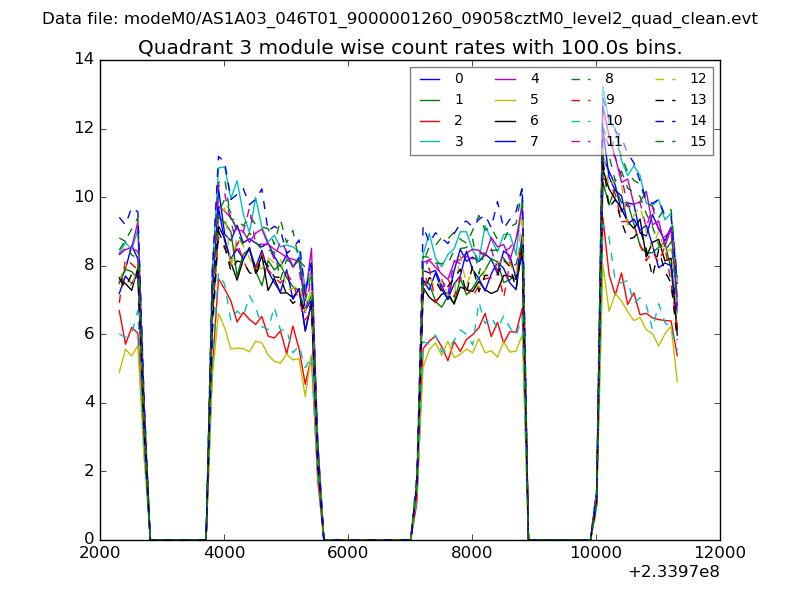
| Module-wise count rates for Quadrant C Data is divided into 100 sec bins |
 |
 |
| Module-wise count rates for Quadrant D Data is divided into 100 sec bins |
 |
 |
| Parameter | Plot |
|---|---|
| CZT HV Monitor | 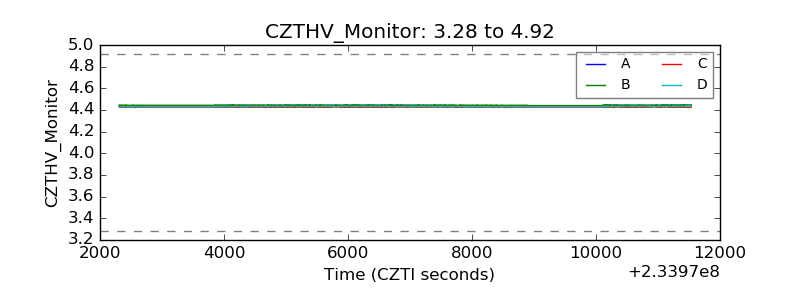 |
| D_VDD | 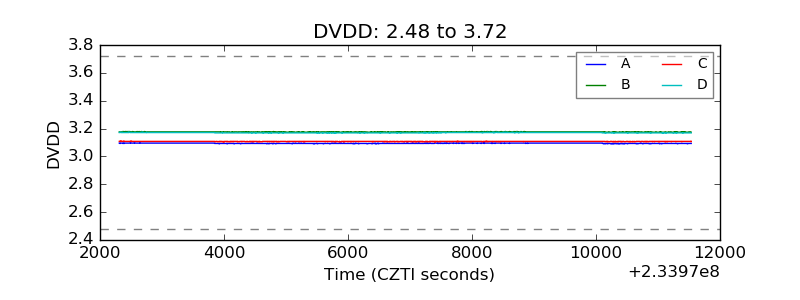 |
| Temperature 1 | 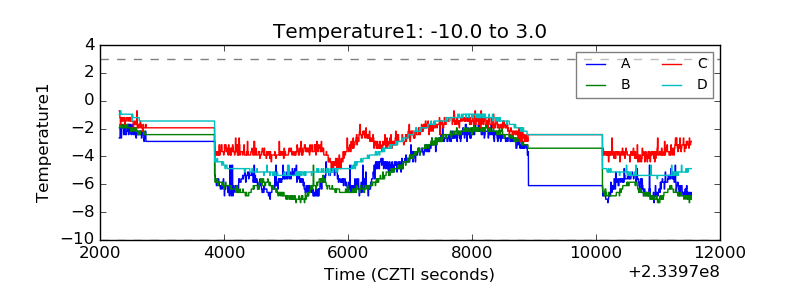 |
| Veto HV Monitor | 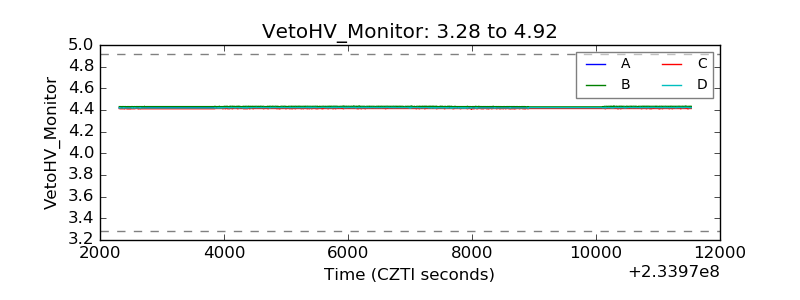 |
| Veto LLD | 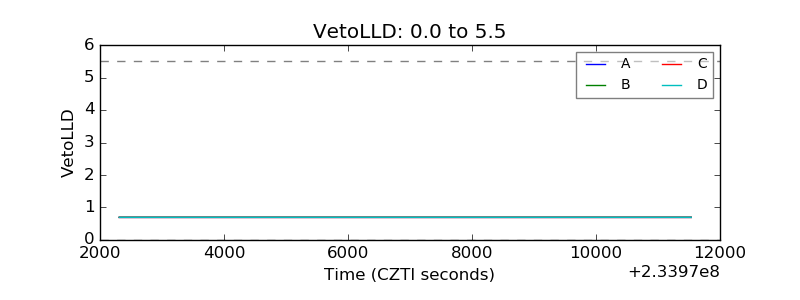 |
| Alpha Counter | 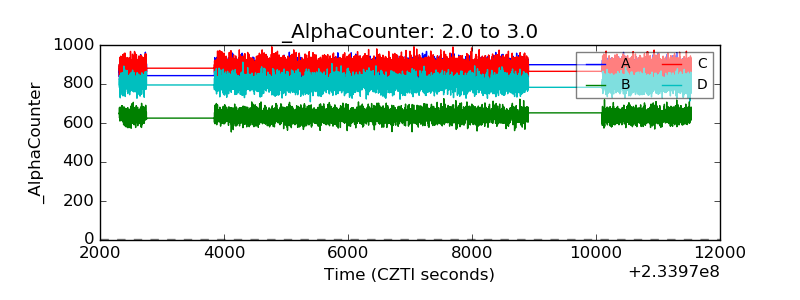 |
| _CPM_Rate | 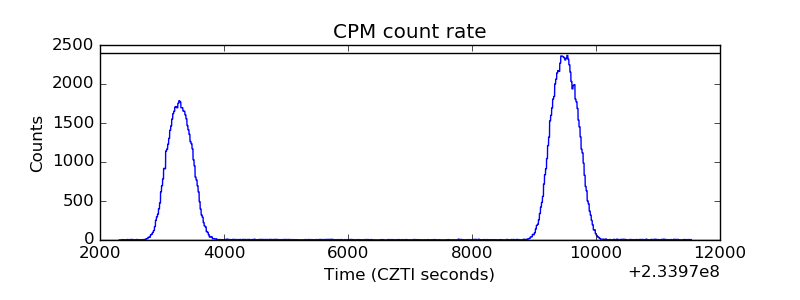 |
| CZT Counter | 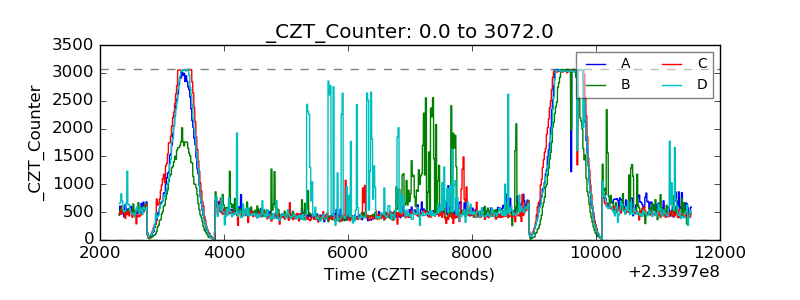 |
| +2.5 Volts monitor |  |
| +5 Volts monitor |  |
| _ROLL_ROT | 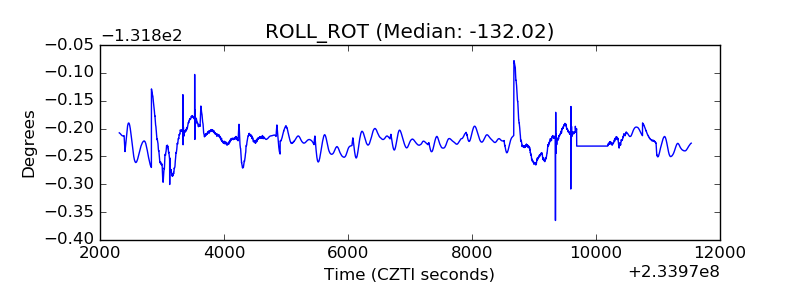 |
| _Roll_DEC | 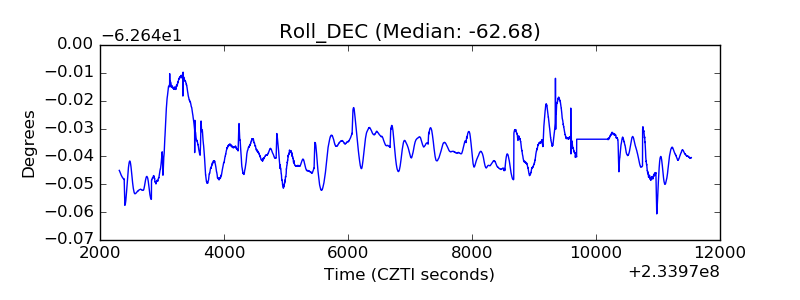 |
| _Roll_RA | 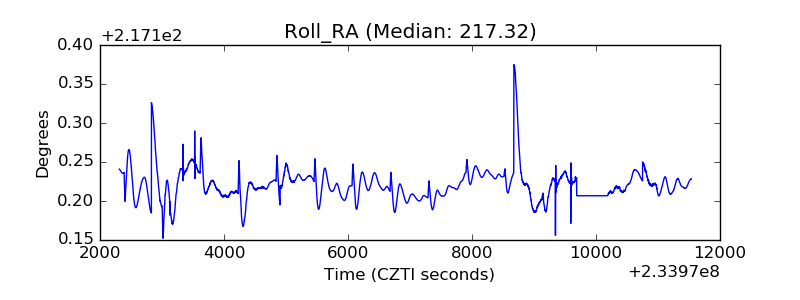 |
| Veto Counter | 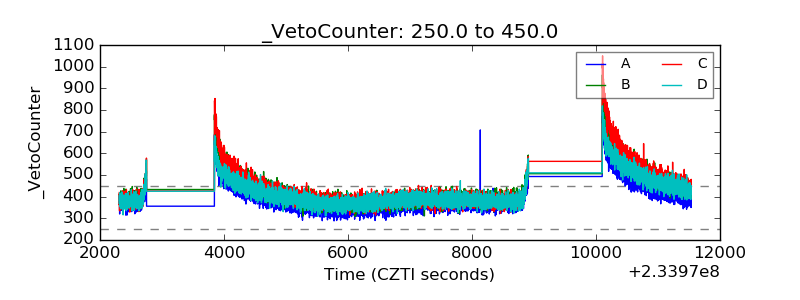 |