| Param | Original file | Final file |
|---|---|---|
| Filename | modeM0/AS1A03_046T01_9000001260_09059cztM0_level2.evt | modeM0/AS1A03_046T01_9000001260_09059cztM0_level2_quad_clean.evt |
| Size (bytes) | 473,607,360 | 92,286,720 |
| Size | 451.7 MB | 88.0 MB |
| Events in quadrant A | 3,583,619 | 589,802 |
| Events in quadrant B | 3,226,155 | 605,676 |
| Events in quadrant C | 2,998,751 | 599,514 |
| Events in quadrant D | 4,116,421 | 569,607 |
| Mode SS | |||
|---|---|---|---|
| Quadrant | BADHDUFLAG | Total packets | Discarded packets |
| A | 0 | 126 | 0 |
| B | 0 | 126 | 0 |
| C | 0 | 126 | 0 |
| D | 0 | 126 | 0 |
| Mode M9 | |||
|---|---|---|---|
| Quadrant | BADHDUFLAG | Total packets | Discarded packets |
| A | 0 | 13 | 0 |
| B | 0 | 13 | 0 |
| C | 0 | 13 | 0 |
| D | 0 | 13 | 0 |
| Mode M0 | |||
|---|---|---|---|
| Quadrant | BADHDUFLAG | Total packets | Discarded packets |
| A | 0 | 14589 | 3 |
| B | 0 | 13412 | 2 |
| C | 0 | 12818 | 2 |
| D | 0 | 16372 | 2 |
| Quadrant | Total seconds | Saturated seconds | Saturation percentage |
|---|---|---|---|
| A | 6159 | 102 | 1.656113% |
| B | 6159 | 75 | 1.217730% |
| C | 6159 | 34 | 0.552038% |
| D | 6159 | 241 | 3.912973% |
Noise dominated data is calculated using 1-second bins in cleaned event files. If a bin has >2000 counts, and if more than 50% of those come from <1% of pixels, then it is considered to be noise-dominated and hence unusable.
| Quadrant | # 1 sec bins | Bins with >0 counts | Bins with >2000 counts | High rate bins dominated by noise | Noise dominated (total time) | Noise dominated (detector-on time) | Marked lightcurve |
|---|---|---|---|---|---|---|---|
| A | 7429 | 6160 | 62 | 62 | 0.83% | 1.01% | 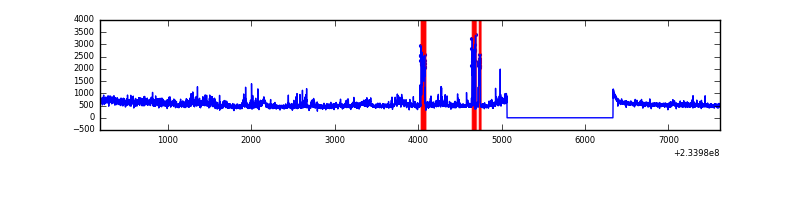 |
| B | 7429 | 6160 | 20 | 20 | 0.27% | 0.32% | 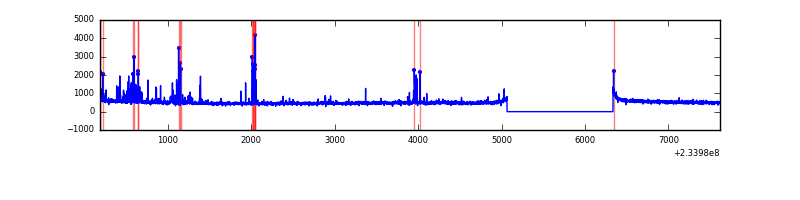 |
| C | 7429 | 6160 | 5 | 5 | 0.07% | 0.08% | 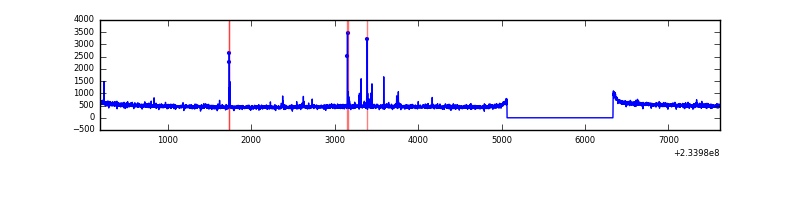 |
| D | 7429 | 6160 | 187 | 187 | 2.52% | 3.04% | 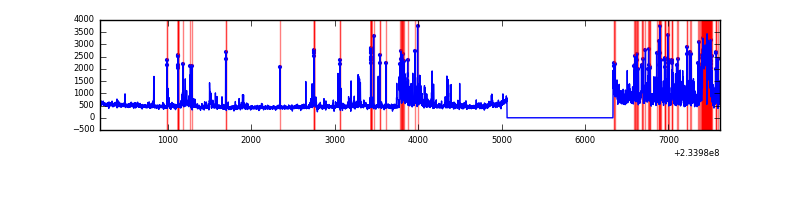 |
Top three noisy pixels from each quadrant. If the there are fewer than three noisy pixels in the level2.evt file, extra rows are filled as -1
| Pixel properties | Quadrant properties | ||||||
|---|---|---|---|---|---|---|---|
| Quadrant | DetID | PixID | Counts | Sigma | Mean | Median | Sigma |
| A | 8 | 5 | 405738 | 2678.06 | 758 | 745 | 151.2 |
| A | 15 | 239 | 223316 | 1471.77 | 758 | 745 | 151.2 |
| A | 1 | 162 | 25037 | 160.63 | 758 | 745 | 151.2 |
| B | 10 | 16 | 154738 | 1076.12 | 771 | 752 | 143.1 |
| B | 6 | 51 | 44508 | 305.78 | 771 | 752 | 143.1 |
| B | 12 | 111 | 14594 | 96.73 | 771 | 752 | 143.1 |
| C | 14 | 234 | 43005 | 245.14 | 755 | 760 | 172.3 |
| C | 3 | 254 | 10602 | 57.11 | 755 | 760 | 172.3 |
| C | 13 | 61 | 5736 | 28.87 | 755 | 760 | 172.3 |
| D | 1 | 52 | 747024 | 3906.24 | 735 | 718 | 191.1 |
| D | 13 | 104 | 266393 | 1390.57 | 735 | 718 | 191.1 |
| D | 2 | 14 | 192152 | 1001.98 | 735 | 718 | 191.1 |
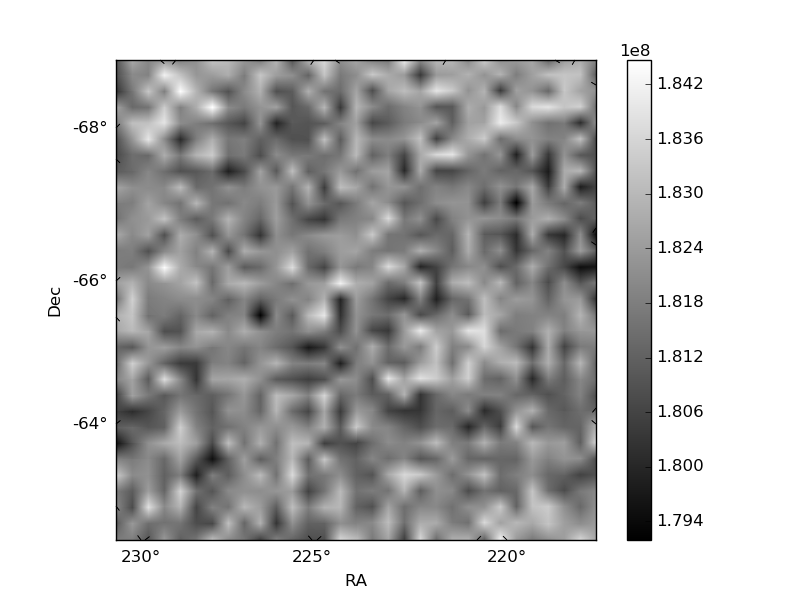
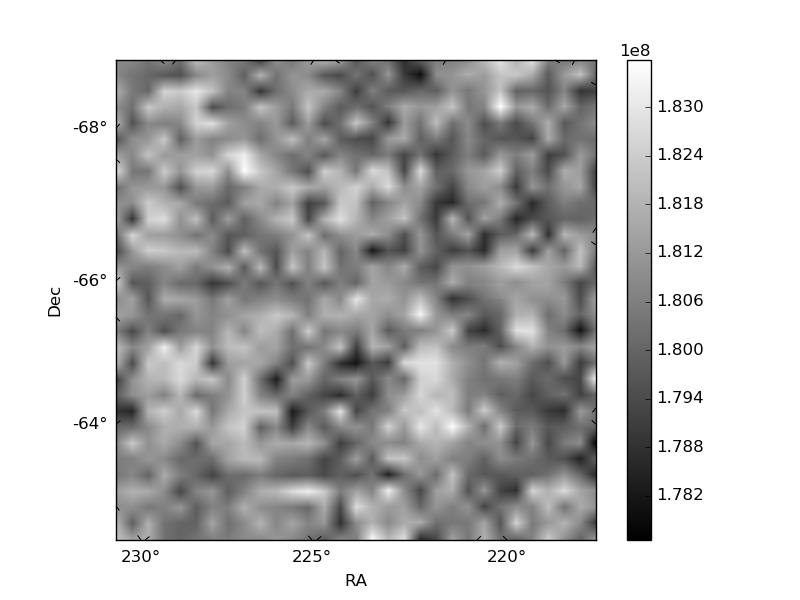
Histogram calculated using DETX and DETY for each event in the final _common_clean file
| Quadrant A |  |
 |
Quadrant B |
|---|---|---|---|
| Quadrant D |  |
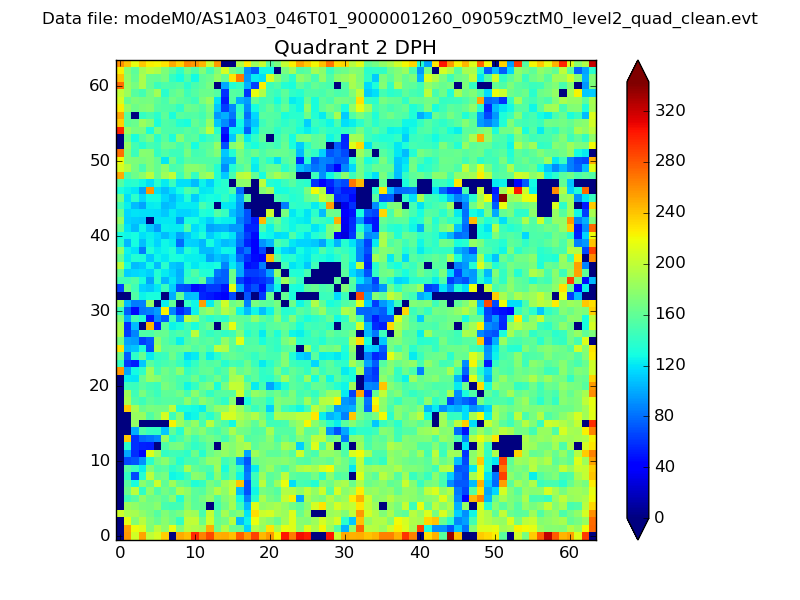 |
Quadrant C |
| Plot type | Count rate plots | Images |
|---|---|---|
| Comparison with Poisson distribution Blue bars denote a histogram of data divided into 1 sec bins. Red curve is a Poisson curve with rate = median count rate of data. |
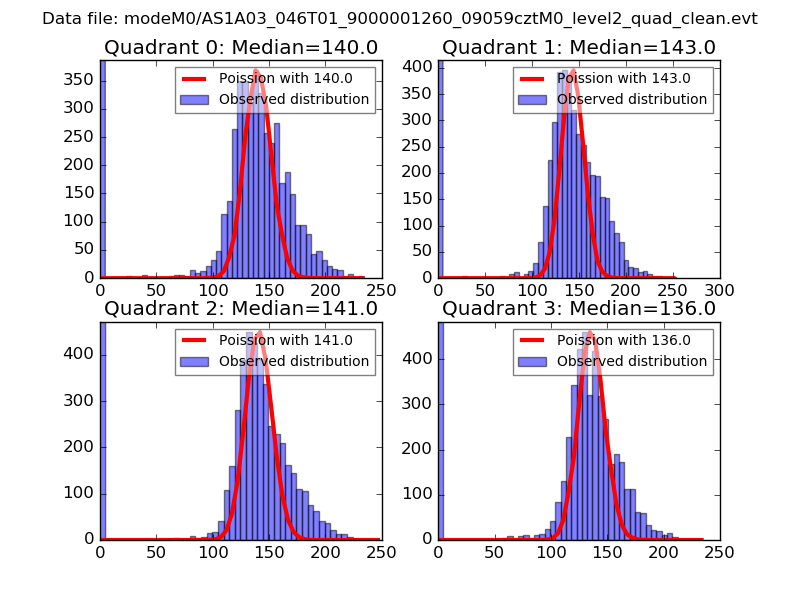 |
 |
| Quadrant-wise count rates Data is divided into 100 sec bins |
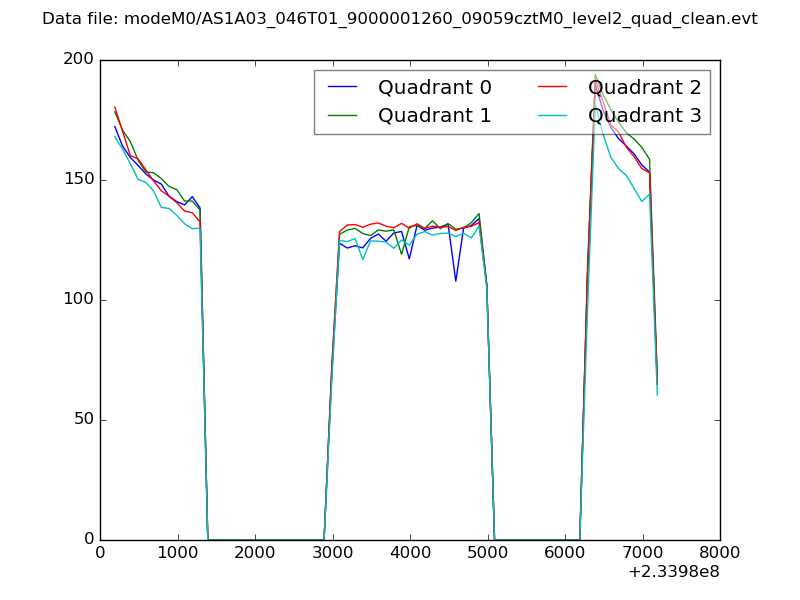 |
|
| Module-wise count rates for Quadrant A Data is divided into 100 sec bins |
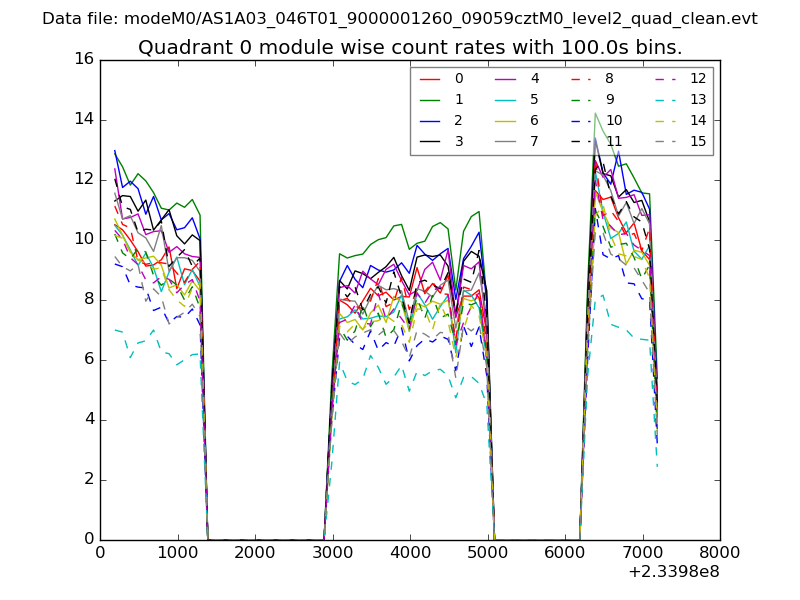 |
 |
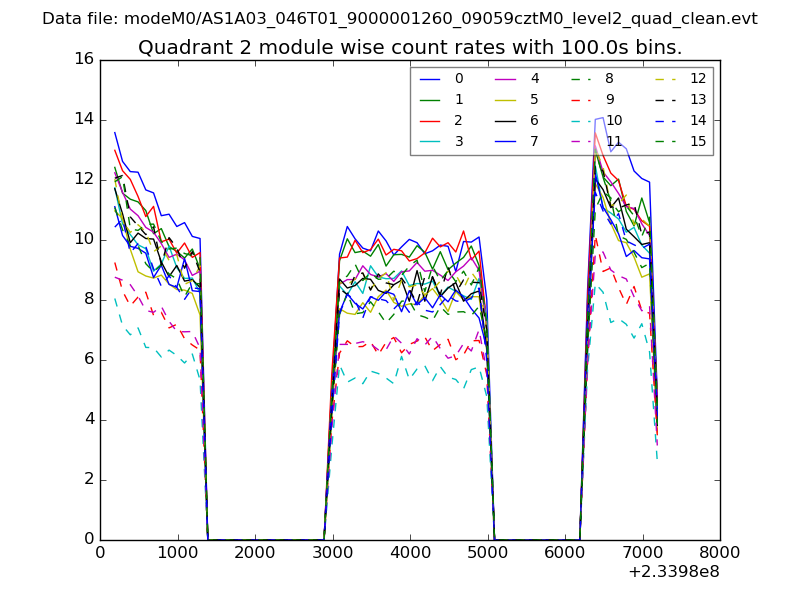
| Module-wise count rates for Quadrant B Data is divided into 100 sec bins |
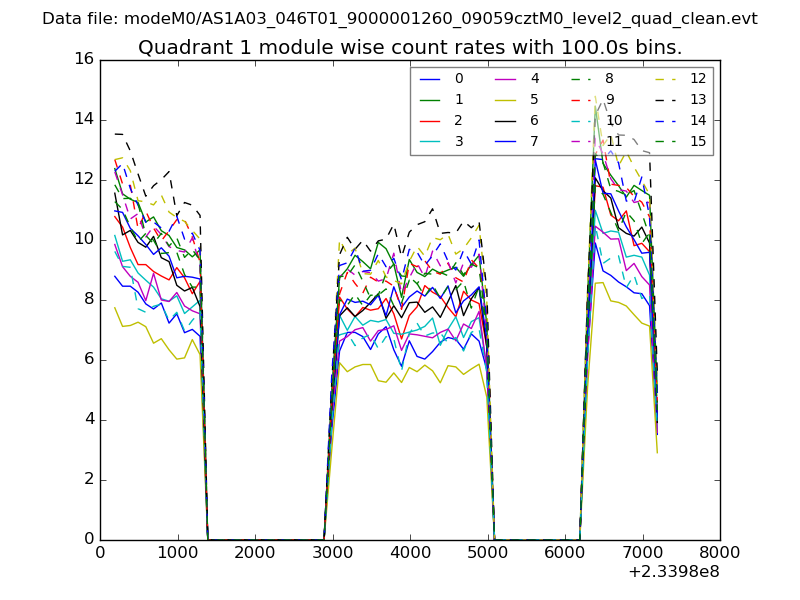 |
 |
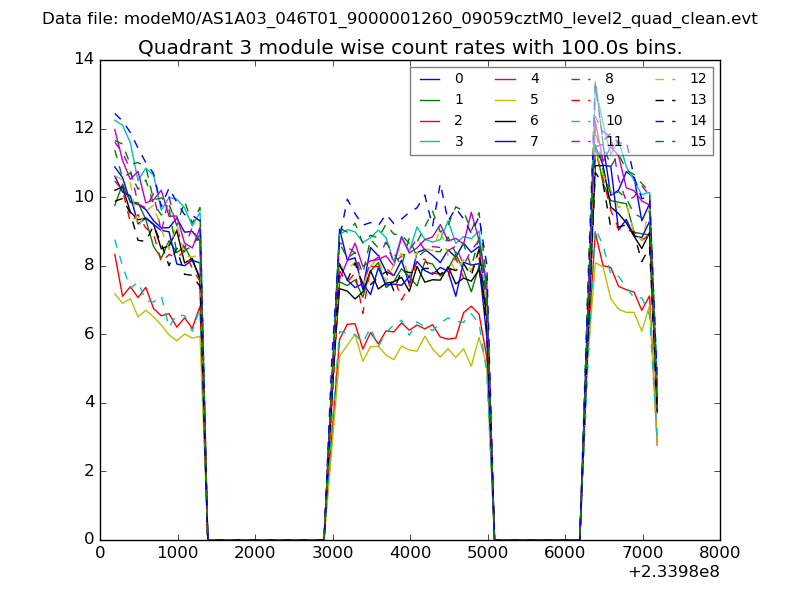
| Module-wise count rates for Quadrant C Data is divided into 100 sec bins |
 |
 |
| Module-wise count rates for Quadrant D Data is divided into 100 sec bins |
 |
 |
| Parameter | Plot |
|---|---|
| CZT HV Monitor | 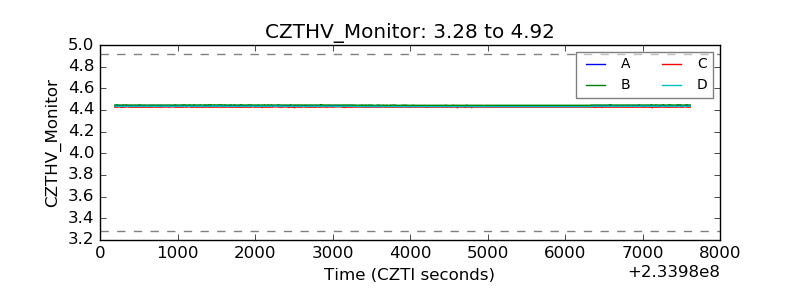 |
| D_VDD | 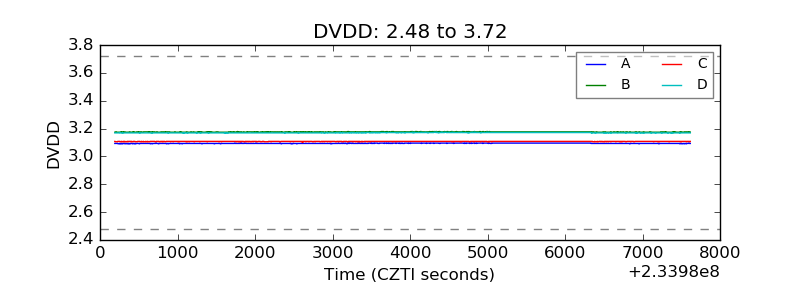 |
| Temperature 1 | 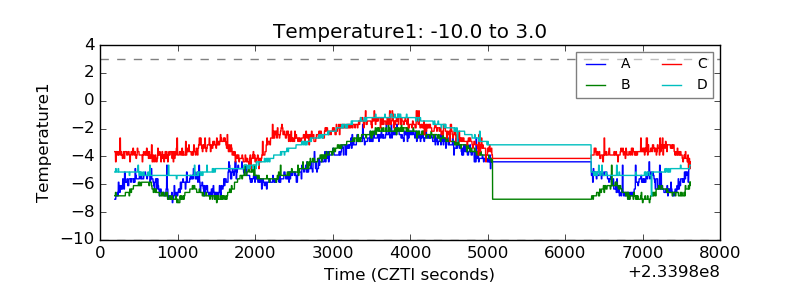 |
| Veto HV Monitor | 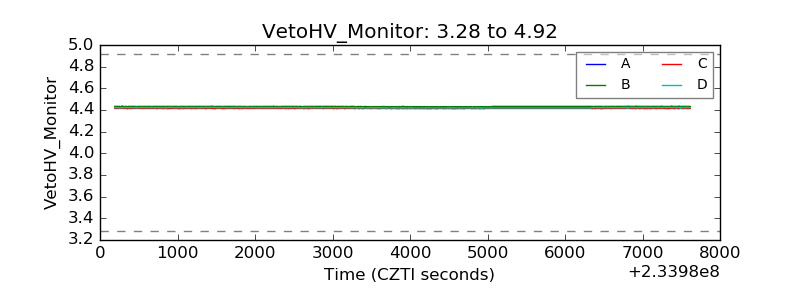 |
| Veto LLD | 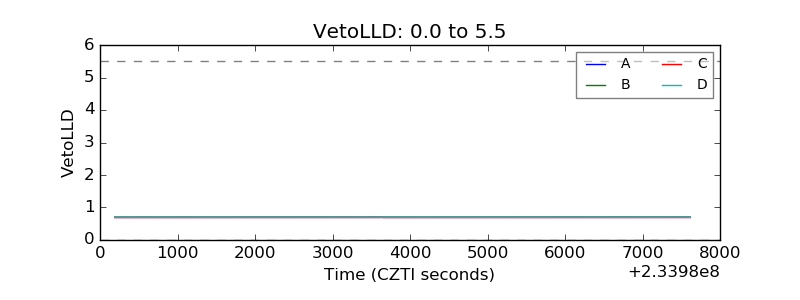 |
| Alpha Counter | 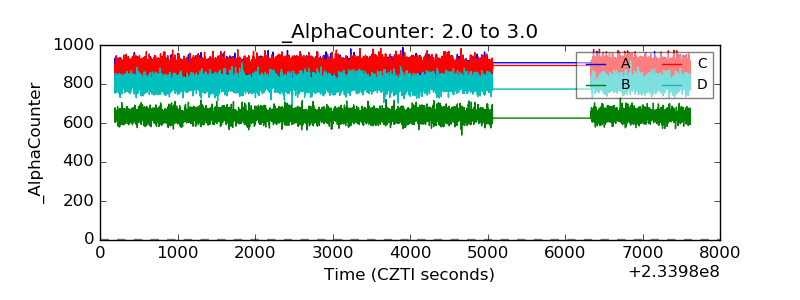 |
| _CPM_Rate | 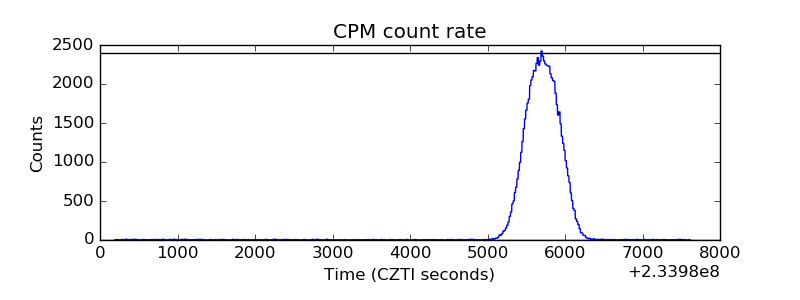 |
| CZT Counter |  |
| +2.5 Volts monitor |  |
| +5 Volts monitor |  |
| _ROLL_ROT | 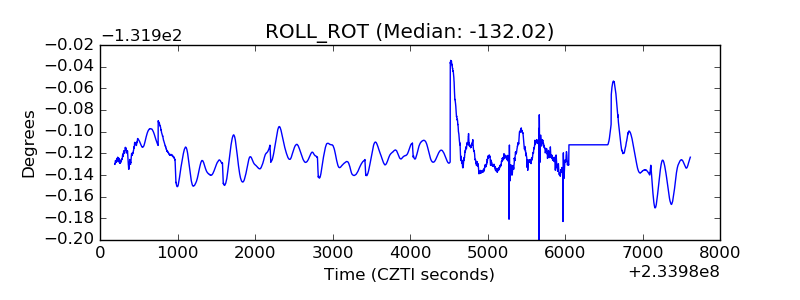 |
| _Roll_DEC | 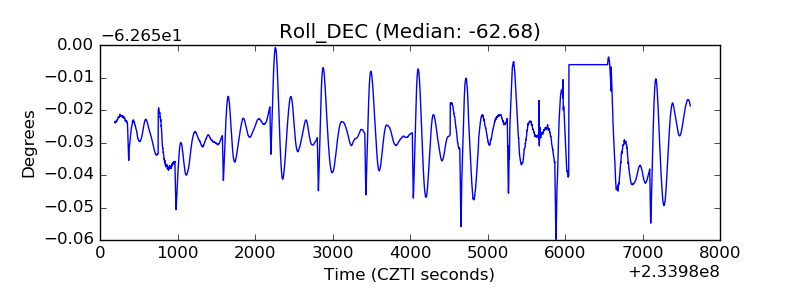 |
| _Roll_RA | 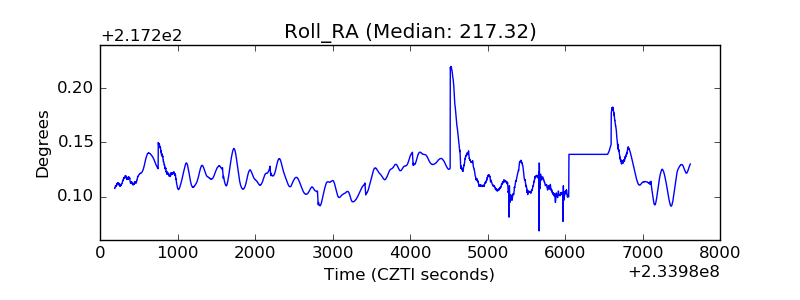 |
| Veto Counter | 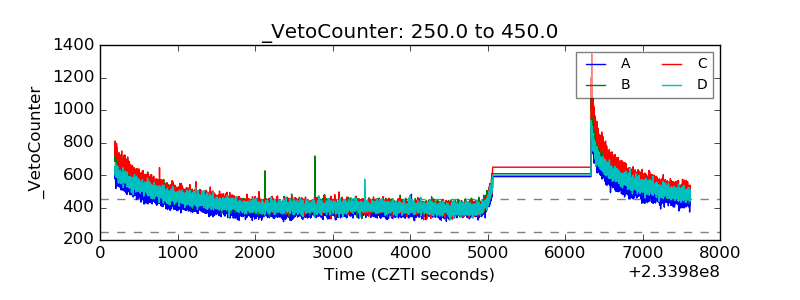 |