| Param | Original file | Final file |
|---|---|---|
| Filename | modeM0/AS1A03_046T01_9000001260_09061cztM0_level2.evt | modeM0/AS1A03_046T01_9000001260_09061cztM0_level2_quad_clean.evt |
| Size (bytes) | 397,149,120 | 61,496,640 |
| Size | 378.8 MB | 58.6 MB |
| Events in quadrant A | 2,920,590 | 373,537 |
| Events in quadrant B | 2,770,479 | 378,095 |
| Events in quadrant C | 2,619,534 | 375,127 |
| Events in quadrant D | 3,352,323 | 360,469 |
| Mode SS | |||
|---|---|---|---|
| Quadrant | BADHDUFLAG | Total packets | Discarded packets |
| A | 0 | 124 | 14 |
| B | 0 | 124 | 16 |
| C | 0 | 124 | 24 |
| D | 0 | 124 | 20 |
| Mode M9 | |||
|---|---|---|---|
| Quadrant | BADHDUFLAG | Total packets | Discarded packets |
| A | 0 | 12 | 0 |
| B | 0 | 12 | 0 |
| C | 0 | 12 | 0 |
| D | 0 | 12 | 0 |
| Mode M0 | |||
|---|---|---|---|
| Quadrant | BADHDUFLAG | Total packets | Discarded packets |
| A | 0 | 13249 | 1460 |
| B | 0 | 12945 | 1500 |
| C | 0 | 12563 | 1481 |
| D | 0 | 15744 | 2436 |
| Quadrant | Total seconds | Saturated seconds | Saturation percentage |
|---|---|---|---|
| A | 5404 | 111 | 2.054034% |
| B | 5375 | 103 | 1.916279% |
| C | 5363 | 75 | 1.398471% |
| D | 5268 | 190 | 3.606682% |
Noise dominated data is calculated using 1-second bins in cleaned event files. If a bin has >2000 counts, and if more than 50% of those come from <1% of pixels, then it is considered to be noise-dominated and hence unusable.
| Quadrant | # 1 sec bins | Bins with >0 counts | Bins with >2000 counts | High rate bins dominated by noise | Noise dominated (total time) | Noise dominated (detector-on time) | Marked lightcurve |
|---|---|---|---|---|---|---|---|
| A | 7341 | 5878 | 4 | 4 | 0.05% | 0.07% | 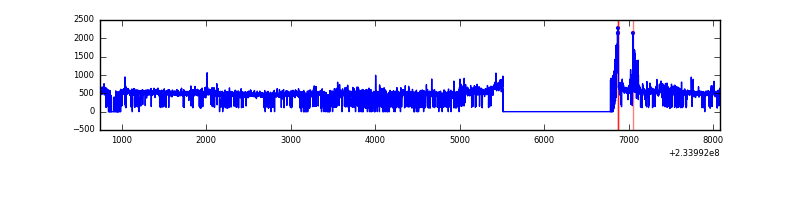 |
| B | 7341 | 5872 | 7 | 7 | 0.10% | 0.12% | 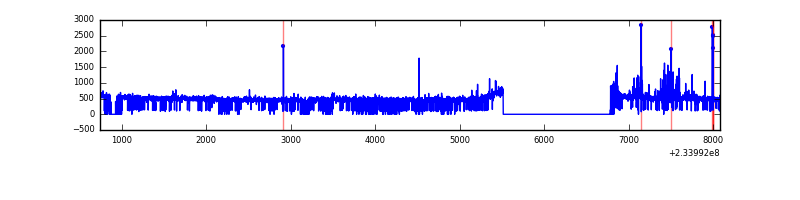 |
| C | 7341 | 5853 | 2 | 2 | 0.03% | 0.03% | 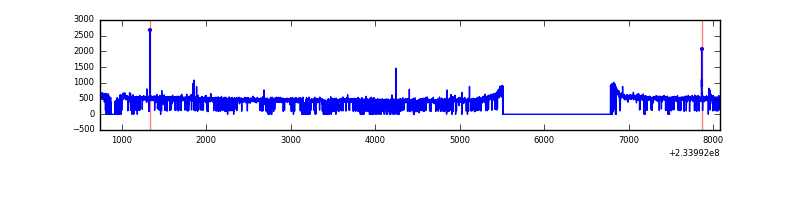 |
| D | 7341 | 5793 | 91 | 91 | 1.24% | 1.57% |  |
Top three noisy pixels from each quadrant. If the there are fewer than three noisy pixels in the level2.evt file, extra rows are filled as -1
| Pixel properties | Quadrant properties | ||||||
|---|---|---|---|---|---|---|---|
| Quadrant | DetID | PixID | Counts | Sigma | Mean | Median | Sigma |
| A | 8 | 5 | 213274 | 1571.48 | 679 | 664 | 135.3 |
| A | 15 | 174 | 45108 | 328.5 | 679 | 664 | 135.3 |
| A | 1 | 162 | 29097 | 210.16 | 679 | 664 | 135.3 |
| B | 10 | 16 | 95473 | 746.43 | 680 | 664 | 127.0 |
| B | 0 | 219 | 30402 | 234.13 | 680 | 664 | 127.0 |
| B | 12 | 111 | 12969 | 96.88 | 680 | 664 | 127.0 |
| C | 14 | 234 | 19262 | 122.86 | 665 | 669 | 151.3 |
| C | 13 | 61 | 5035 | 28.85 | 665 | 669 | 151.3 |
| C | 12 | 4 | 3669 | 19.82 | 665 | 669 | 151.3 |
| D | 1 | 52 | 665438 | 4227.24 | 646 | 630 | 157.3 |
| D | 2 | 14 | 181553 | 1150.41 | 646 | 630 | 157.3 |
| D | 8 | 195 | 35405 | 221.12 | 646 | 630 | 157.3 |
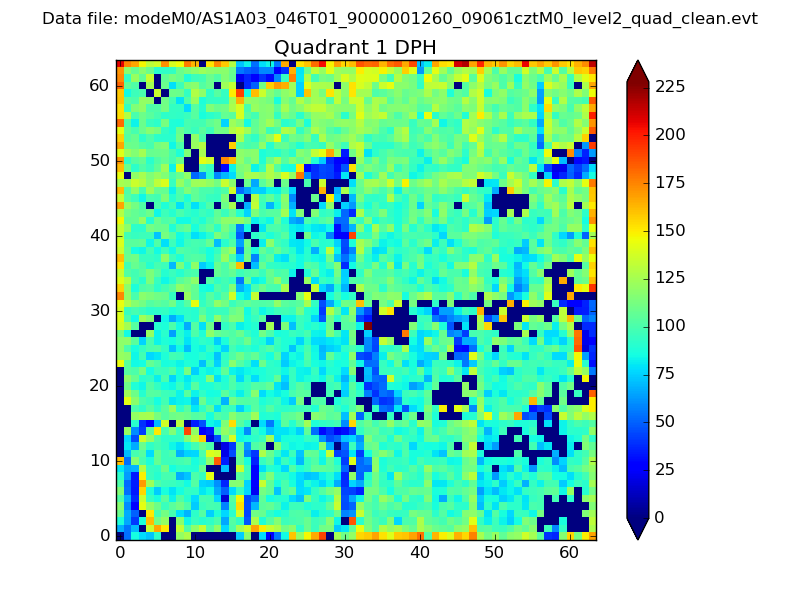
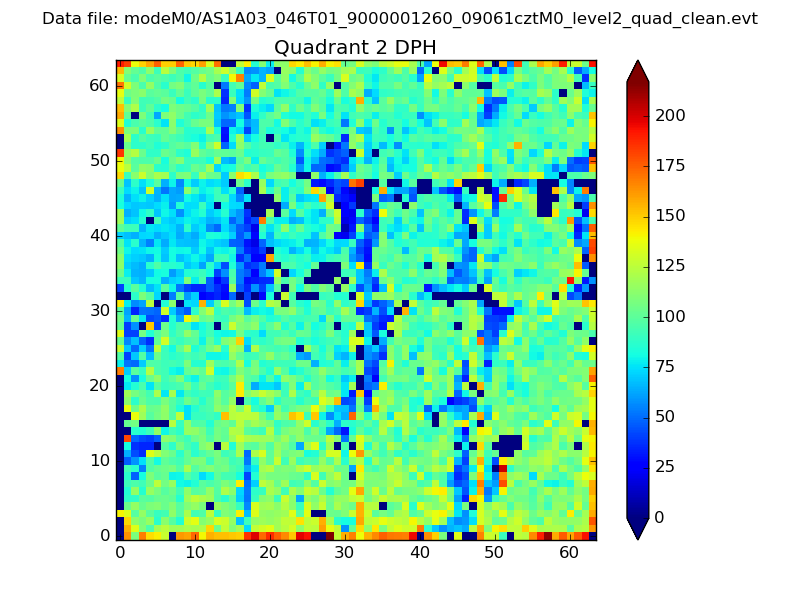
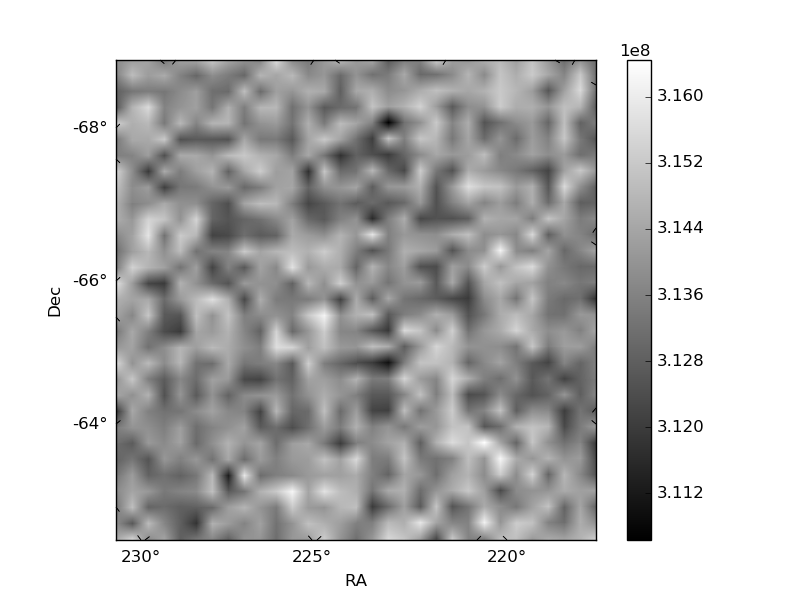
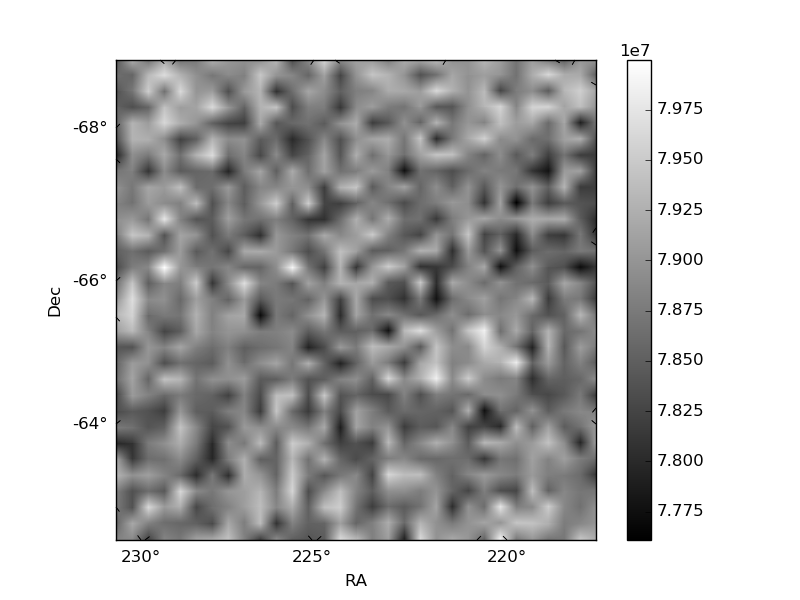
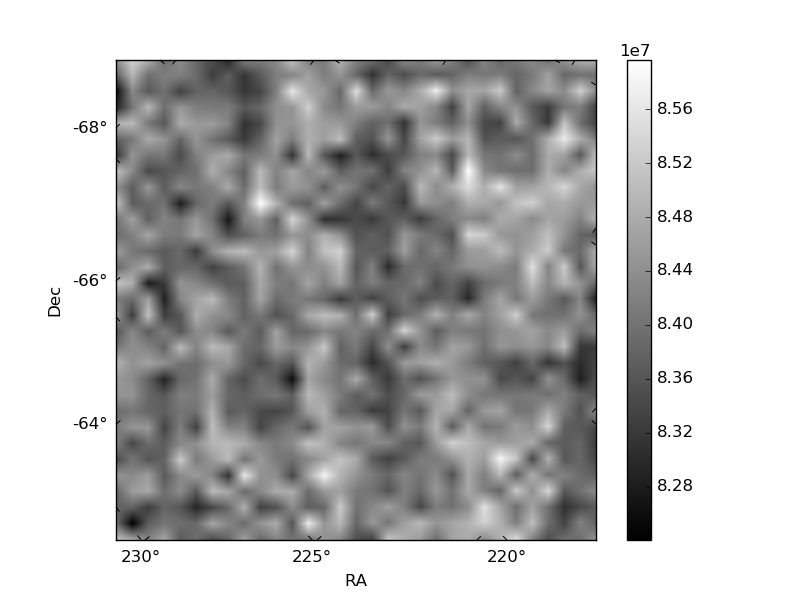
Histogram calculated using DETX and DETY for each event in the final _common_clean file
| Quadrant A | 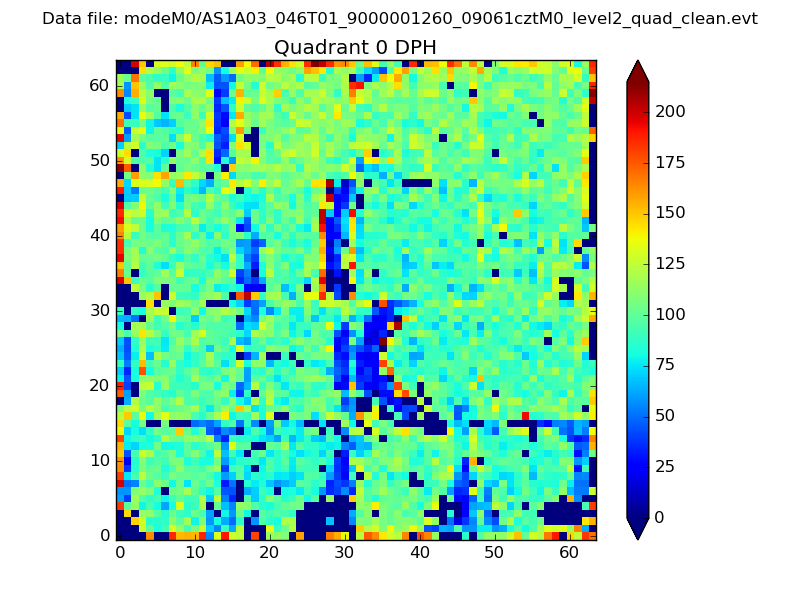 |
 |
Quadrant B |
|---|---|---|---|
| Quadrant D | 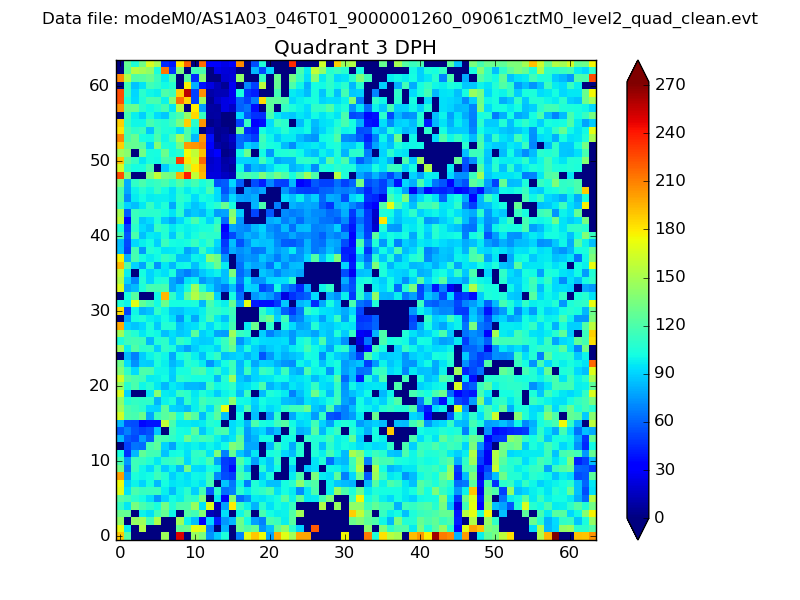 |
 |
Quadrant C |
| Plot type | Count rate plots | Images |
|---|---|---|
| Comparison with Poisson distribution Blue bars denote a histogram of data divided into 1 sec bins. Red curve is a Poisson curve with rate = median count rate of data. |
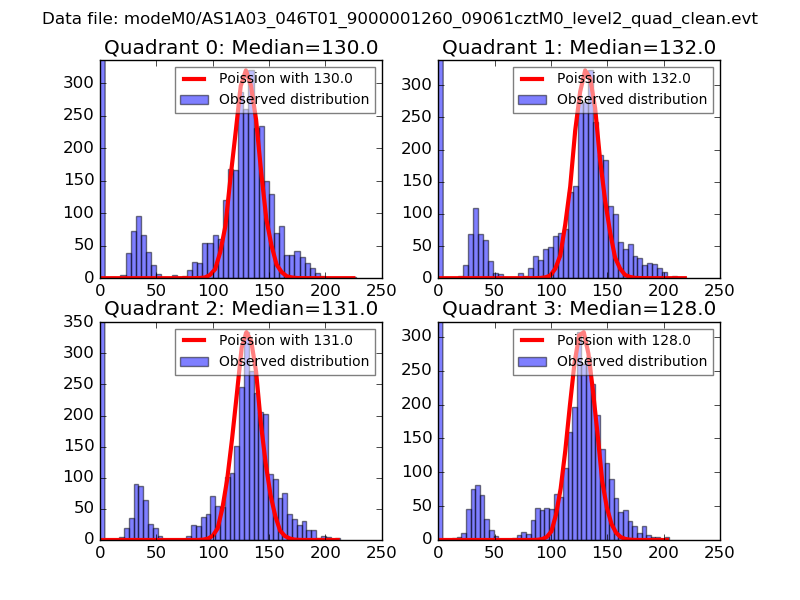 |
 |
| Quadrant-wise count rates Data is divided into 100 sec bins |
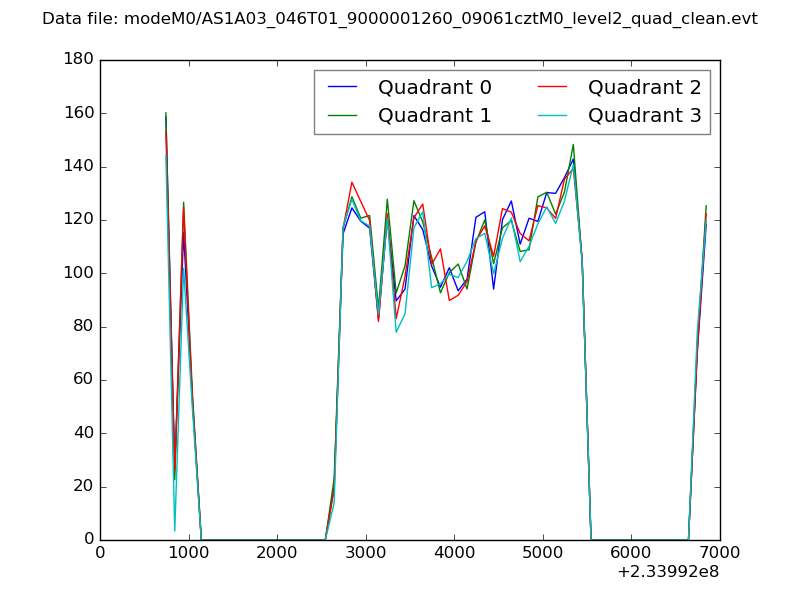 |
|
| Module-wise count rates for Quadrant A Data is divided into 100 sec bins |
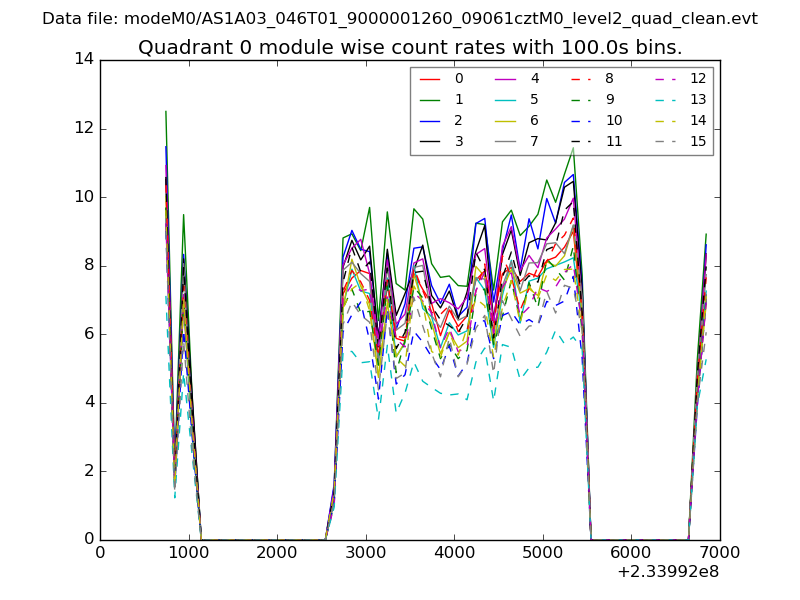 |
 |
| Module-wise count rates for Quadrant B Data is divided into 100 sec bins |
 |
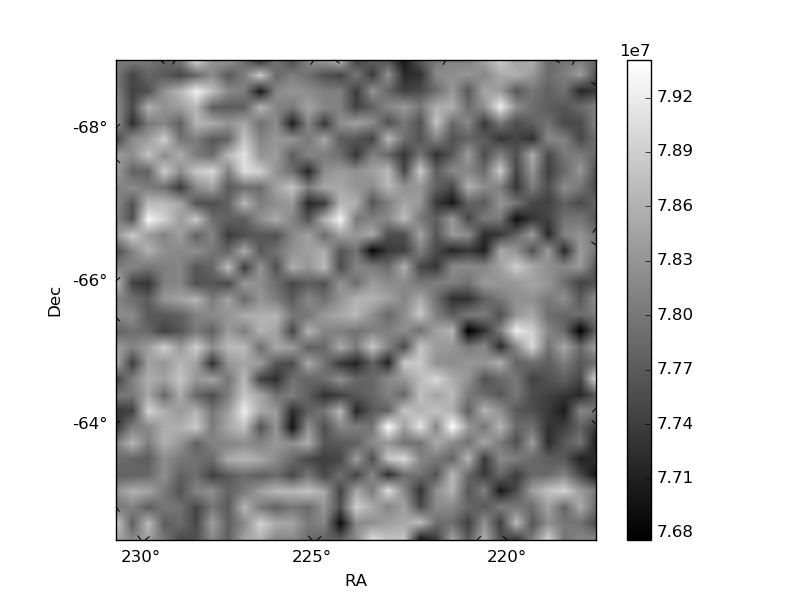 |
| Module-wise count rates for Quadrant C Data is divided into 100 sec bins |
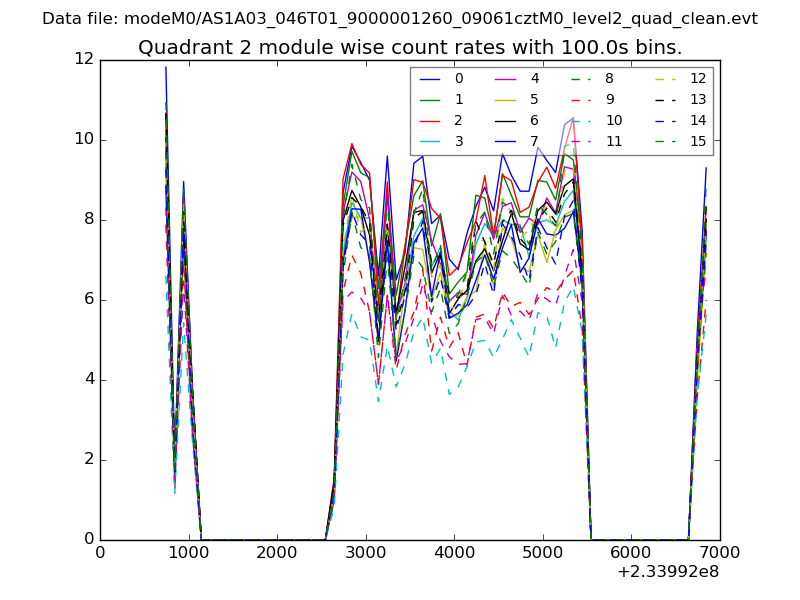 |
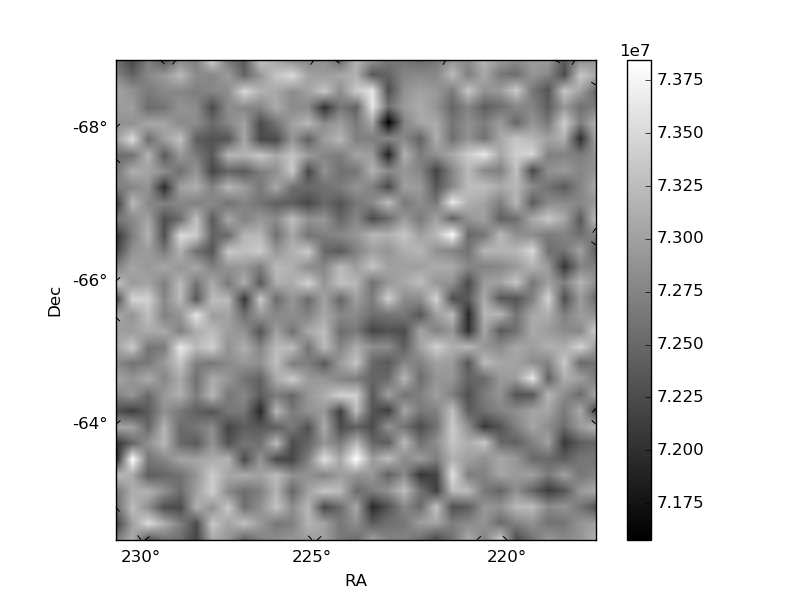 |
| Module-wise count rates for Quadrant D Data is divided into 100 sec bins |
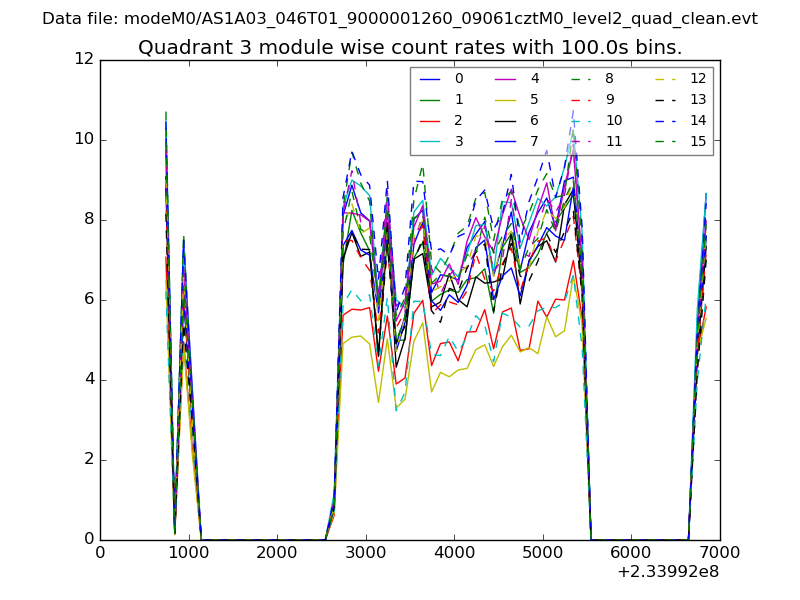 |
 |
| Parameter | Plot |
|---|---|
| CZT HV Monitor |  |
| D_VDD | 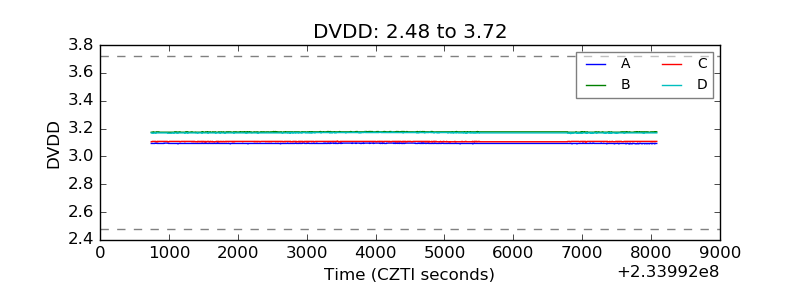 |
| Temperature 1 | 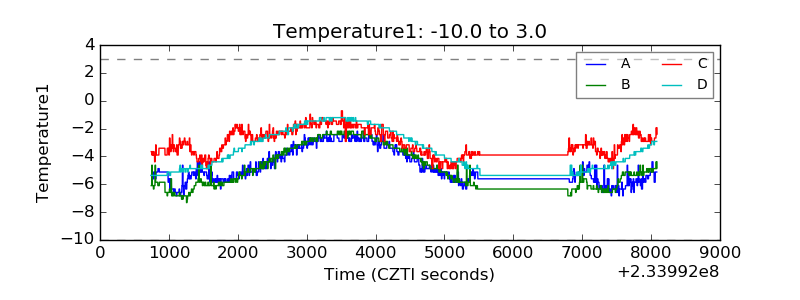 |
| Veto HV Monitor | 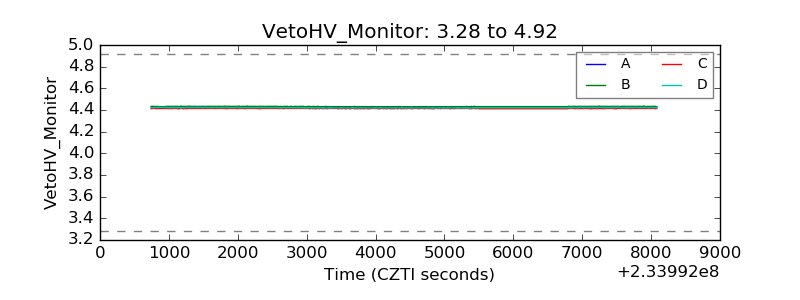 |
| Veto LLD | 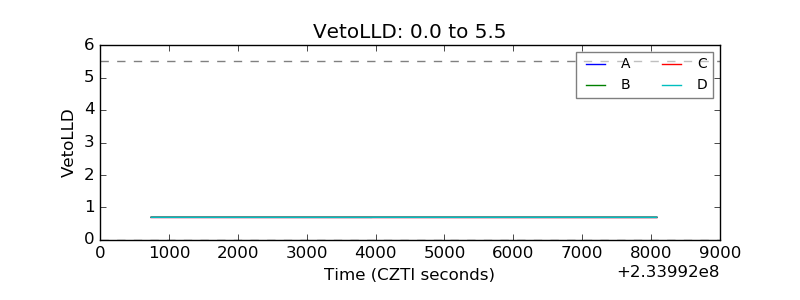 |
| Alpha Counter | 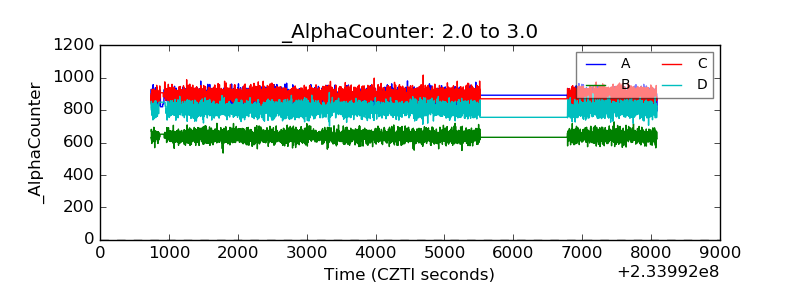 |
| _CPM_Rate | 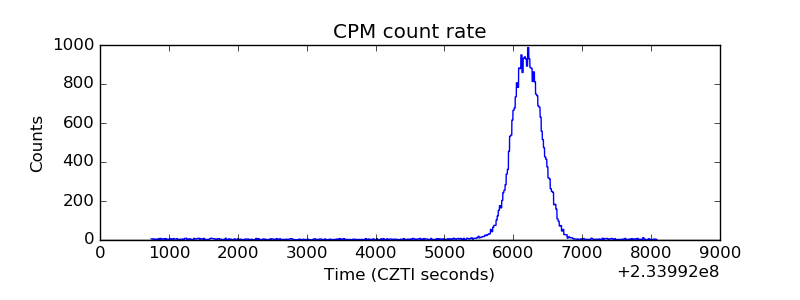 |
| CZT Counter | 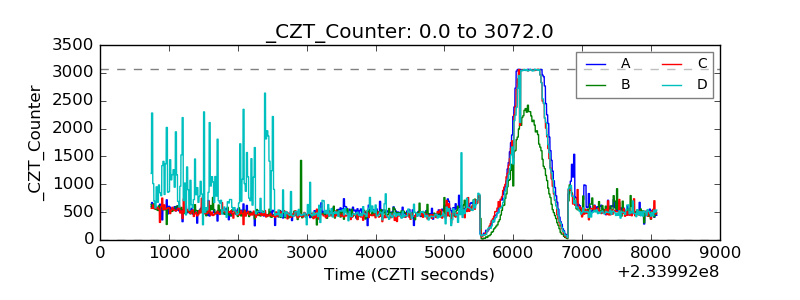 |
| +2.5 Volts monitor |  |
| +5 Volts monitor | 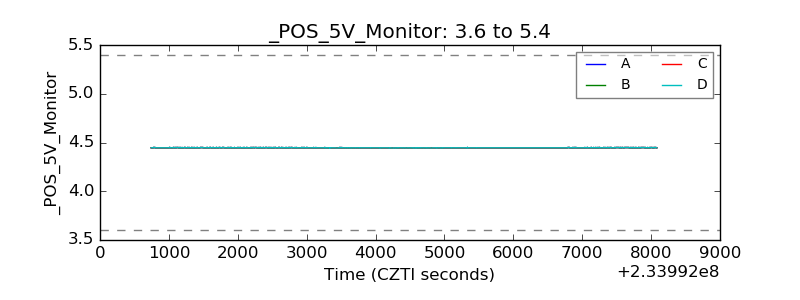 |
| _ROLL_ROT | 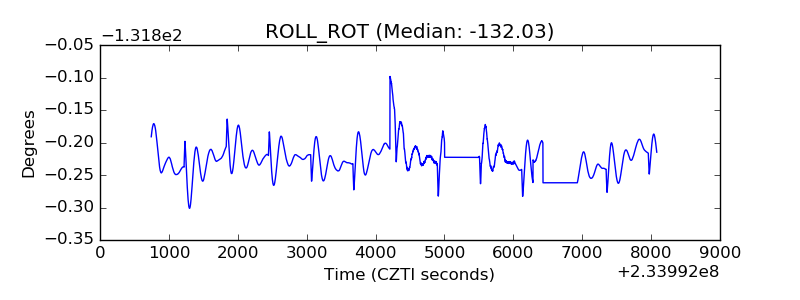 |
| _Roll_DEC | 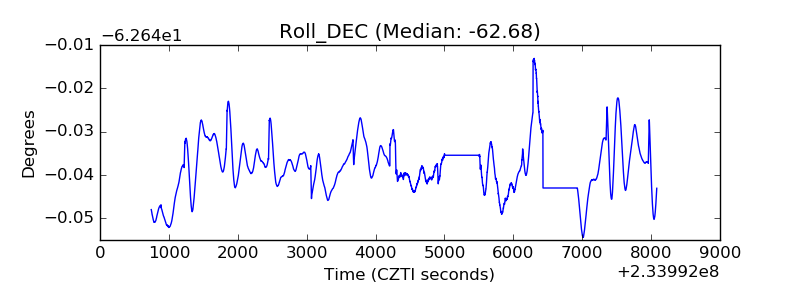 |
| _Roll_RA | 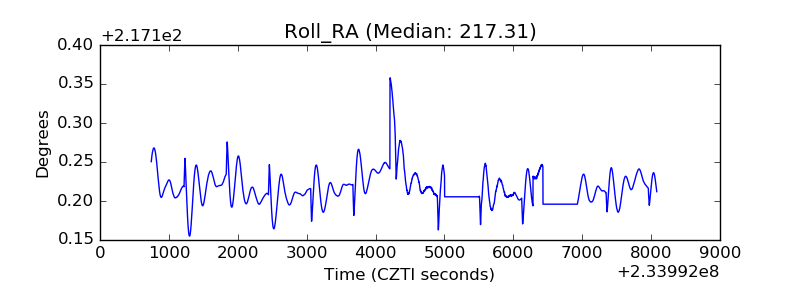 |
| Veto Counter | 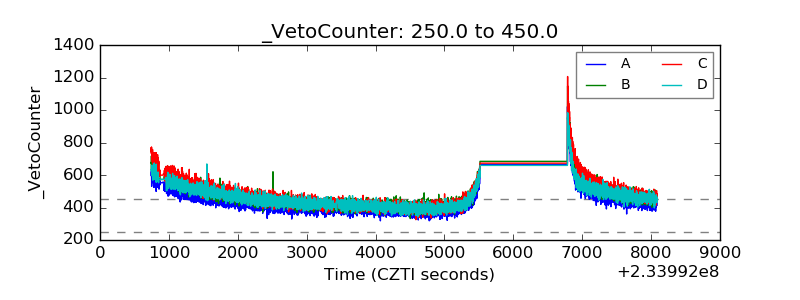 |