| Param | Original file | Final file |
|---|---|---|
| Filename | modeM0/AS1A03_046T01_9000001260_09062cztM0_level2.evt | modeM0/AS1A03_046T01_9000001260_09062cztM0_level2_quad_clean.evt |
| Size (bytes) | 471,340,800 | 74,747,520 |
| Size | 449.5 MB | 71.3 MB |
| Events in quadrant A | 3,601,603 | 453,052 |
| Events in quadrant B | 3,728,898 | 455,073 |
| Events in quadrant C | 3,087,398 | 461,125 |
| Events in quadrant D | 3,420,689 | 446,495 |
| Mode SS | |||
|---|---|---|---|
| Quadrant | BADHDUFLAG | Total packets | Discarded packets |
| A | 0 | 135 | 7 |
| B | 0 | 136 | 4 |
| C | 0 | 136 | 6 |
| D | 0 | 136 | 6 |
| Mode M9 | |||
|---|---|---|---|
| Quadrant | BADHDUFLAG | Total packets | Discarded packets |
| A | 0 | 23 | 0 |
| B | 0 | 23 | 0 |
| C | 0 | 23 | 0 |
| D | 0 | 23 | 0 |
| Mode M0 | |||
|---|---|---|---|
| Quadrant | BADHDUFLAG | Total packets | Discarded packets |
| A | 0 | 15020 | 462 |
| B | 0 | 15680 | 581 |
| C | 0 | 13705 | 304 |
| D | 0 | 14689 | 409 |
| Quadrant | Total seconds | Saturated seconds | Saturation percentage |
|---|---|---|---|
| A | 6401 | 246 | 3.843150% |
| B | 6389 | 261 | 4.085146% |
| C | 6450 | 187 | 2.899225% |
| D | 6419 | 230 | 3.583113% |
Noise dominated data is calculated using 1-second bins in cleaned event files. If a bin has >2000 counts, and if more than 50% of those come from <1% of pixels, then it is considered to be noise-dominated and hence unusable.
| Quadrant | # 1 sec bins | Bins with >0 counts | Bins with >2000 counts | High rate bins dominated by noise | Noise dominated (total time) | Noise dominated (detector-on time) | Marked lightcurve |
|---|---|---|---|---|---|---|---|
| A | 8933 | 6564 | 4 | 4 | 0.04% | 0.06% | 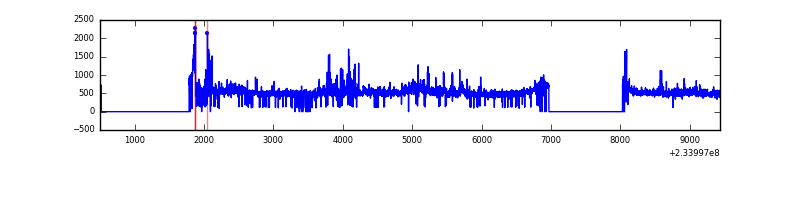 |
| B | 8935 | 6564 | 18 | 18 | 0.20% | 0.27% | 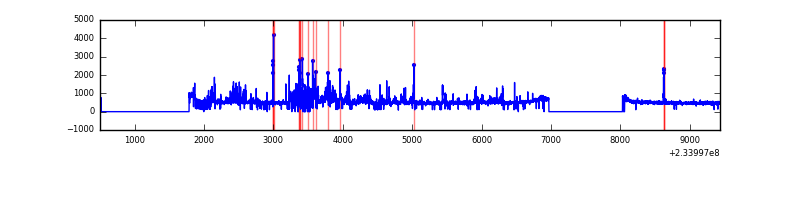 |
| C | 8933 | 6562 | 2 | 2 | 0.02% | 0.03% |  |
| D | 8935 | 6572 | 30 | 30 | 0.34% | 0.46% | 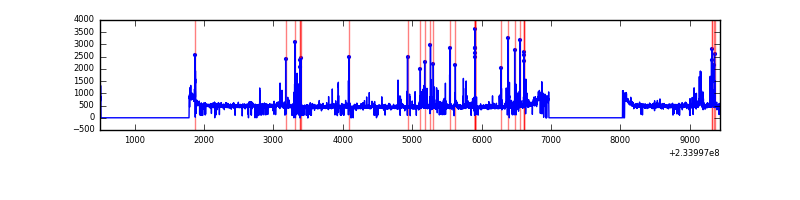 |
Top three noisy pixels from each quadrant. If the there are fewer than three noisy pixels in the level2.evt file, extra rows are filled as -1
| Pixel properties | Quadrant properties | ||||||
|---|---|---|---|---|---|---|---|
| Quadrant | DetID | PixID | Counts | Sigma | Mean | Median | Sigma |
| A | 8 | 5 | 456020 | 2874.41 | 793 | 776 | 158.4 |
| A | 15 | 174 | 44728 | 277.51 | 793 | 776 | 158.4 |
| A | 15 | 239 | 22429 | 136.72 | 793 | 776 | 158.4 |
| B | 10 | 16 | 563656 | 3785.35 | 795 | 777 | 148.7 |
| B | 0 | 219 | 24416 | 158.97 | 795 | 777 | 148.7 |
| B | 12 | 111 | 15767 | 100.81 | 795 | 777 | 148.7 |
| C | 14 | 234 | 8032 | 40.26 | 788 | 791 | 179.9 |
| C | 13 | 61 | 5995 | 28.93 | 788 | 791 | 179.9 |
| C | 12 | 4 | 4199 | 18.95 | 788 | 791 | 179.9 |
| D | 1 | 52 | 209721 | 1088.86 | 782 | 760 | 191.9 |
| D | 2 | 14 | 89533 | 462.58 | 782 | 760 | 191.9 |
| D | 12 | 233 | 52879 | 271.58 | 782 | 760 | 191.9 |
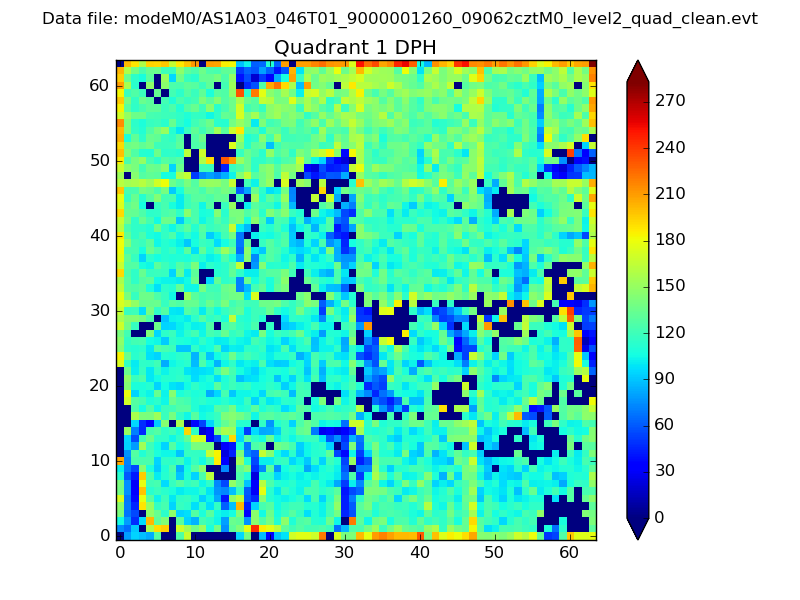
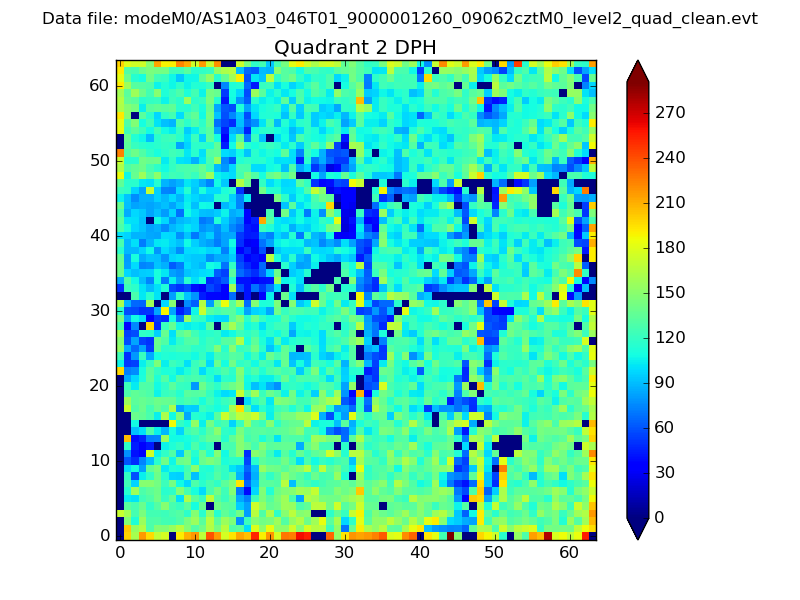
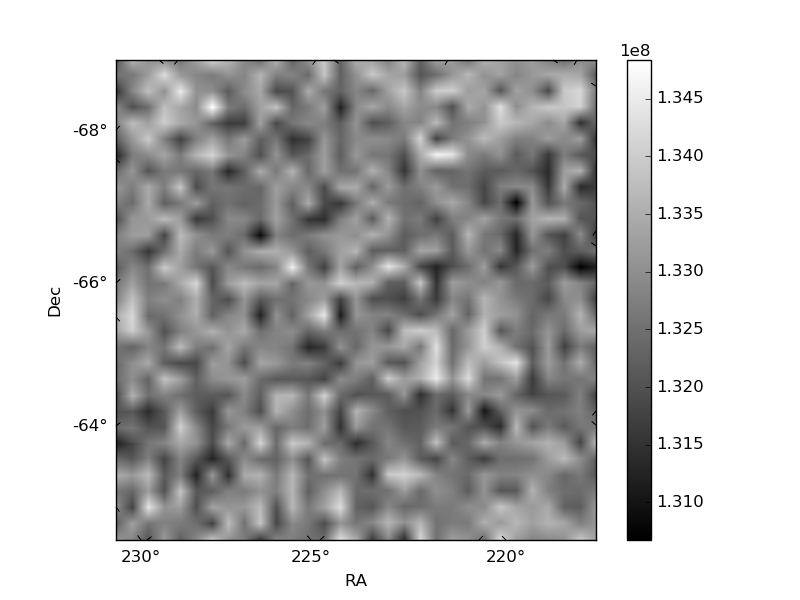
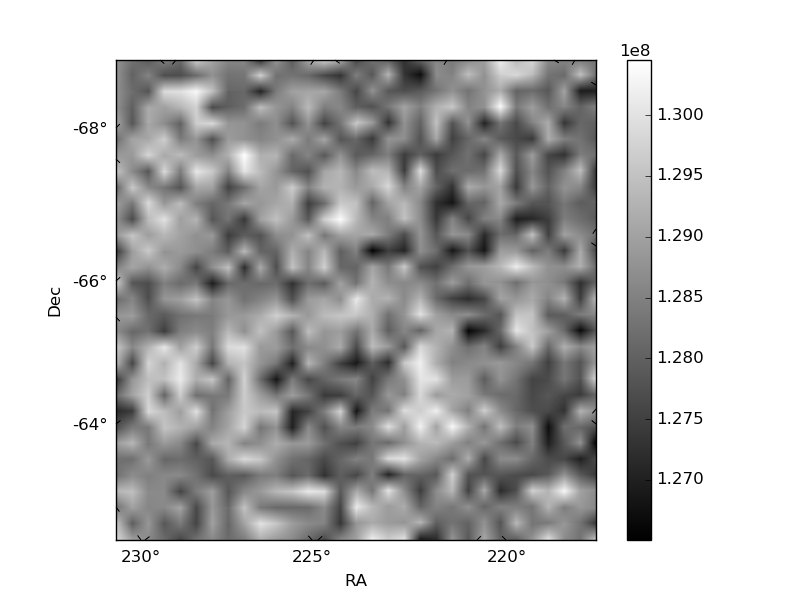
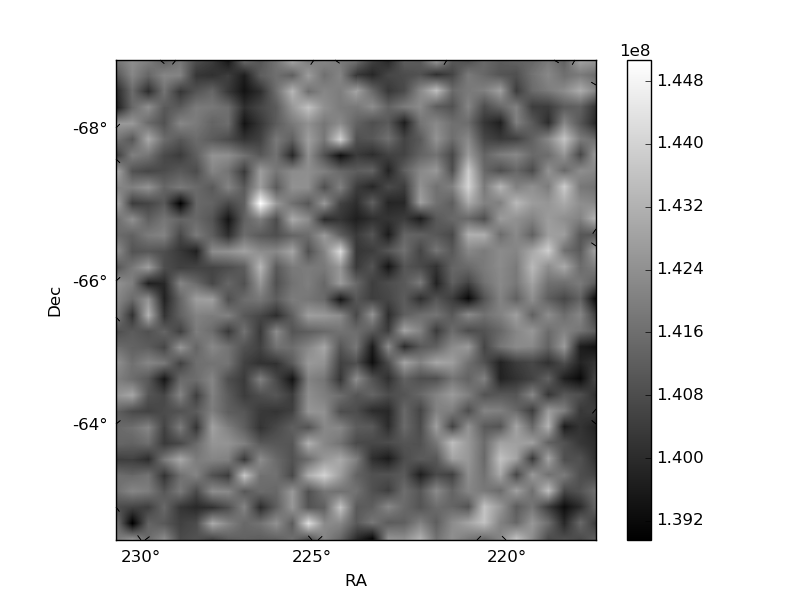
Histogram calculated using DETX and DETY for each event in the final _common_clean file
| Quadrant A |  |
 |
Quadrant B |
|---|---|---|---|
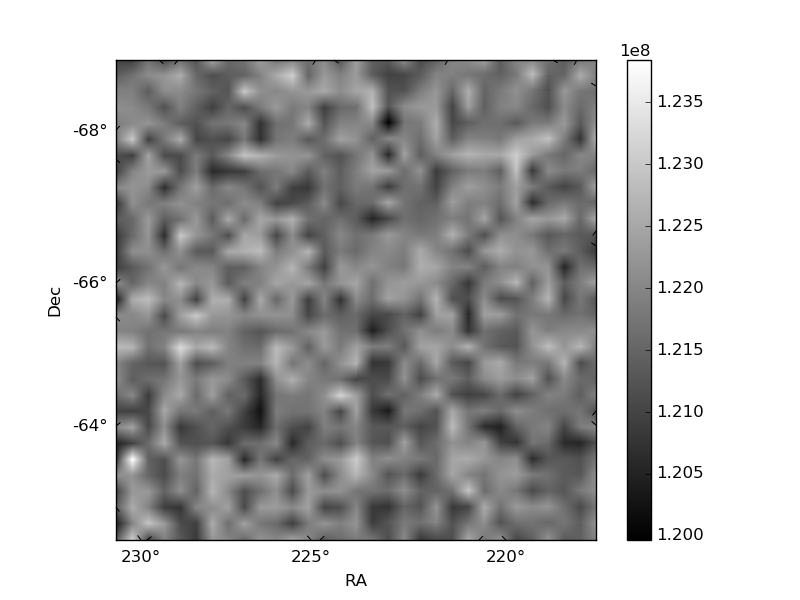
| Quadrant D | 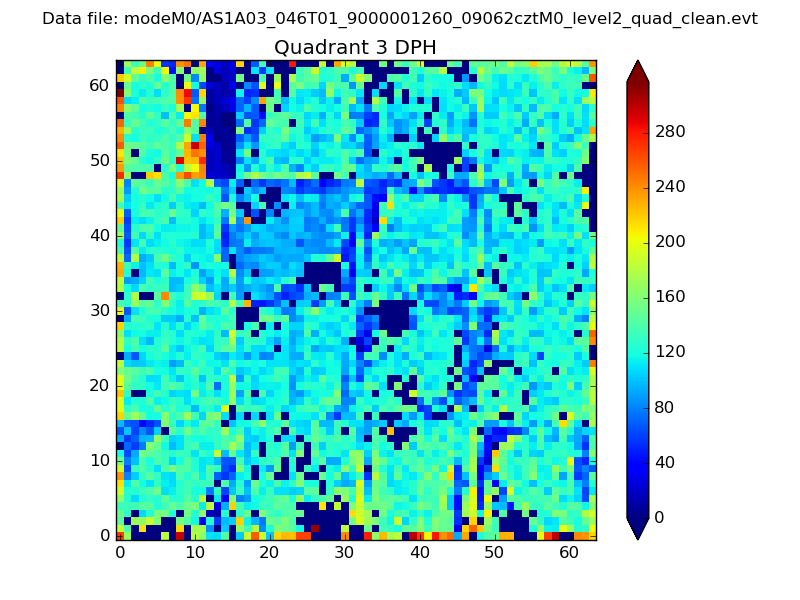 |
 |
Quadrant C |
| Plot type | Count rate plots | Images |
|---|---|---|
| Comparison with Poisson distribution Blue bars denote a histogram of data divided into 1 sec bins. Red curve is a Poisson curve with rate = median count rate of data. |
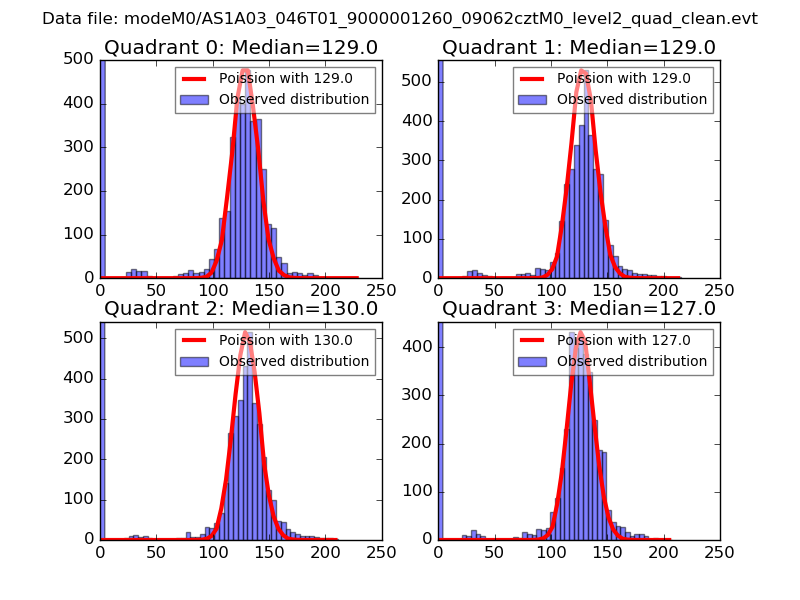 |
 |
| Quadrant-wise count rates Data is divided into 100 sec bins |
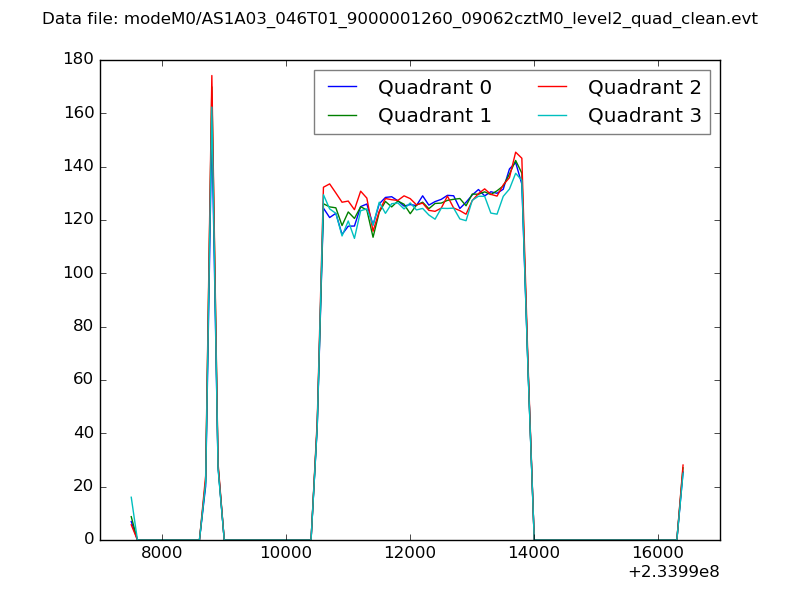 |
|
| Module-wise count rates for Quadrant A Data is divided into 100 sec bins |
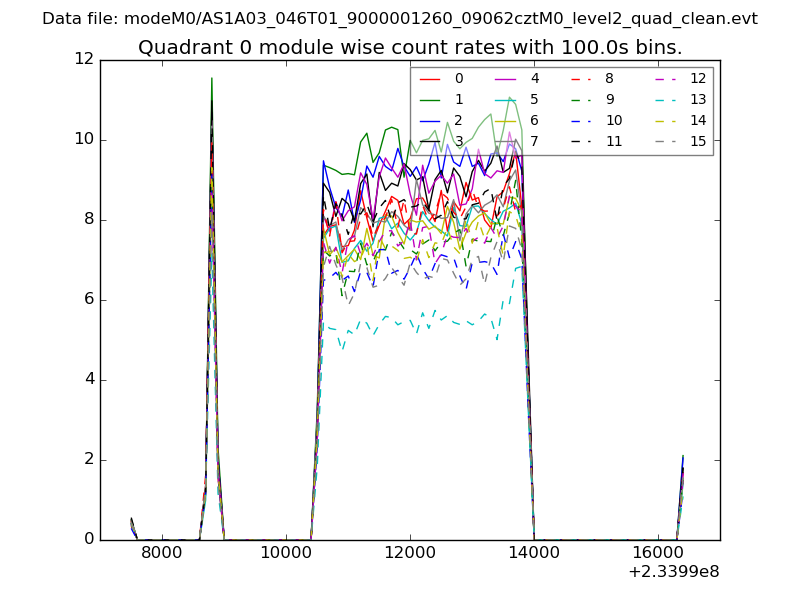 |
 |
| Module-wise count rates for Quadrant B Data is divided into 100 sec bins |
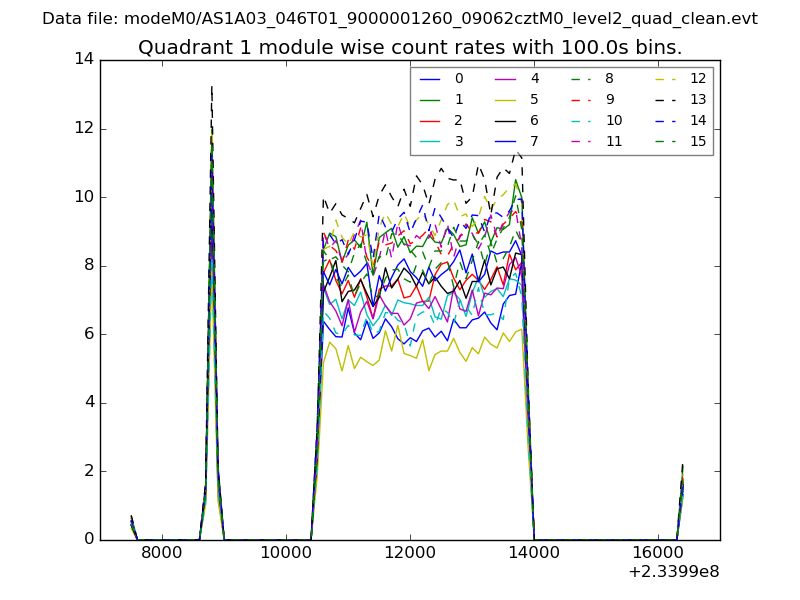 |
 |
| Module-wise count rates for Quadrant C Data is divided into 100 sec bins |
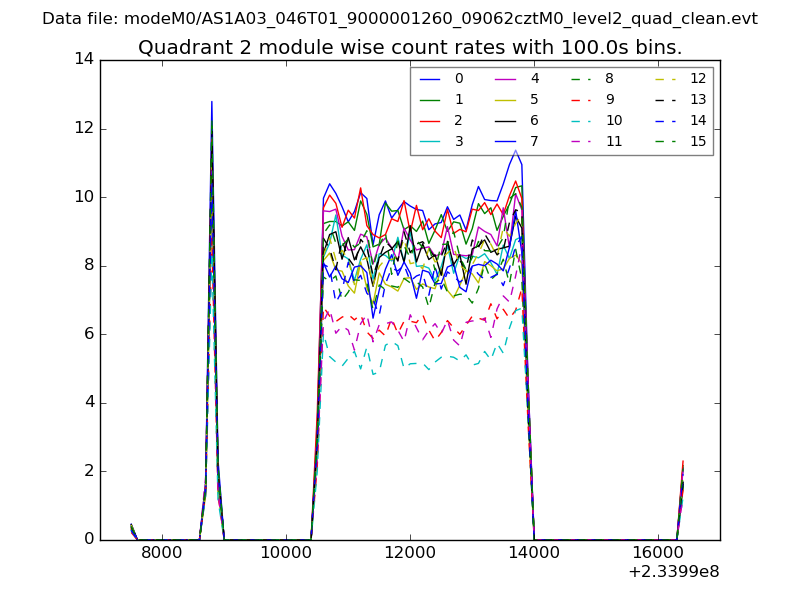 |
 |
| Module-wise count rates for Quadrant D Data is divided into 100 sec bins |
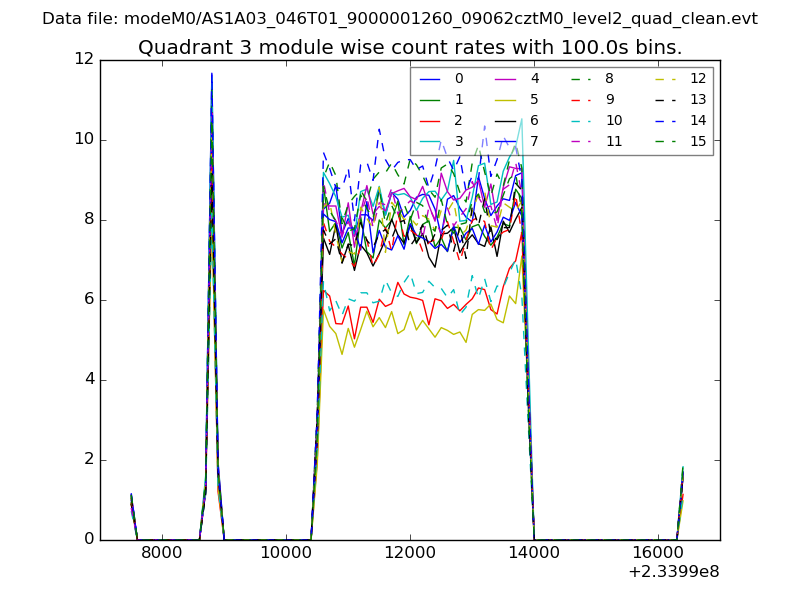 |
 |
| Parameter | Plot |
|---|---|
| CZT HV Monitor | 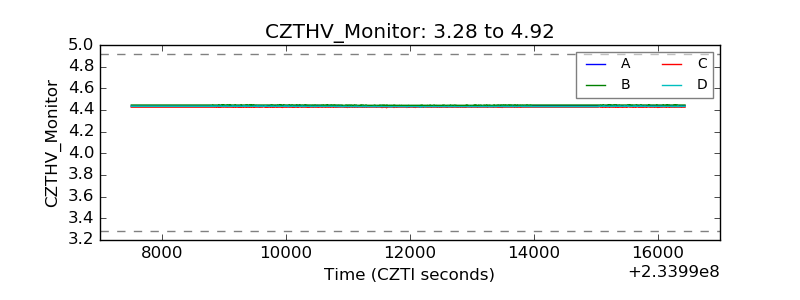 |
| D_VDD | 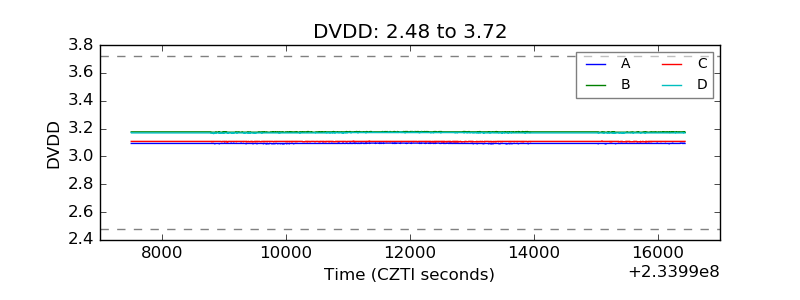 |
| Temperature 1 | 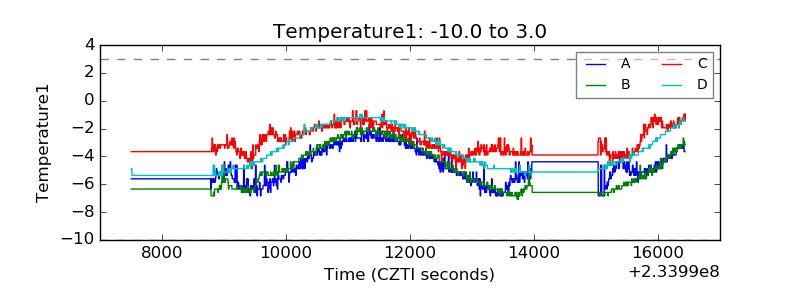 |
| Veto HV Monitor | 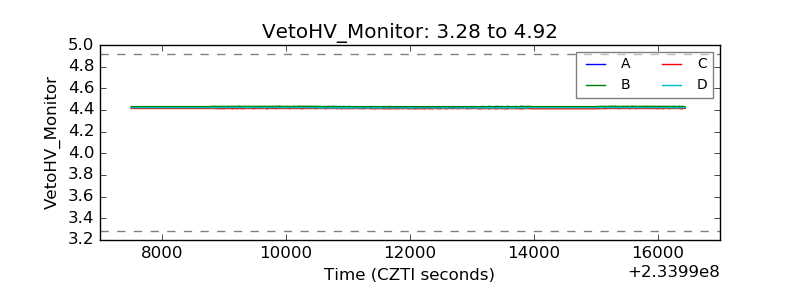 |
| Veto LLD | 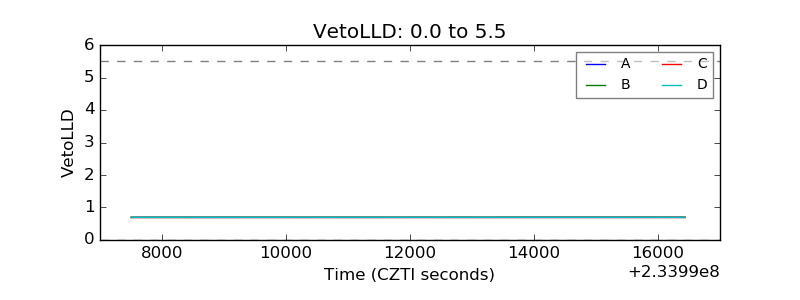 |
| Alpha Counter | 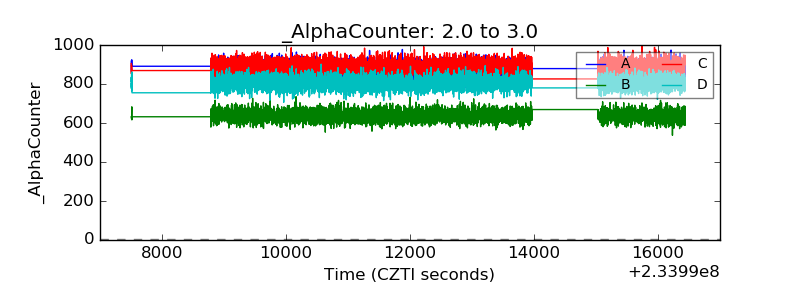 |
| _CPM_Rate | 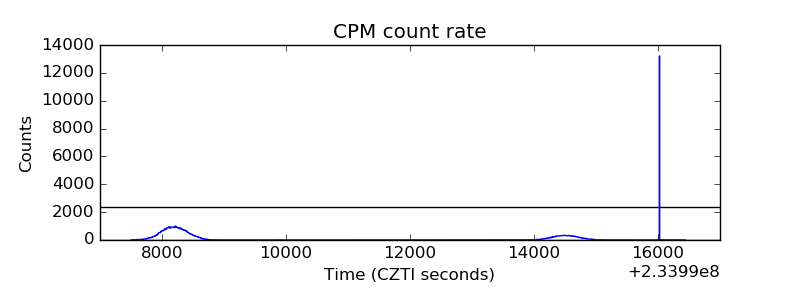 |
| CZT Counter |  |
| +2.5 Volts monitor |  |
| +5 Volts monitor | 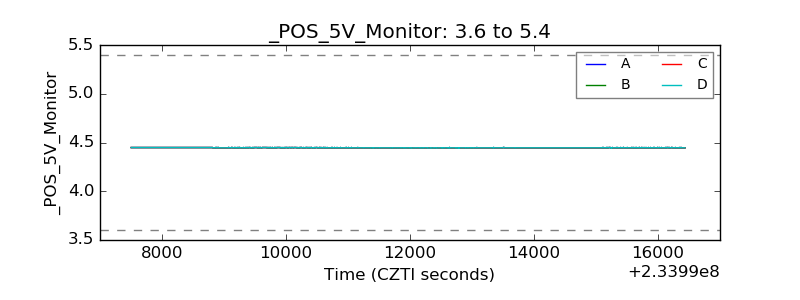 |
| _ROLL_ROT | 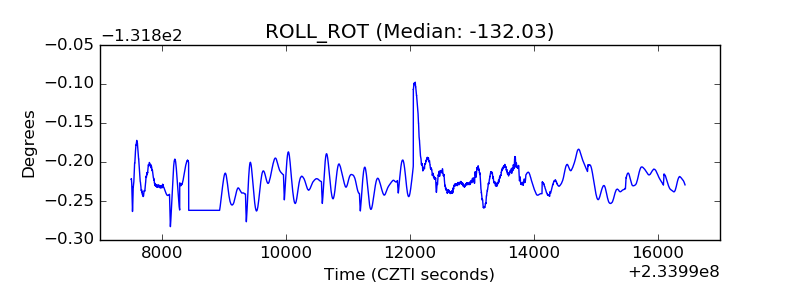 |
| _Roll_DEC | 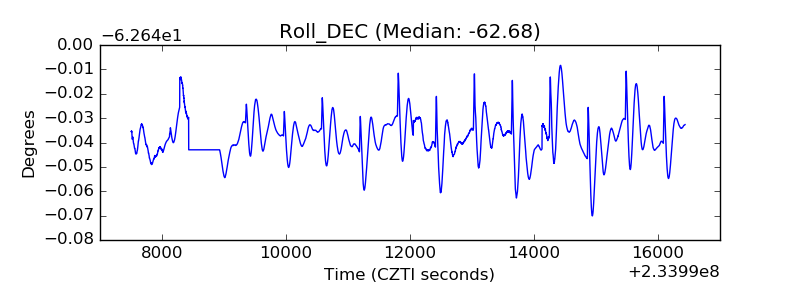 |
| _Roll_RA | 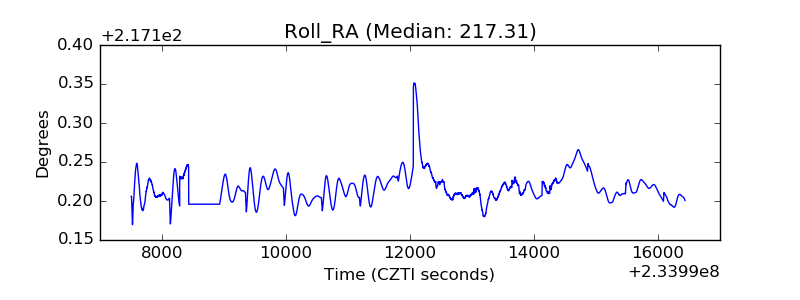 |
| Veto Counter | 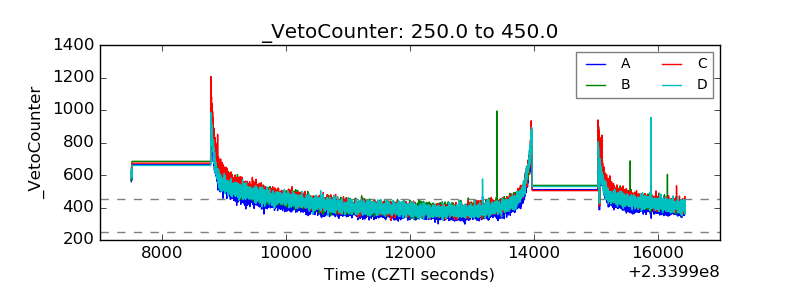 |