| Param | Original file | Final file |
|---|---|---|
| Filename | modeM0/AS1A03_046T01_9000001260_09064cztM0_level2.evt | modeM0/AS1A03_046T01_9000001260_09064cztM0_level2_quad_clean.evt |
| Size (bytes) | 1,230,145,920 | 237,672,000 |
| Size | 1.1 GB | 226.7 MB |
| Events in quadrant A | 9,104,712 | 1,514,786 |
| Events in quadrant B | 9,292,906 | 1,521,927 |
| Events in quadrant C | 7,896,162 | 1,516,912 |
| Events in quadrant D | 9,790,550 | 1,452,482 |
| Mode SS | |||
|---|---|---|---|
| Quadrant | BADHDUFLAG | Total packets | Discarded packets |
| A | 0 | 366 | 14 |
| B | 0 | 366 | 24 |
| C | 0 | 366 | 12 |
| D | 0 | 366 | 6 |
| Mode M9 | |||
|---|---|---|---|
| Quadrant | BADHDUFLAG | Total packets | Discarded packets |
| A | 0 | 22 | 1 |
| B | 0 | 22 | 0 |
| C | 0 | 22 | 0 |
| D | 0 | 22 | 3 |
| Mode M0 | |||
|---|---|---|---|
| Quadrant | BADHDUFLAG | Total packets | Discarded packets |
| A | 0 | 39596 | 1665 |
| B | 0 | 40547 | 1625 |
| C | 0 | 37074 | 1356 |
| D | 0 | 42994 | 2432 |
| Quadrant | Total seconds | Saturated seconds | Saturation percentage |
|---|---|---|---|
| A | 17292 | 506 | 2.926209% |
| B | 17344 | 564 | 3.251845% |
| C | 17361 | 405 | 2.332815% |
| D | 17174 | 635 | 3.697450% |
Noise dominated data is calculated using 1-second bins in cleaned event files. If a bin has >2000 counts, and if more than 50% of those come from <1% of pixels, then it is considered to be noise-dominated and hence unusable.
| Quadrant | # 1 sec bins | Bins with >0 counts | Bins with >2000 counts | High rate bins dominated by noise | Noise dominated (total time) | Noise dominated (detector-on time) | Marked lightcurve |
|---|---|---|---|---|---|---|---|
| A | 20158 | 17866 | 10 | 10 | 0.05% | 0.06% |  |
| B | 20158 | 17873 | 33 | 33 | 0.16% | 0.18% |  |
| C | 20158 | 17905 | 4 | 4 | 0.02% | 0.02% | 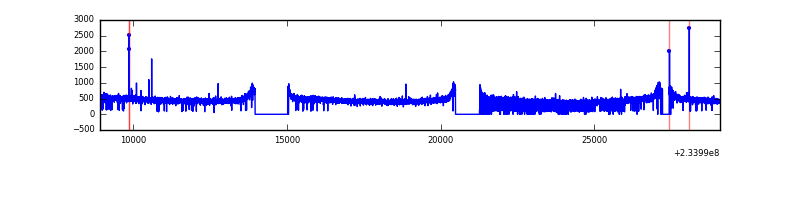 |
| D | 20158 | 17842 | 197 | 197 | 0.98% | 1.10% | 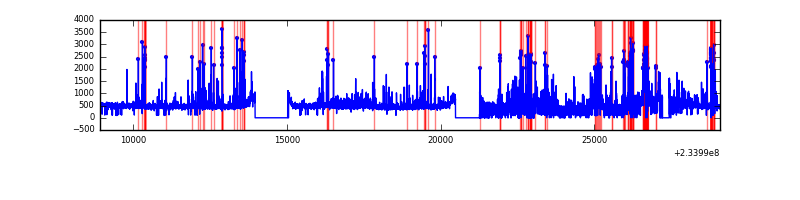 |
Top three noisy pixels from each quadrant. If the there are fewer than three noisy pixels in the level2.evt file, extra rows are filled as -1
| Pixel properties | Quadrant properties | ||||||
|---|---|---|---|---|---|---|---|
| Quadrant | DetID | PixID | Counts | Sigma | Mean | Median | Sigma |
| A | 8 | 5 | 968713 | 2346.88 | 2061 | 2015 | 411.9 |
| A | 1 | 162 | 52759 | 123.19 | 2061 | 2015 | 411.9 |
| A | 5 | 16 | 44344 | 102.76 | 2061 | 2015 | 411.9 |
| B | 10 | 16 | 959250 | 2478.66 | 2069 | 2016 | 386.2 |
| B | 4 | 48 | 57582 | 143.88 | 2069 | 2016 | 386.2 |
| B | 0 | 219 | 54250 | 135.25 | 2069 | 2016 | 386.2 |
| C | 13 | 61 | 15415 | 29.22 | 2017 | 2021 | 458.4 |
| C | 14 | 234 | 11777 | 21.28 | 2017 | 2021 | 458.4 |
| C | 12 | 4 | 11037 | 19.67 | 2017 | 2021 | 458.4 |
| D | 1 | 52 | 993106 | 1934.83 | 1982 | 1929 | 512.3 |
| D | 2 | 14 | 422280 | 820.55 | 1982 | 1929 | 512.3 |
| D | 12 | 233 | 290861 | 564.01 | 1982 | 1929 | 512.3 |
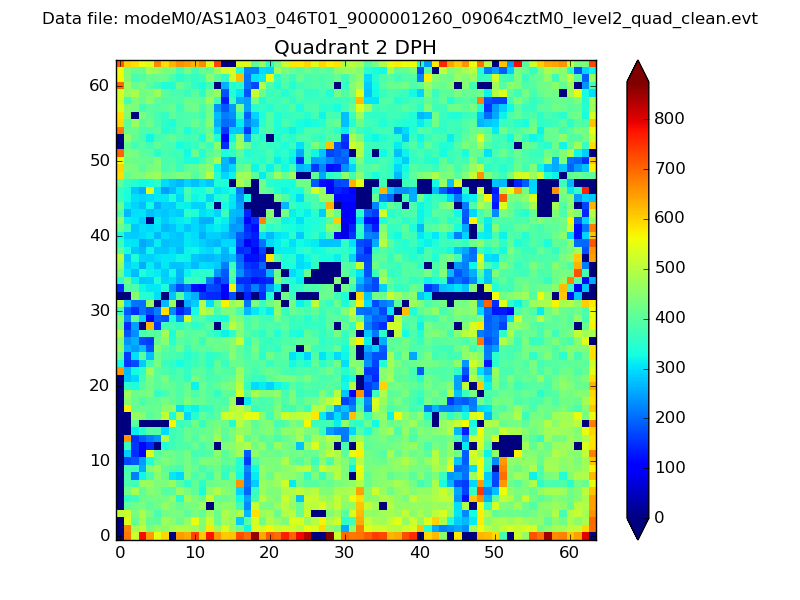
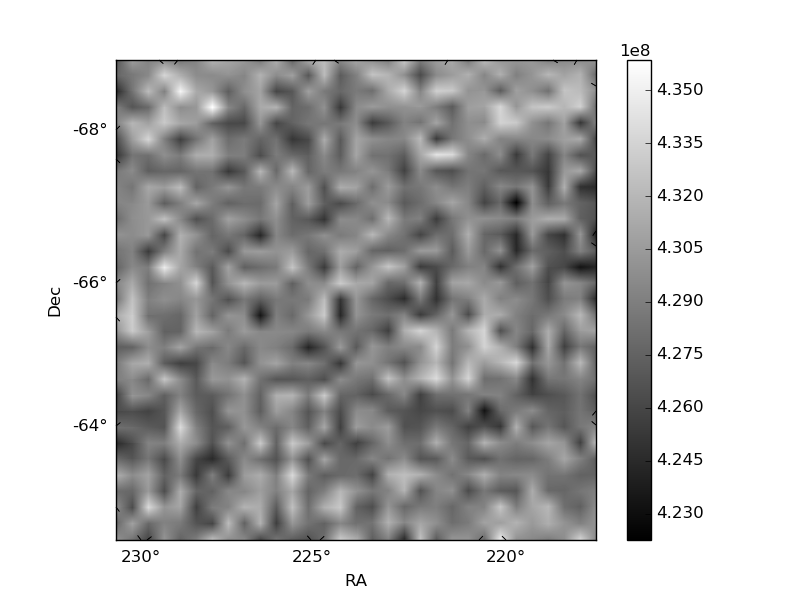
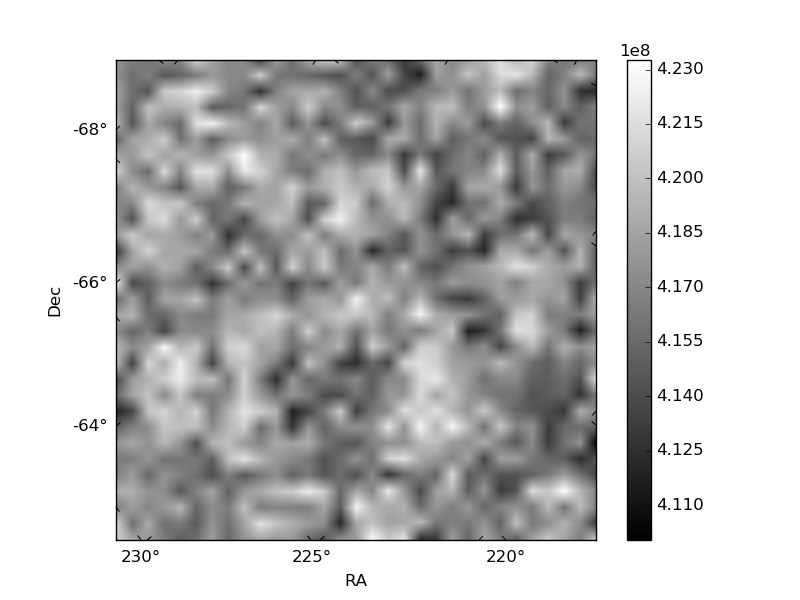
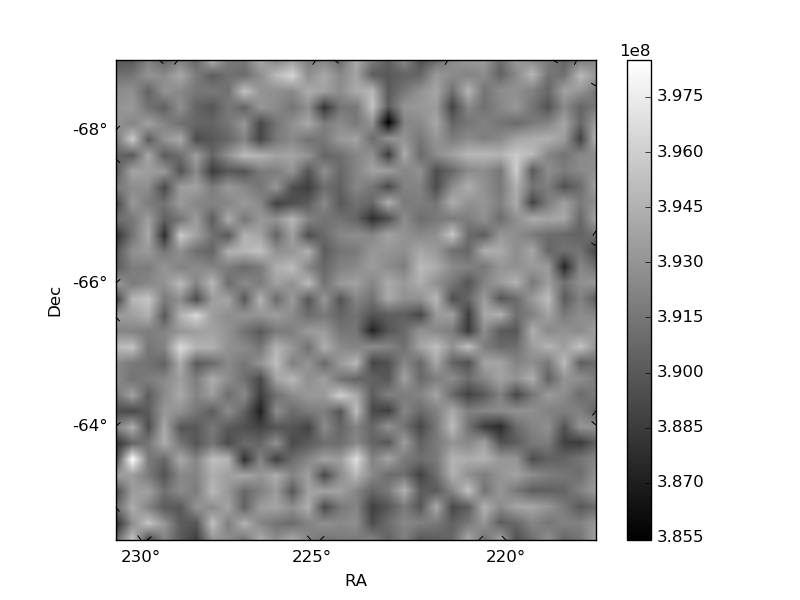
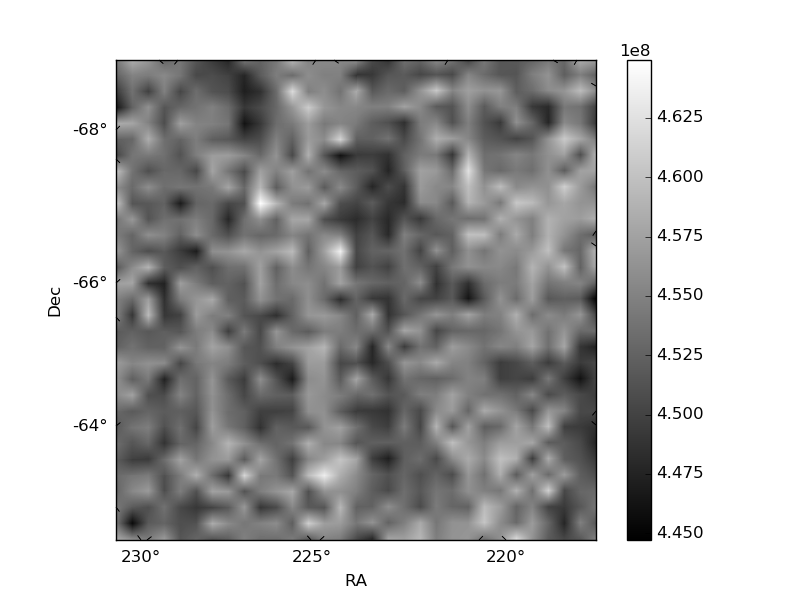
Histogram calculated using DETX and DETY for each event in the final _common_clean file
| Quadrant A | 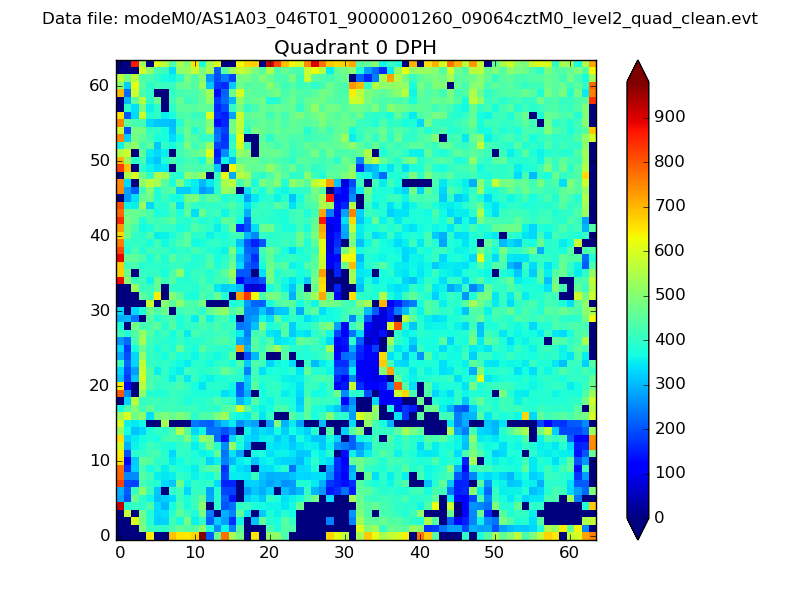 |
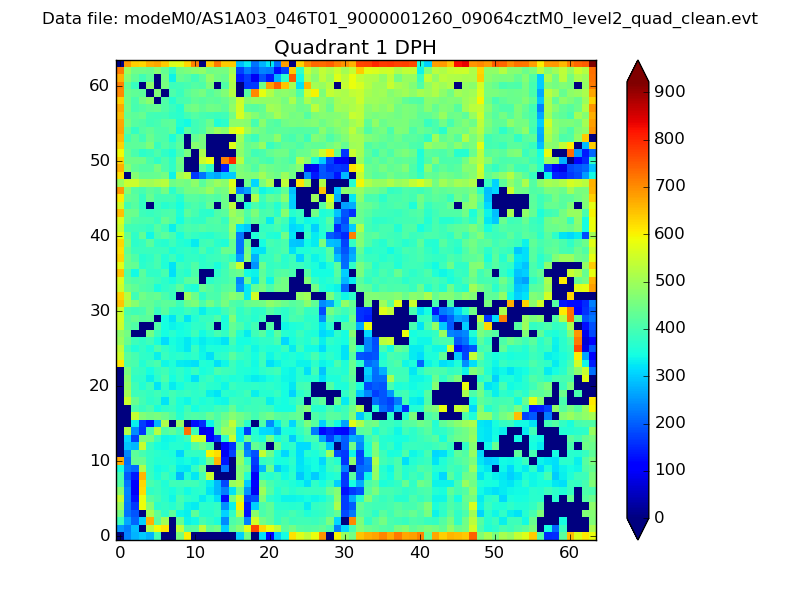 |
Quadrant B |
|---|---|---|---|
| Quadrant D | 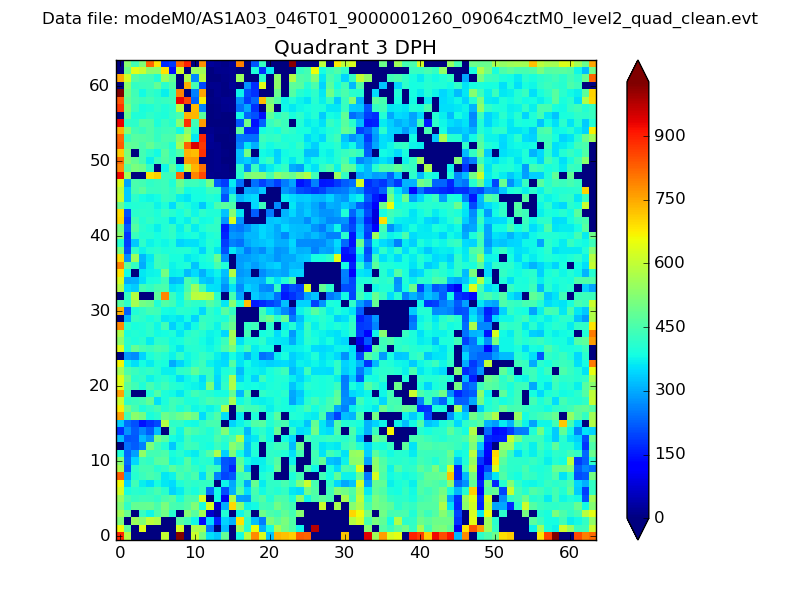 |
 |
Quadrant C |
| Plot type | Count rate plots | Images |
|---|---|---|
| Comparison with Poisson distribution Blue bars denote a histogram of data divided into 1 sec bins. Red curve is a Poisson curve with rate = median count rate of data. |
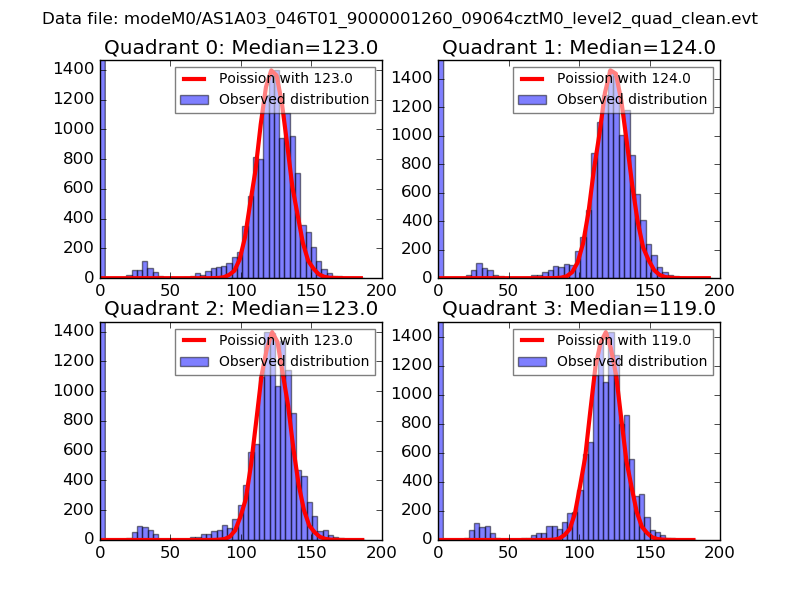 |
 |
| Quadrant-wise count rates Data is divided into 100 sec bins |
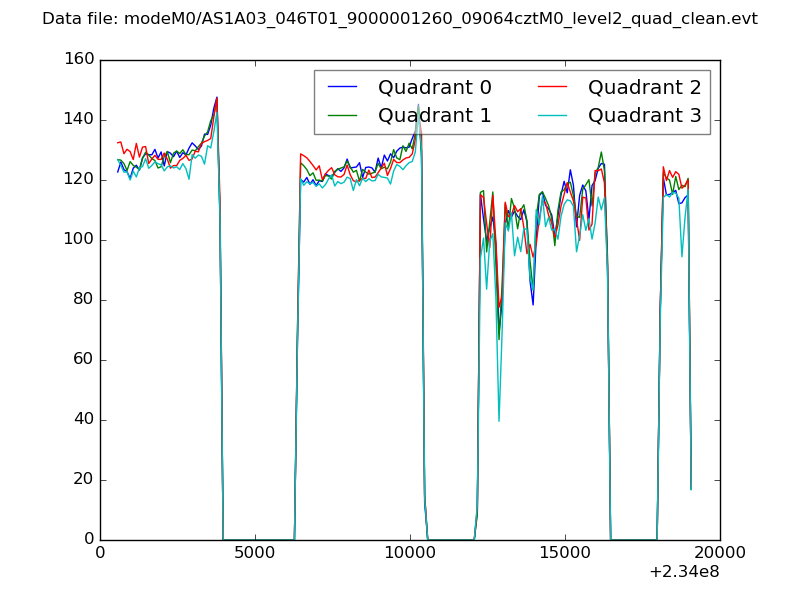 |
|
| Module-wise count rates for Quadrant A Data is divided into 100 sec bins |
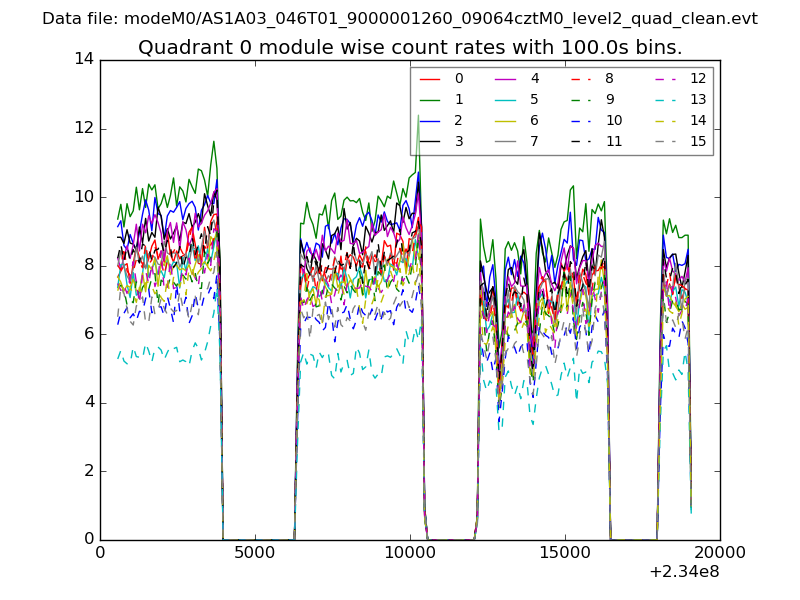 |
 |
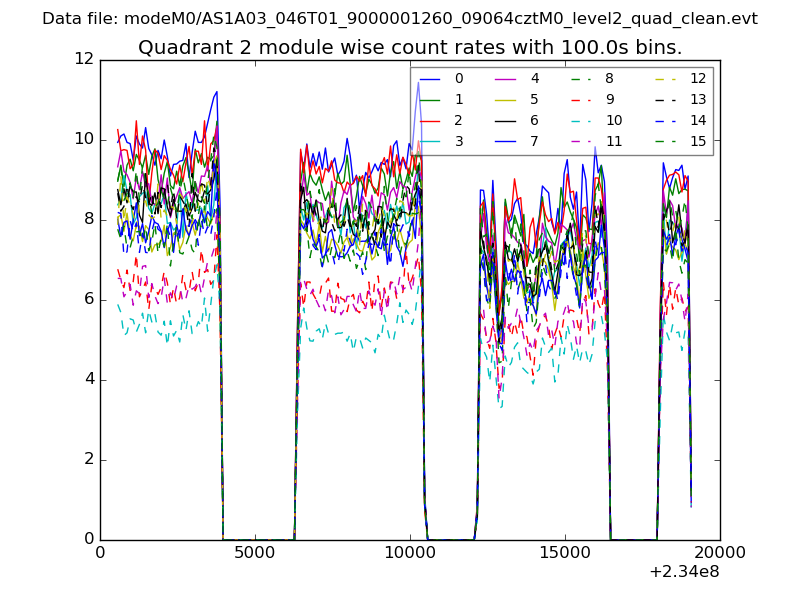
| Module-wise count rates for Quadrant B Data is divided into 100 sec bins |
 |
 |
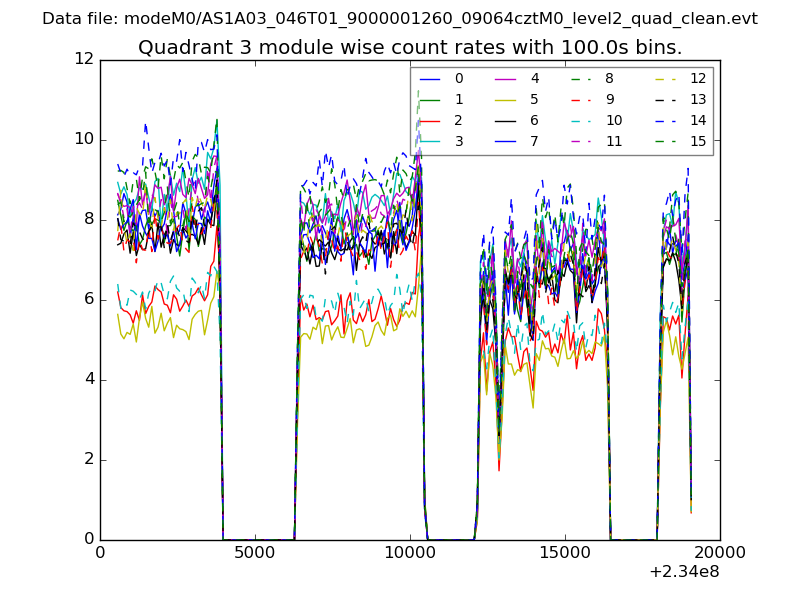
| Module-wise count rates for Quadrant C Data is divided into 100 sec bins |
 |
 |
| Module-wise count rates for Quadrant D Data is divided into 100 sec bins |
 |
 |
| Parameter | Plot |
|---|---|
| CZT HV Monitor | 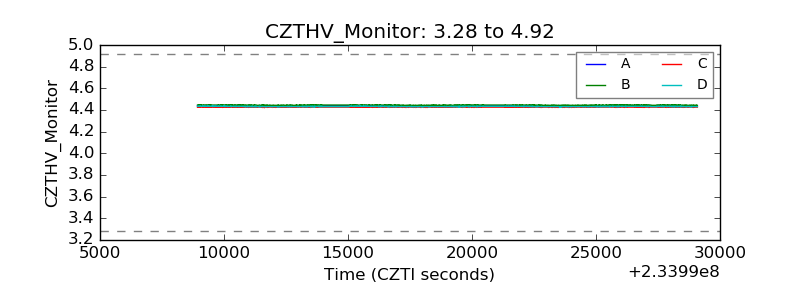 |
| D_VDD |  |
| Temperature 1 | 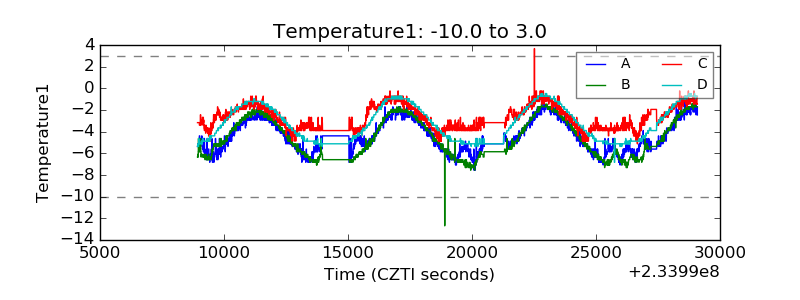 |
| Veto HV Monitor | 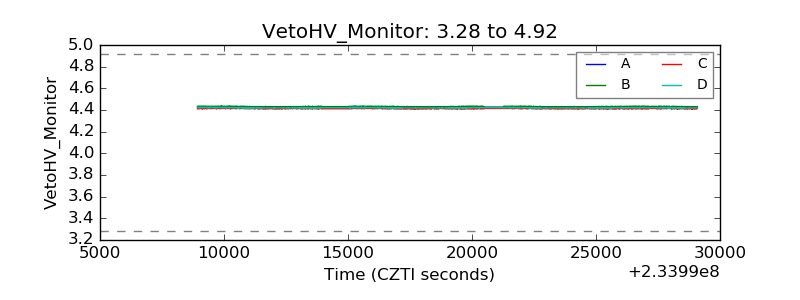 |
| Veto LLD | 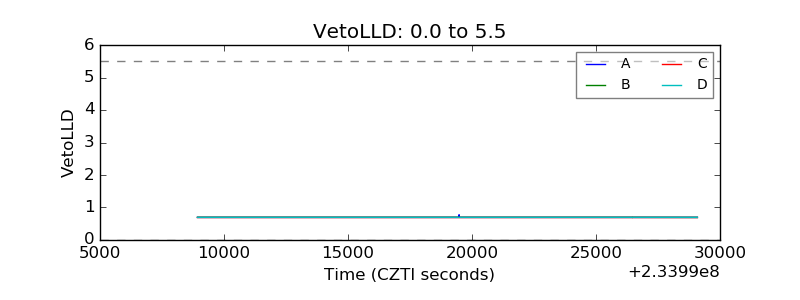 |
| Alpha Counter | 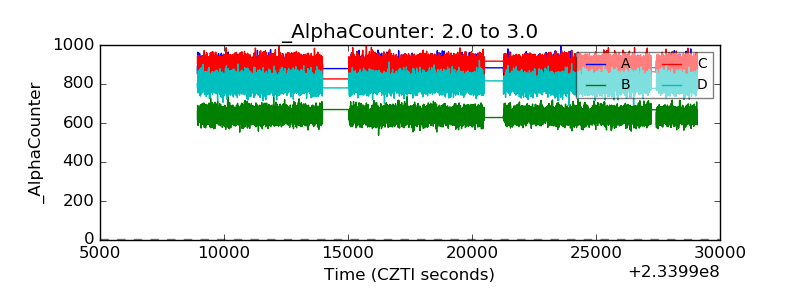 |
| _CPM_Rate | 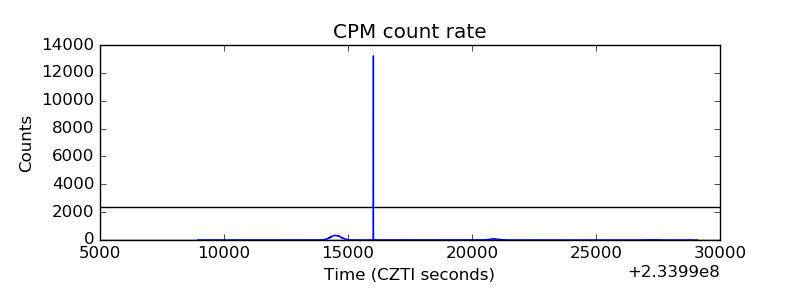 |
| CZT Counter | 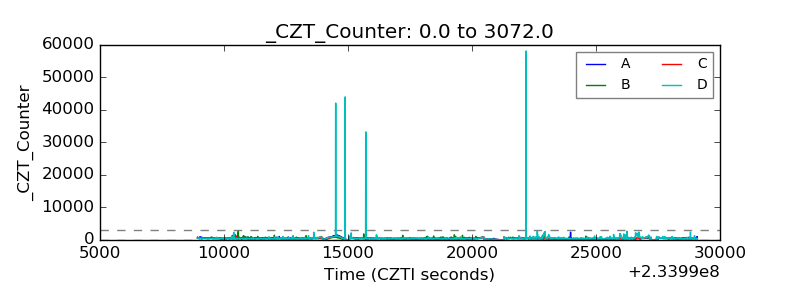 |
| +2.5 Volts monitor |  |
| +5 Volts monitor |  |
| _ROLL_ROT | 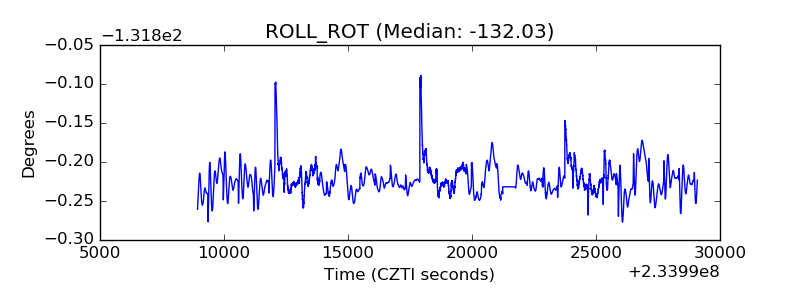 |
| _Roll_DEC | 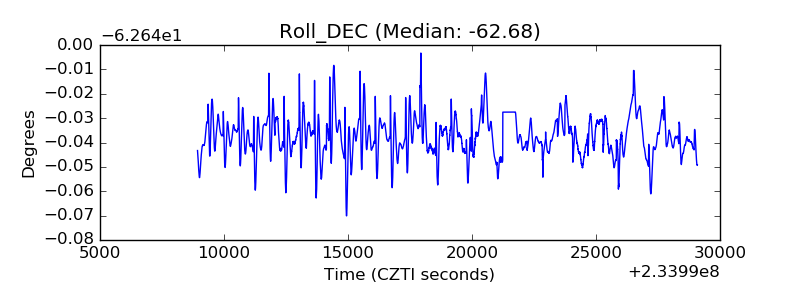 |
| _Roll_RA | 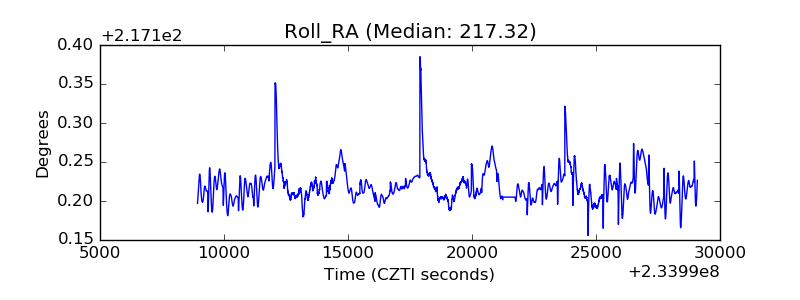 |
| Veto Counter | 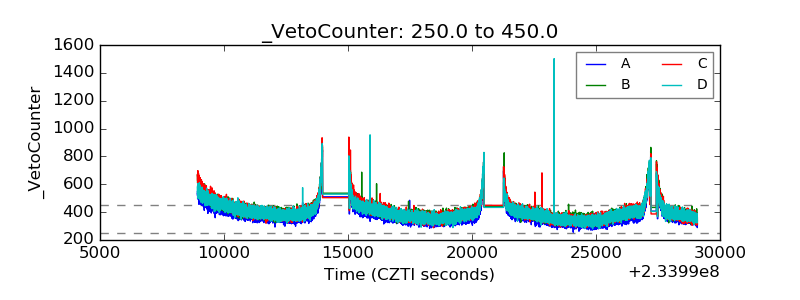 |