| Param | Original file | Final file |
|---|---|---|
| Filename | modeM0/AS1A03_046T01_9000001260_09065cztM0_level2.evt | modeM0/AS1A03_046T01_9000001260_09065cztM0_level2_quad_clean.evt |
| Size (bytes) | 242,853,120 | 53,208,000 |
| Size | 231.6 MB | 50.7 MB |
| Events in quadrant A | 2,315,291 | 340,630 |
| Events in quadrant B | 1,560,725 | 347,176 |
| Events in quadrant C | 1,423,194 | 344,637 |
| Events in quadrant D | 1,820,675 | 335,287 |
| Mode SS | |||
|---|---|---|---|
| Quadrant | BADHDUFLAG | Total packets | Discarded packets |
| A | 0 | 68 | 0 |
| B | 0 | 68 | 2 |
| C | 0 | 68 | 0 |
| D | 0 | 68 | 0 |
| Mode M0 | |||
|---|---|---|---|
| Quadrant | BADHDUFLAG | Total packets | Discarded packets |
| A | 0 | 9283 | 114 |
| B | 0 | 7043 | 71 |
| C | 0 | 6970 | 68 |
| D | 0 | 7900 | 81 |
| Quadrant | Total seconds | Saturated seconds | Saturation percentage |
|---|---|---|---|
| A | 3433 | 12 | 0.349548% |
| B | 3434 | 10 | 0.291206% |
| C | 3435 | 4 | 0.116448% |
| D | 3440 | 44 | 1.279070% |
Noise dominated data is calculated using 1-second bins in cleaned event files. If a bin has >2000 counts, and if more than 50% of those come from <1% of pixels, then it is considered to be noise-dominated and hence unusable.
| Quadrant | # 1 sec bins | Bins with >0 counts | Bins with >2000 counts | High rate bins dominated by noise | Noise dominated (total time) | Noise dominated (detector-on time) | Marked lightcurve |
|---|---|---|---|---|---|---|---|
| A | 3469 | 3468 | 9 | 9 | 0.26% | 0.26% | 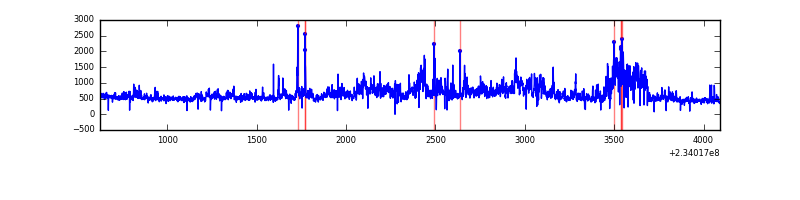 |
| B | 3469 | 3468 | 1 | 1 | 0.03% | 0.03% | 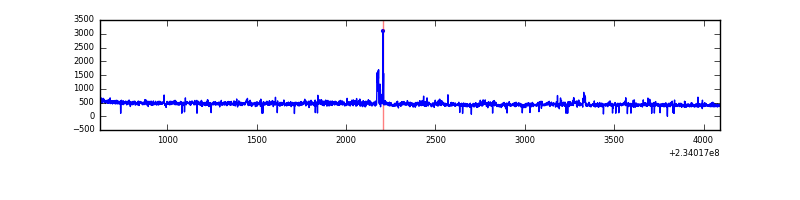 |
| C | 3469 | 3469 | 1 | 1 | 0.03% | 0.03% | 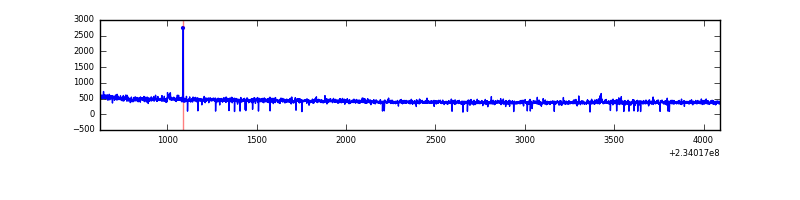 |
| D | 3469 | 3466 | 39 | 39 | 1.12% | 1.13% | 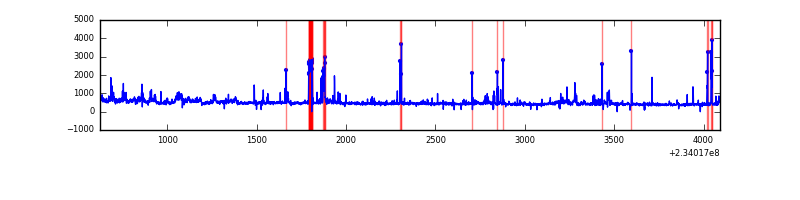 |
Top three noisy pixels from each quadrant. If the there are fewer than three noisy pixels in the level2.evt file, extra rows are filled as -1
| Pixel properties | Quadrant properties | ||||||
|---|---|---|---|---|---|---|---|
| Quadrant | DetID | PixID | Counts | Sigma | Mean | Median | Sigma |
| A | 8 | 5 | 673484 | 8465.21 | 379 | 371 | 79.5 |
| A | 3 | 1 | 131462 | 1648.63 | 379 | 371 | 79.5 |
| A | 5 | 16 | 17695 | 217.87 | 379 | 371 | 79.5 |
| B | 11 | 203 | 24818 | 330.57 | 378 | 369 | 74.0 |
| B | 0 | 214 | 22562 | 300.07 | 378 | 369 | 74.0 |
| B | 0 | 219 | 16655 | 220.2 | 378 | 369 | 74.0 |
| C | 1 | 3 | 6029 | 67.01 | 362 | 363 | 84.6 |
| C | 12 | 4 | 4285 | 46.38 | 362 | 363 | 84.6 |
| C | 13 | 61 | 2686 | 27.47 | 362 | 363 | 84.6 |
| D | 1 | 52 | 88156 | 881.23 | 362 | 353 | 99.6 |
| D | 8 | 195 | 69055 | 689.52 | 362 | 353 | 99.6 |
| D | 1 | 31 | 65982 | 658.68 | 362 | 353 | 99.6 |
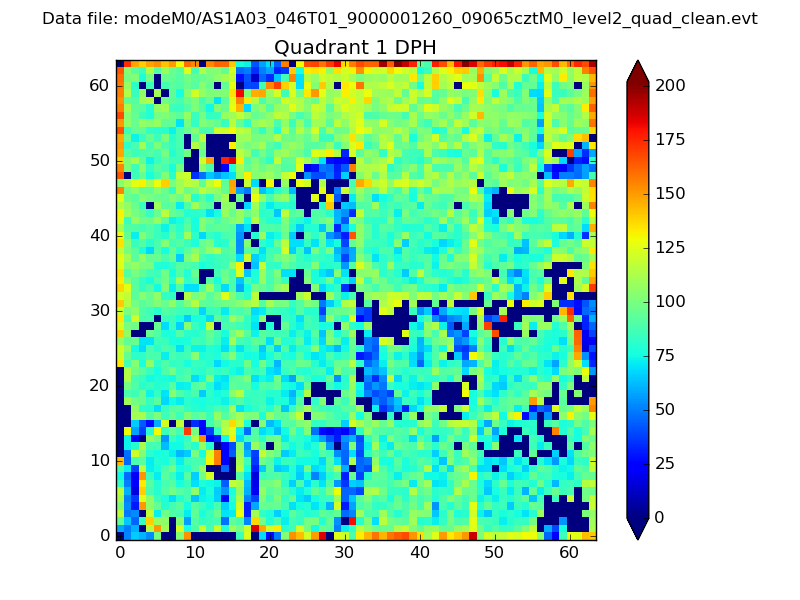
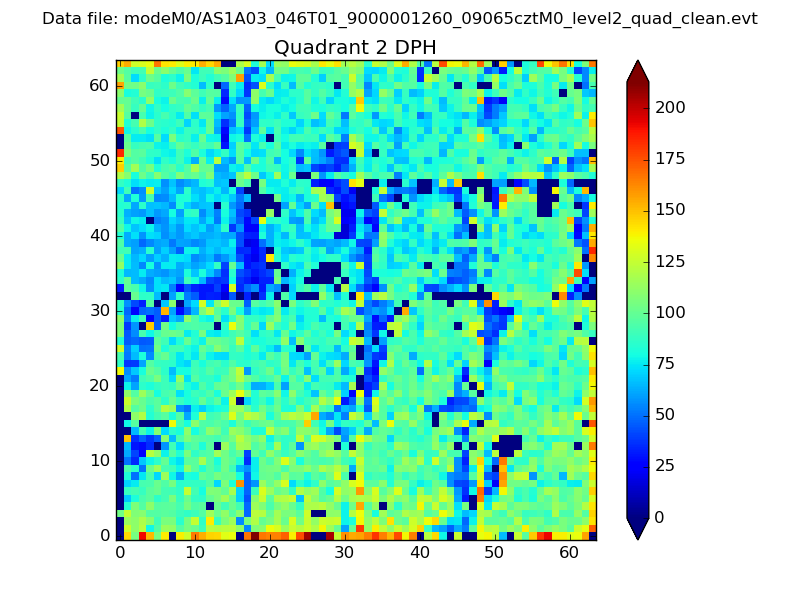
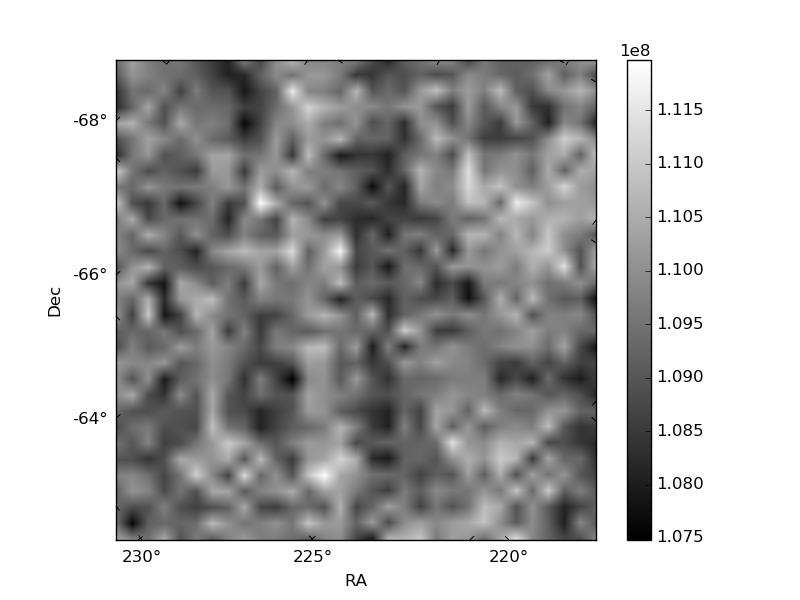
Histogram calculated using DETX and DETY for each event in the final _common_clean file
| Quadrant A |  |
 |
Quadrant B |
|---|---|---|---|
| Quadrant D |  |
 |
Quadrant C |
| Plot type | Count rate plots | Images |
|---|---|---|
| Comparison with Poisson distribution Blue bars denote a histogram of data divided into 1 sec bins. Red curve is a Poisson curve with rate = median count rate of data. |
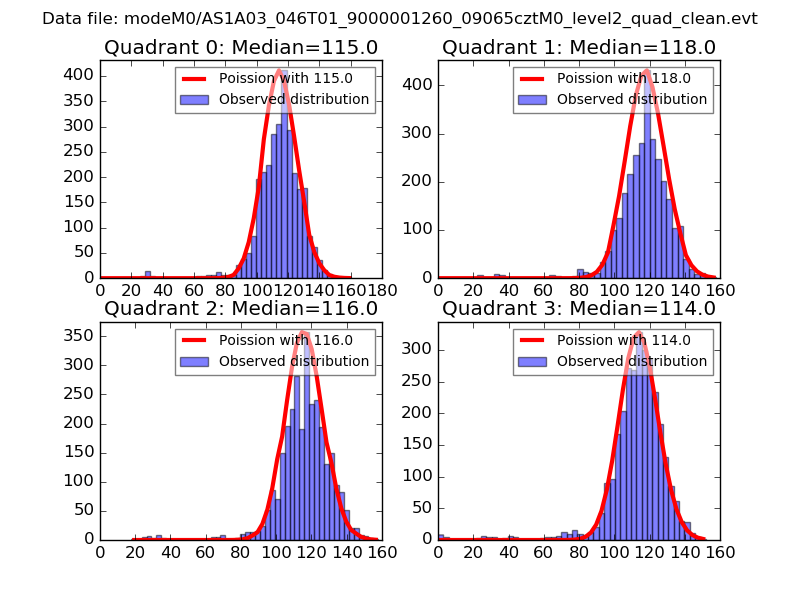 |
 |
| Quadrant-wise count rates Data is divided into 100 sec bins |
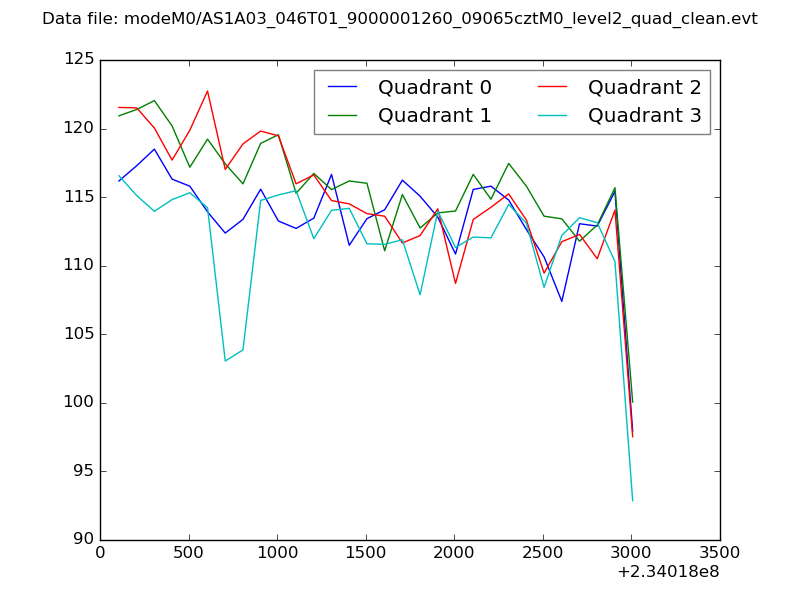 |
|
| Module-wise count rates for Quadrant A Data is divided into 100 sec bins |
 |
 |
| Module-wise count rates for Quadrant B Data is divided into 100 sec bins |
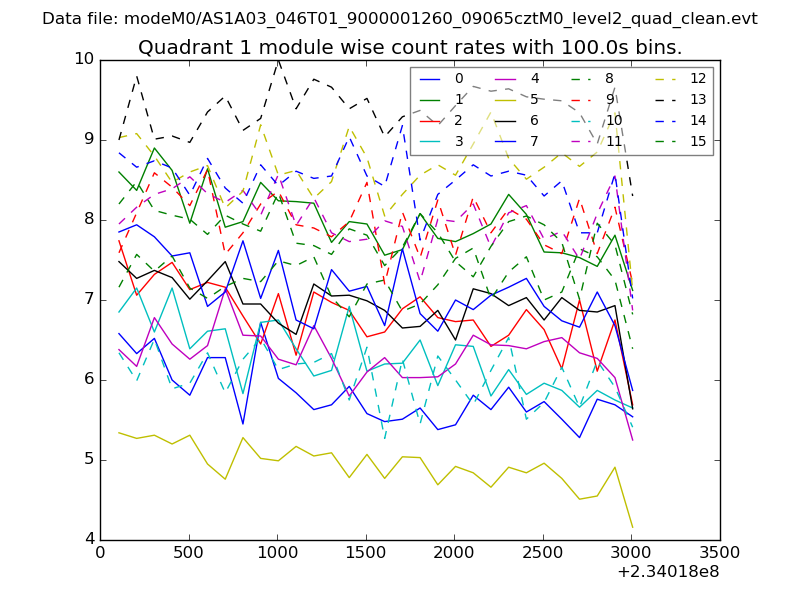 |
 |
| Module-wise count rates for Quadrant C Data is divided into 100 sec bins |
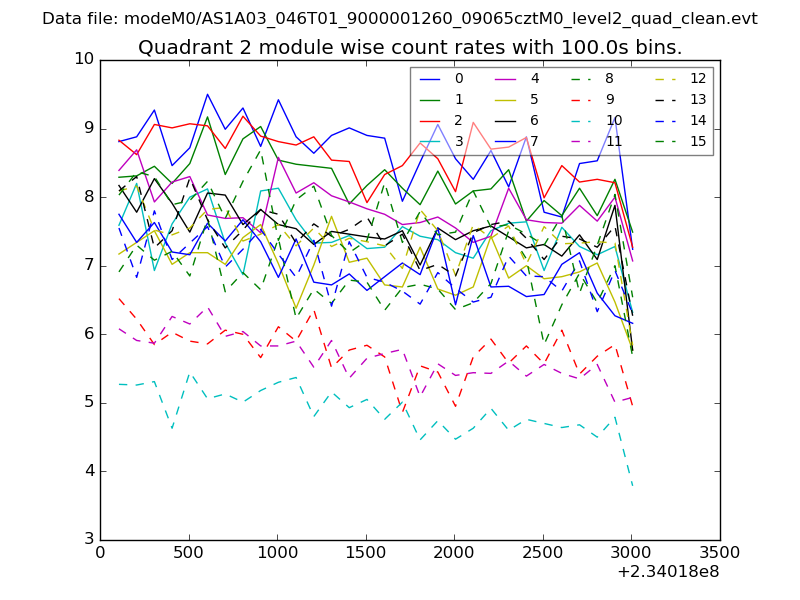 |
 |
| Module-wise count rates for Quadrant D Data is divided into 100 sec bins |
 |
 |
| Parameter | Plot |
|---|---|
| CZT HV Monitor | 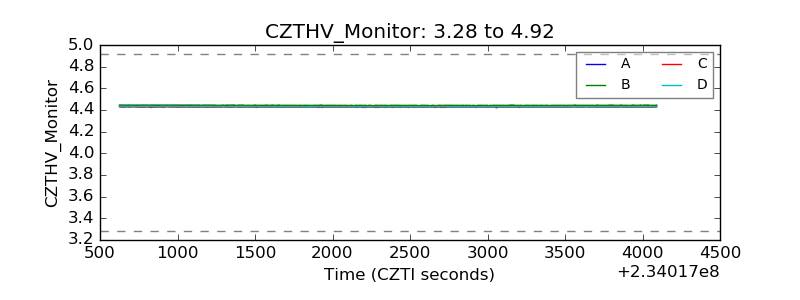 |
| D_VDD | 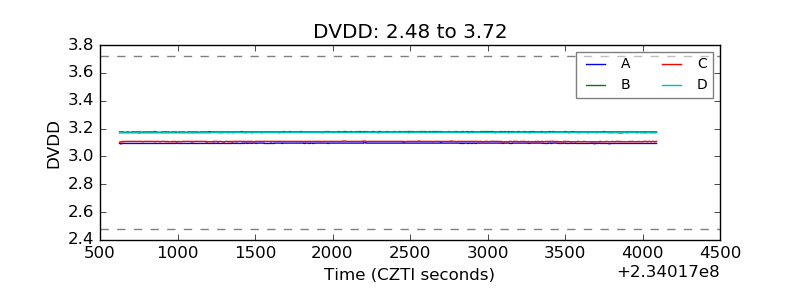 |
| Temperature 1 | 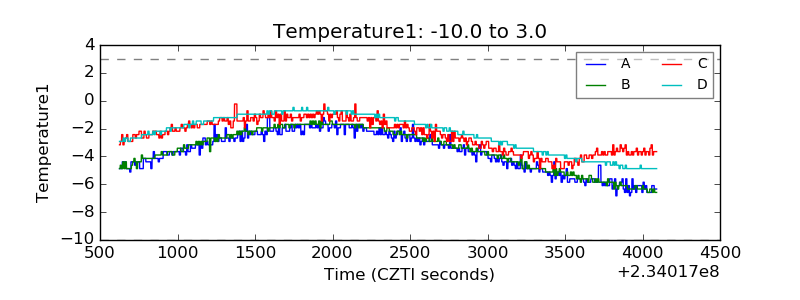 |
| Veto HV Monitor | 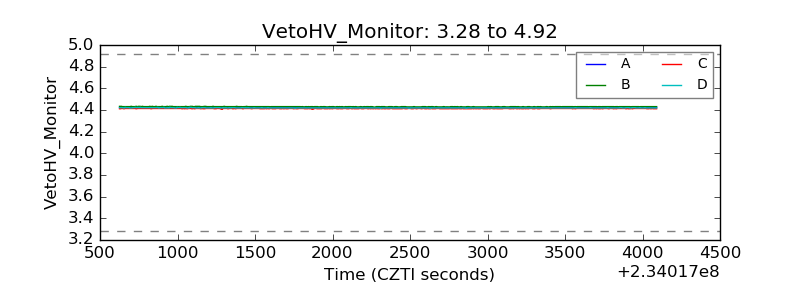 |
| Veto LLD | 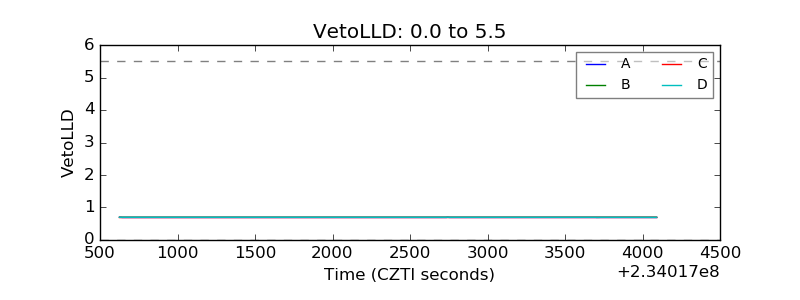 |
| Alpha Counter | 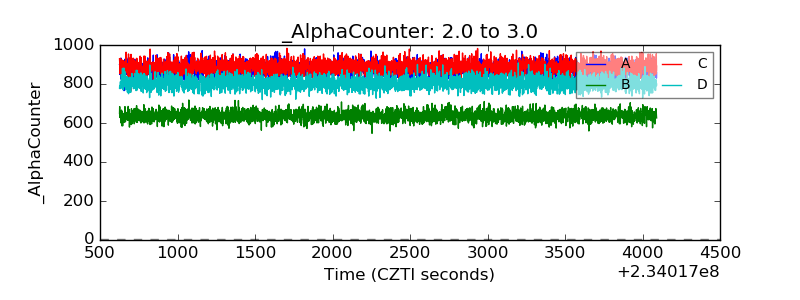 |
| _CPM_Rate | 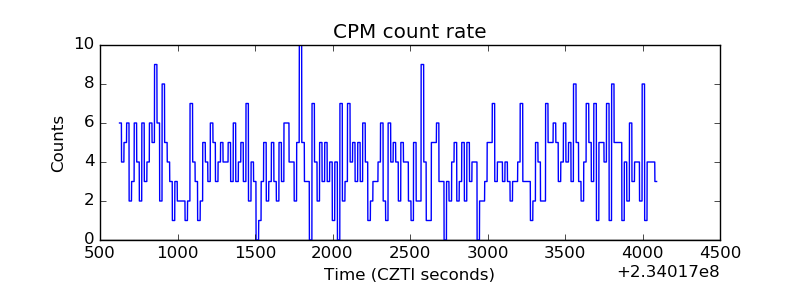 |
| CZT Counter | 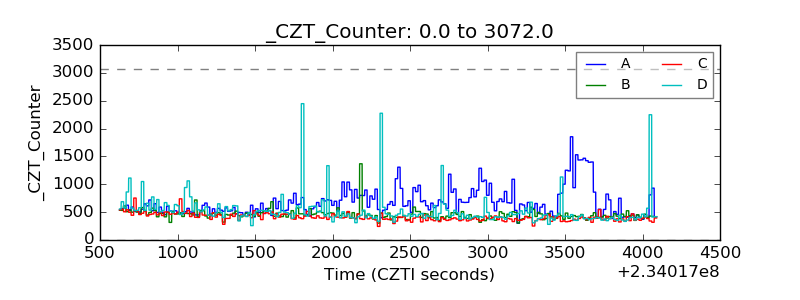 |
| +2.5 Volts monitor | 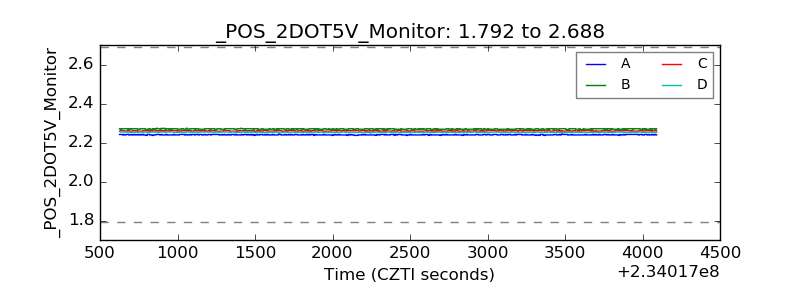 |
| +5 Volts monitor | 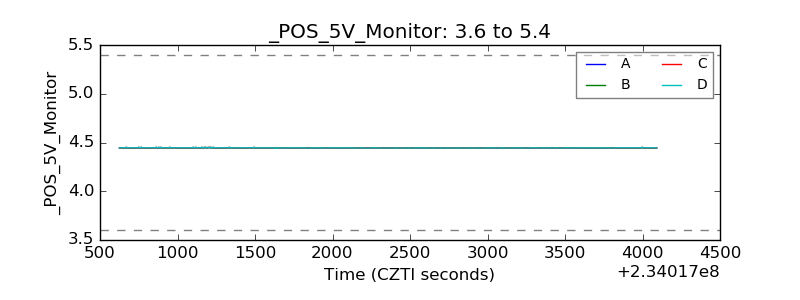 |
| _ROLL_ROT | 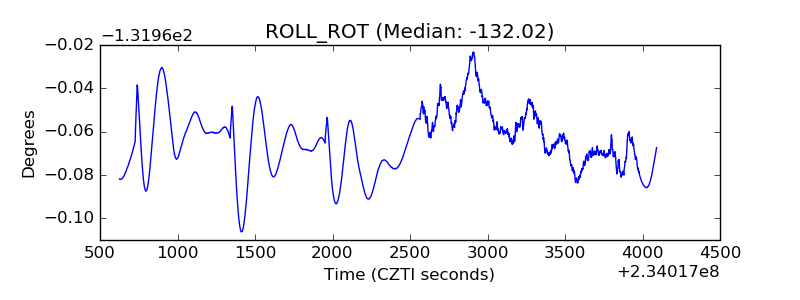 |
| _Roll_DEC | 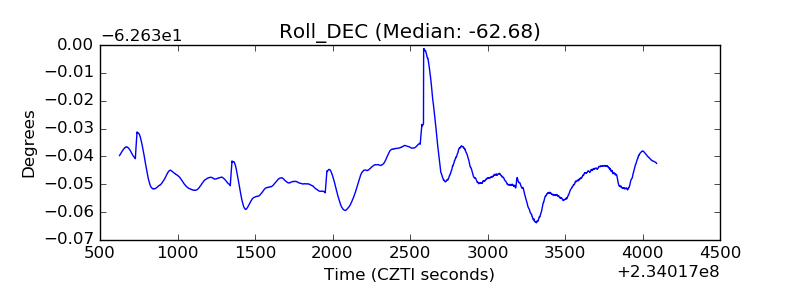 |
| _Roll_RA | 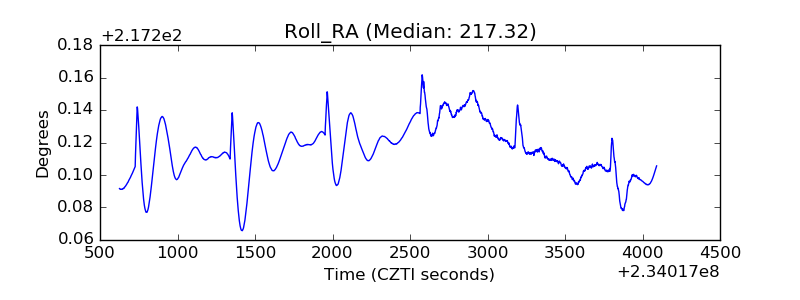 |
| Veto Counter | 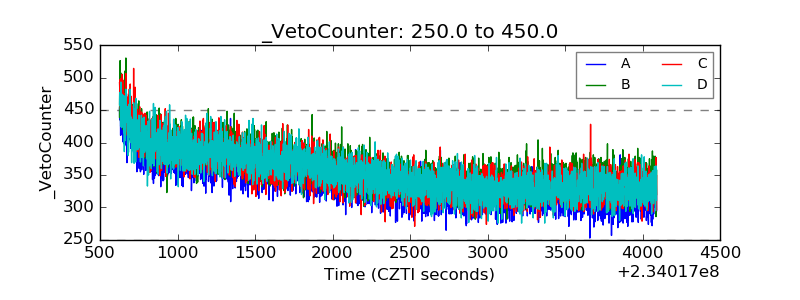 |