| Param | Original file | Final file |
|---|---|---|
| Filename | modeM0/AS1G07_070T02_9000001262cztM0_level2.fits | modeM0/AS1G07_070T02_9000001262cztM0_level2_quad_clean.evt |
| Size (bytes) | 322,666,560 | 313,346,880 |
| Size | 307.7 MB | 298.8 MB |
| Events in quadrant A | 1,915,304 | 1,823,419 |
| Events in quadrant B | 1,869,860 | 1,831,318 |
| Events in quadrant C | 1,911,090 | 1,768,372 |
| Events in quadrant D | 1,644,782 | 1,635,500 |
| Mode SS | |||
|---|---|---|---|
| Quadrant | BADHDUFLAG | Total packets | Discarded packets |
| A | 0 | 722 | 0 |
| B | 0 | 722 | 0 |
| C | 0 | 722 | 0 |
| D | 0 | 720 | 0 |
| Mode M9 | |||
|---|---|---|---|
| Quadrant | BADHDUFLAG | Total packets | Discarded packets |
| A | 0 | 46 | 0 |
| B | 0 | 46 | 0 |
| C | 0 | 46 | 0 |
| D | 0 | 46 | 0 |
| Mode M0 | |||
|---|---|---|---|
| Quadrant | BADHDUFLAG | Total packets | Discarded packets |
| A | 0 | 84029 | 0 |
| B | 0 | 74784 | 0 |
| C | 0 | 72526 | 0 |
| D | 0 | 81931 | 0 |
| Quadrant | Total seconds | Saturated seconds | Saturation percentage |
|---|---|---|---|
| A | 35385 | 587 | 1.658895% |
| B | 35383 | 494 | 1.396151% |
| C | 35385 | 266 | 0.751731% |
| D | 35388 | 869 | 2.455635% |
Noise dominated data is calculated using 1-second bins in cleaned event files. If a bin has >2000 counts, and if more than 50% of those come from <1% of pixels, then it is considered to be noise-dominated and hence unusable.
| Quadrant | # 1 sec bins | Bins with >0 counts | Bins with >2000 counts | High rate bins dominated by noise | Noise dominated (total time) | Noise dominated (detector-on time) | Marked lightcurve |
|---|---|---|---|---|---|---|---|
| A | 39995 | 35395 | 0 | 0 | 0.00% | 0.00% | 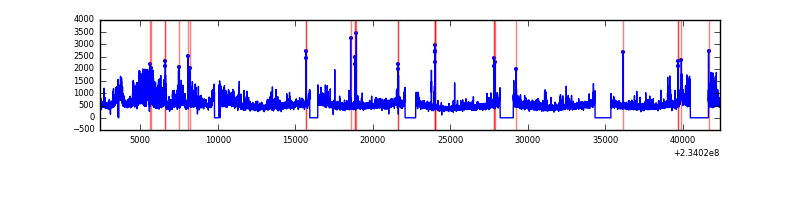 |
| B | 39995 | 35393 | 0 | 0 | 0.00% | 0.00% | 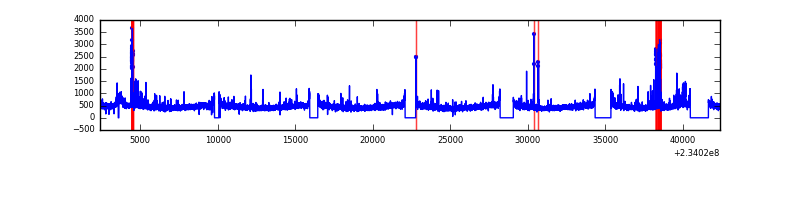 |
| C | 39995 | 35394 | 0 | 0 | 0.00% | 0.00% | 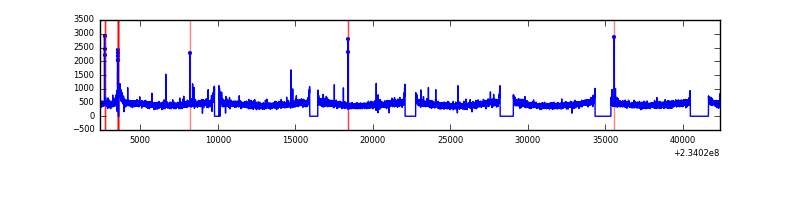 |
| D | 39995 | 35393 | 0 | 0 | 0.00% | 0.00% | 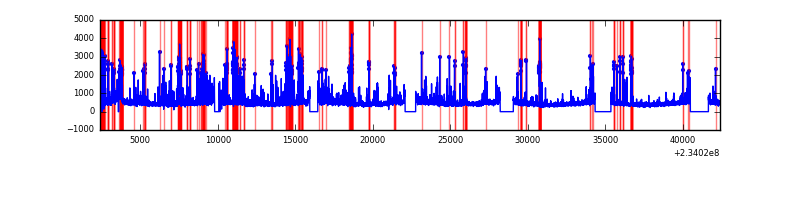 |
Top three noisy pixels from each quadrant. If the there are fewer than three noisy pixels in the level2.evt file, extra rows are filled as -1
| Pixel properties | Quadrant properties | ||||||
|---|---|---|---|---|---|---|---|
| Quadrant | DetID | PixID | Counts | Sigma | Mean | Median | Sigma |
| A | 14 | 188 | 1956 | 11.77 | 496 | 465 | 126.7 |
| A | 0 | 29 | 1888 | 11.23 | 496 | 465 | 126.7 |
| A | 14 | 204 | 1652 | 9.37 | 496 | 465 | 126.7 |
| B | 2 | 9 | 1653 | 11.78 | 492 | 466 | 100.7 |
| B | 14 | 254 | 1311 | 8.39 | 492 | 466 | 100.7 |
| B | 12 | 226 | 1236 | 7.64 | 492 | 466 | 100.7 |
| C | 1 | 80 | 1395 | 6.88 | 504 | 466 | 135.0 |
| C | 12 | 241 | 1392 | 6.86 | 504 | 466 | 135.0 |
| C | 1 | 81 | 1387 | 6.82 | 504 | 466 | 135.0 |
| D | 3 | 14 | 1231 | 6.3 | 468 | 425 | 127.9 |
| D | 6 | 231 | 1227 | 6.27 | 468 | 425 | 127.9 |
| D | 1 | 19 | 1190 | 5.98 | 468 | 425 | 127.9 |
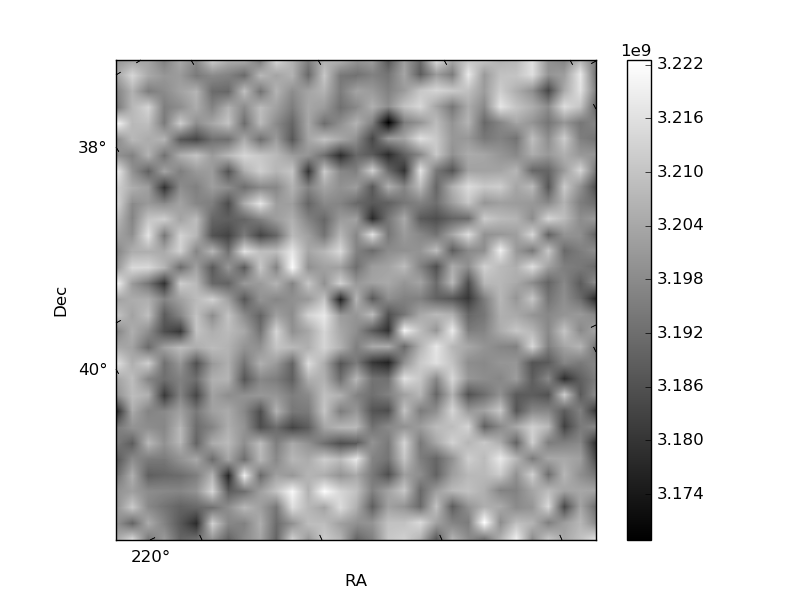
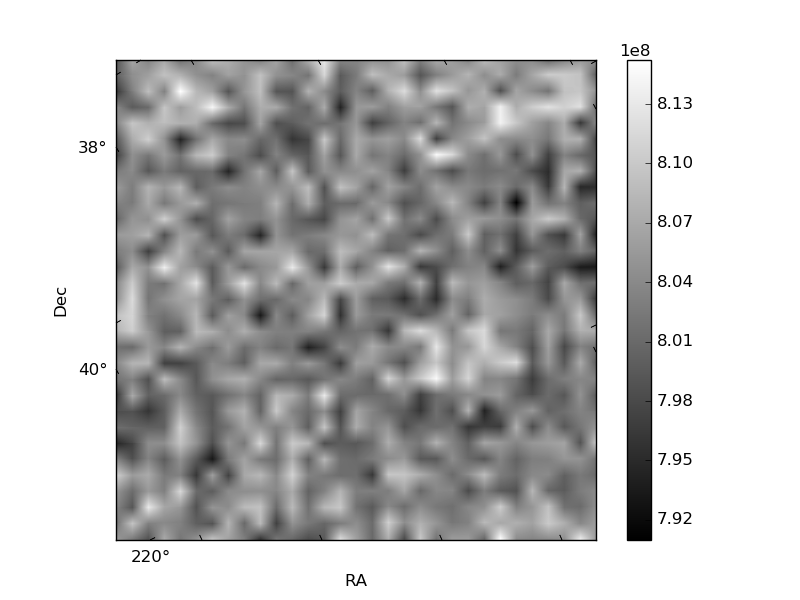
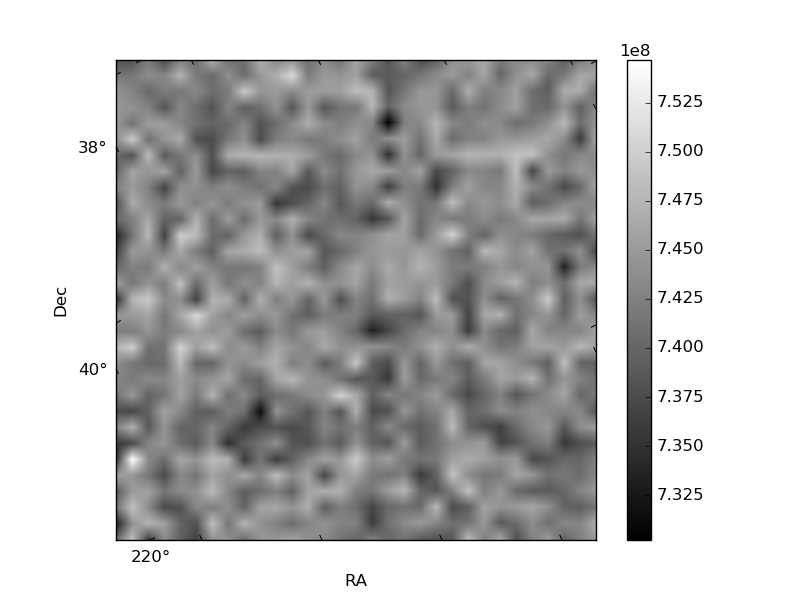
Histogram calculated using DETX and DETY for each event in the final _common_clean file
| Quadrant A | 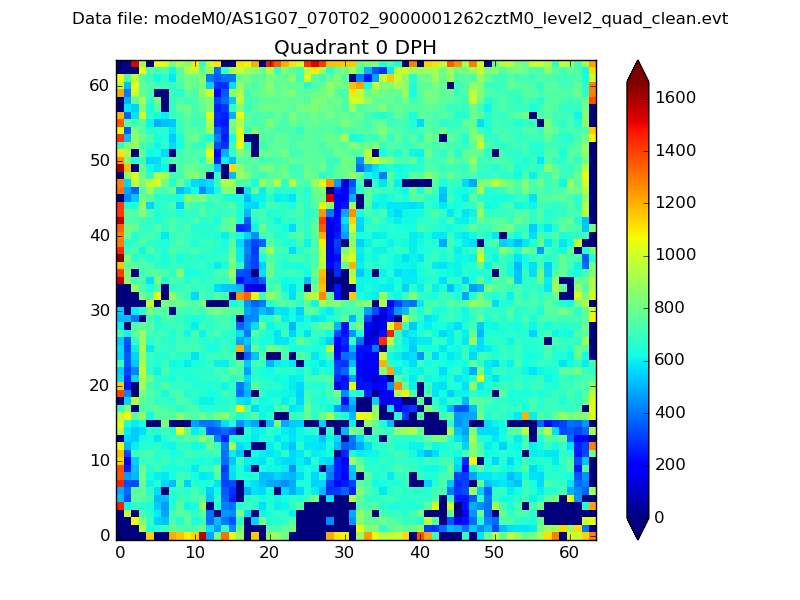 |
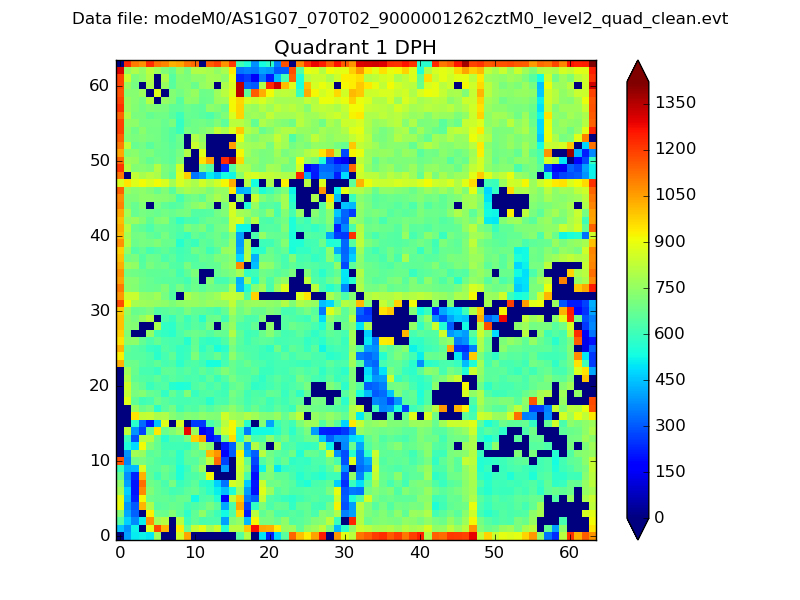 |
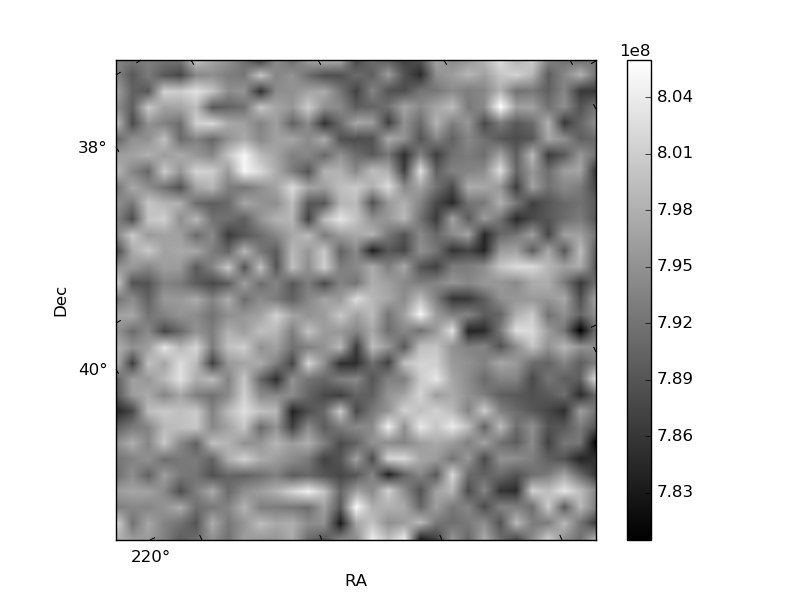
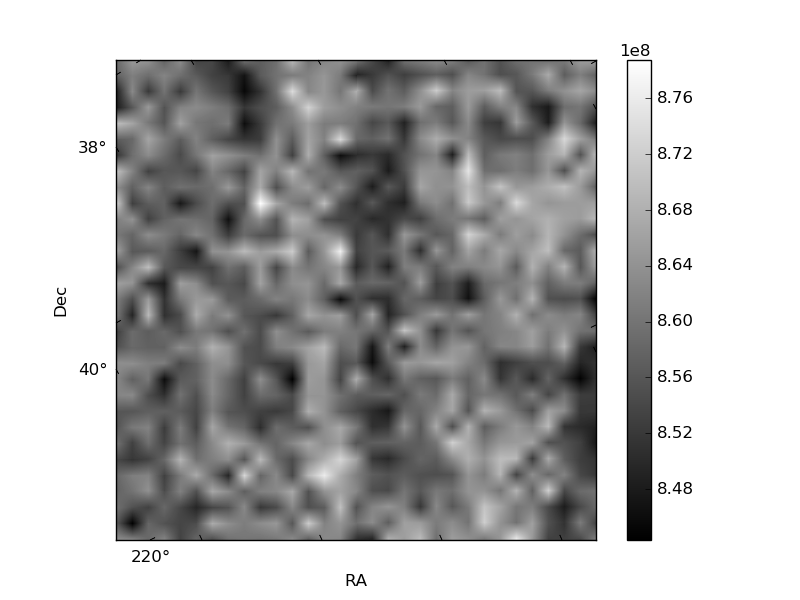
Quadrant B |
|---|---|---|---|
| Quadrant D | 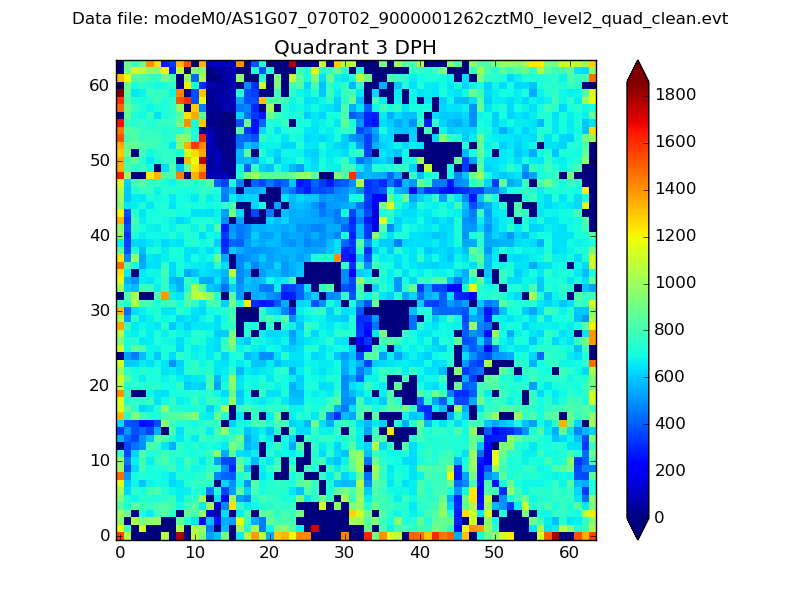 |
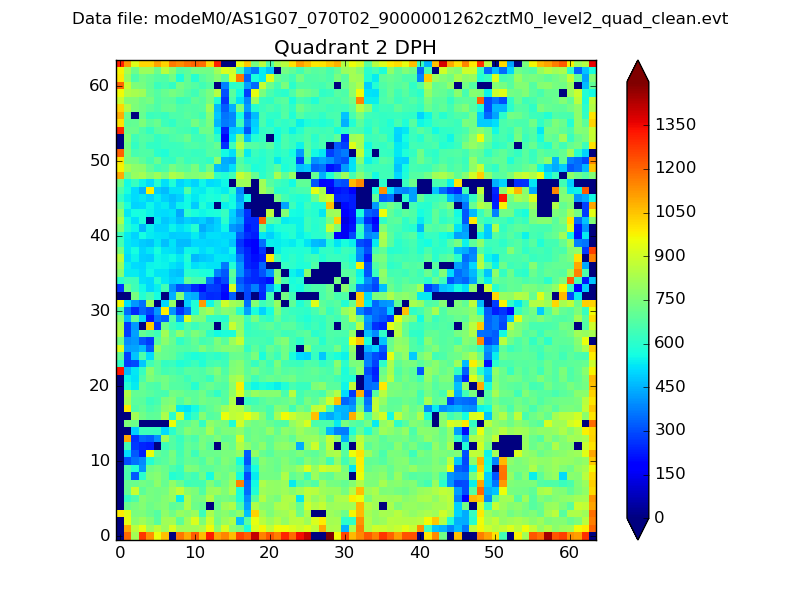 |
Quadrant C |
| Plot type | Count rate plots | Images |
|---|---|---|
| Comparison with Poisson distribution Blue bars denote a histogram of data divided into 1 sec bins. Red curve is a Poisson curve with rate = median count rate of data. |
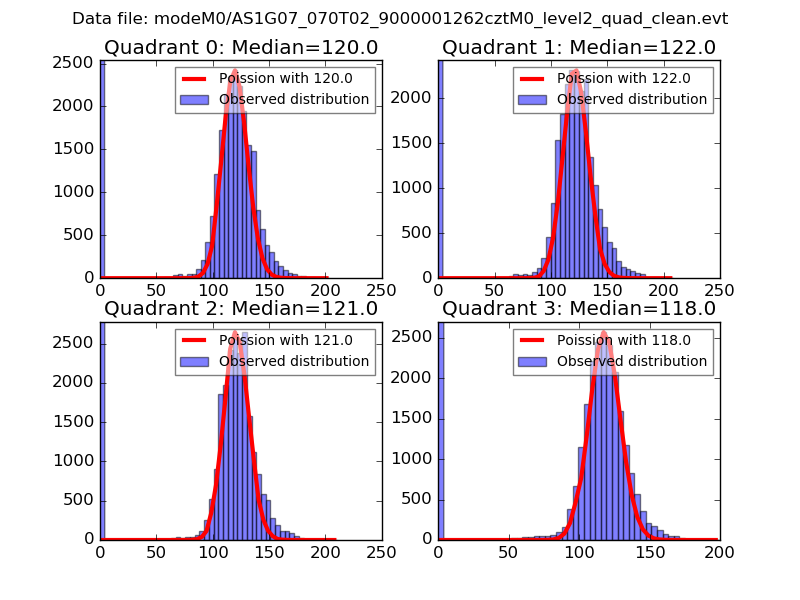 |
 |
| Quadrant-wise count rates Data is divided into 100 sec bins |
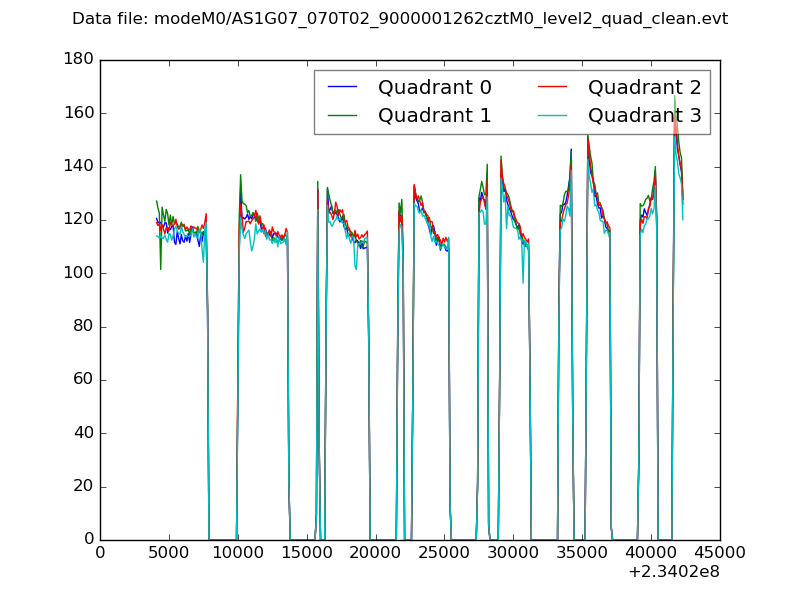 |
|
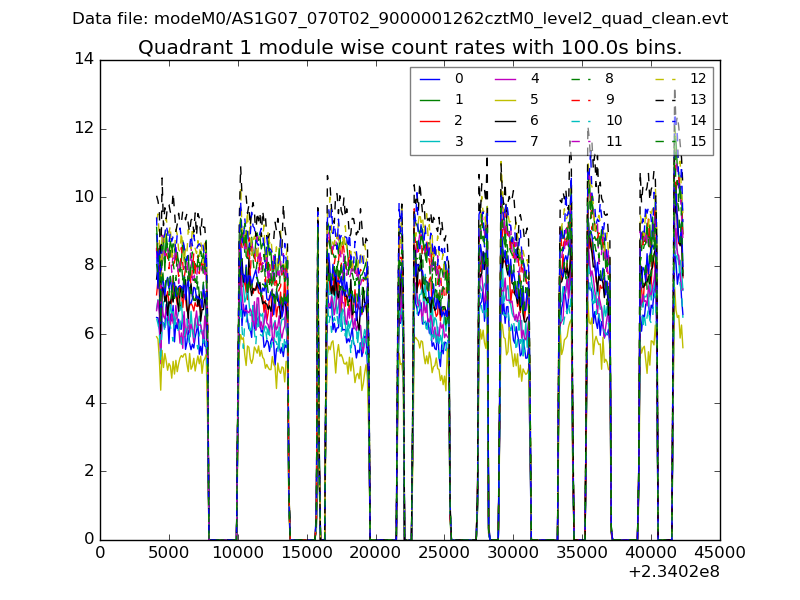
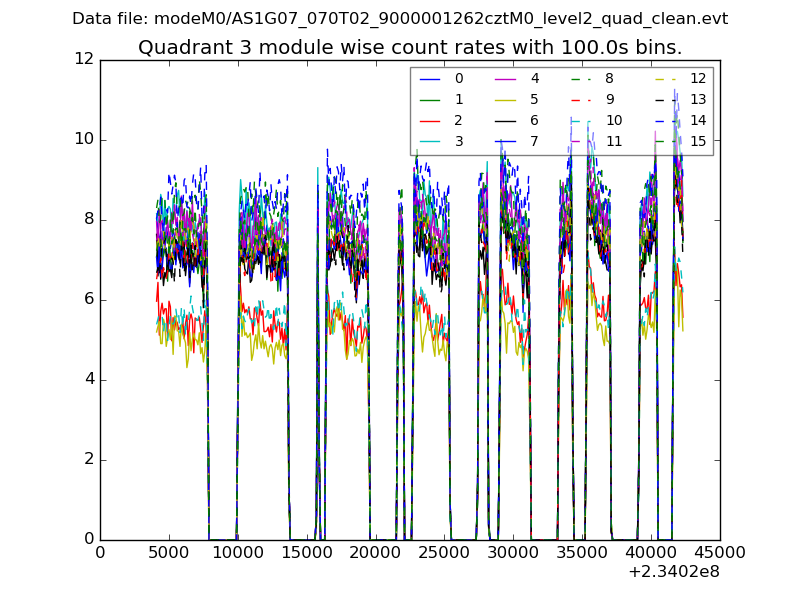
| Module-wise count rates for Quadrant A Data is divided into 100 sec bins |
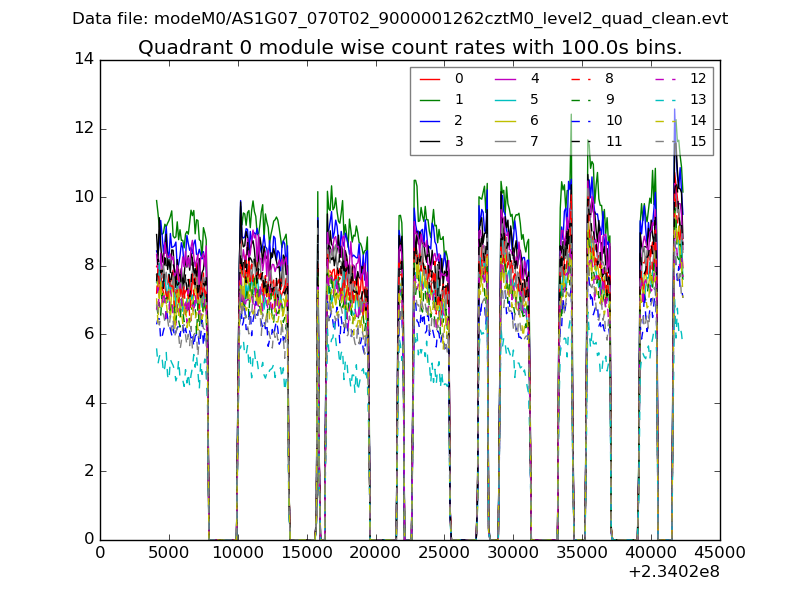 |
 |
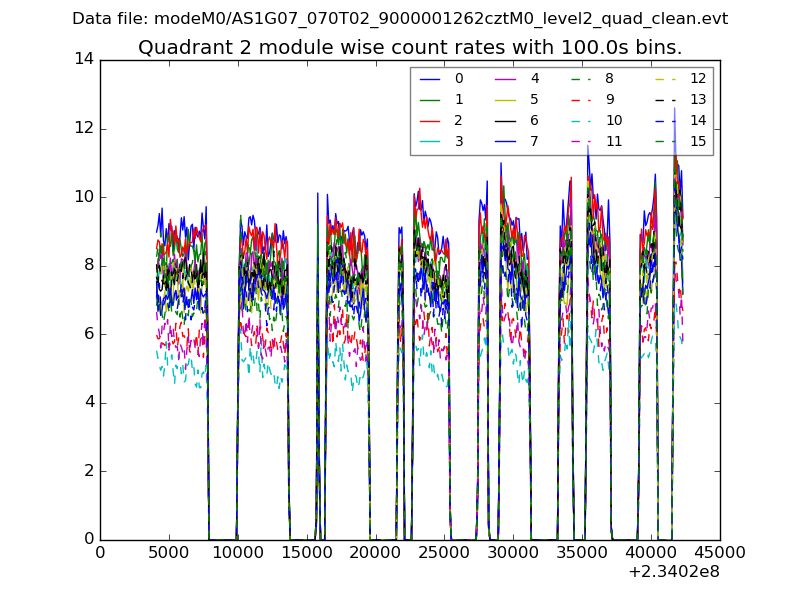
| Module-wise count rates for Quadrant B Data is divided into 100 sec bins |
 |
 |
| Module-wise count rates for Quadrant C Data is divided into 100 sec bins |
 |
 |
| Module-wise count rates for Quadrant D Data is divided into 100 sec bins |
 |
 |
| Parameter | Plot |
|---|---|
| CZT HV Monitor | 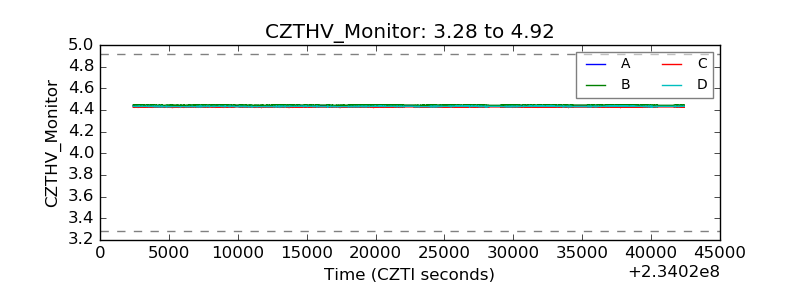 |
| D_VDD | 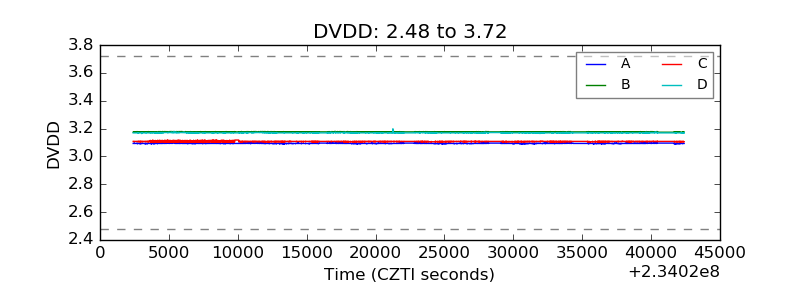 |
| Temperature 1 | 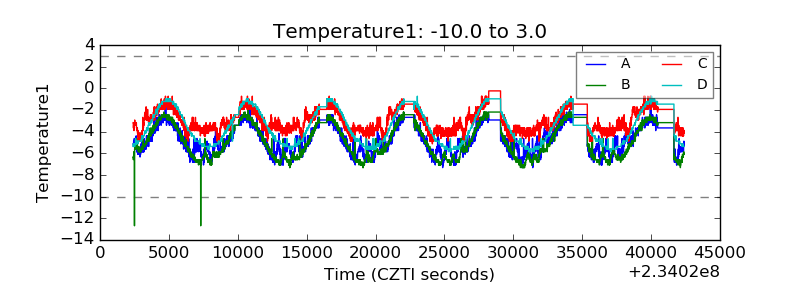 |
| Veto HV Monitor | 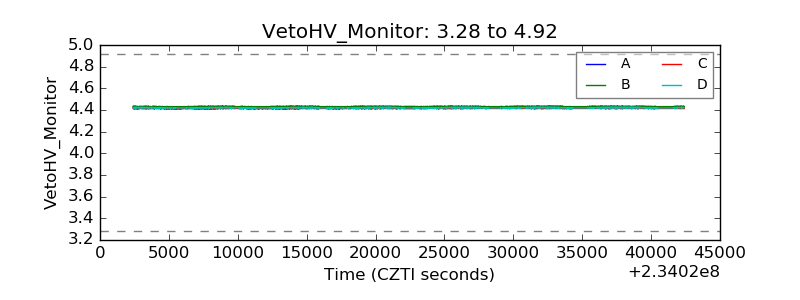 |
| Veto LLD | 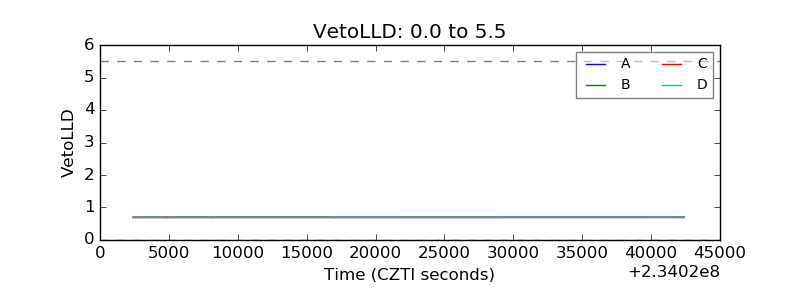 |
| Alpha Counter | 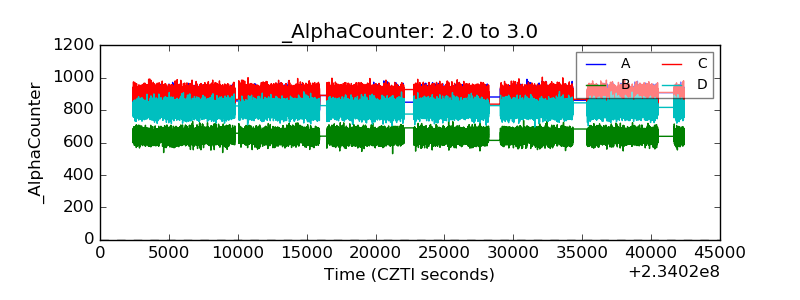 |
| _CPM_Rate | 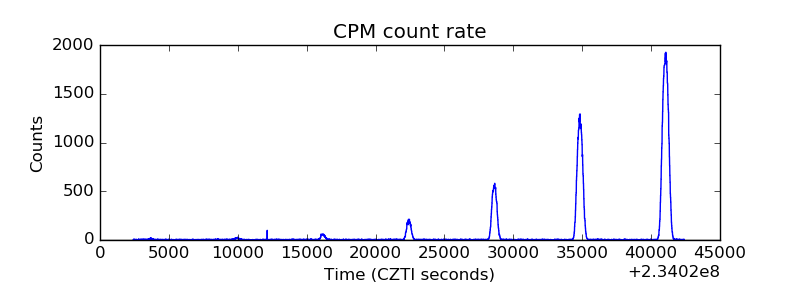 |
| CZT Counter | 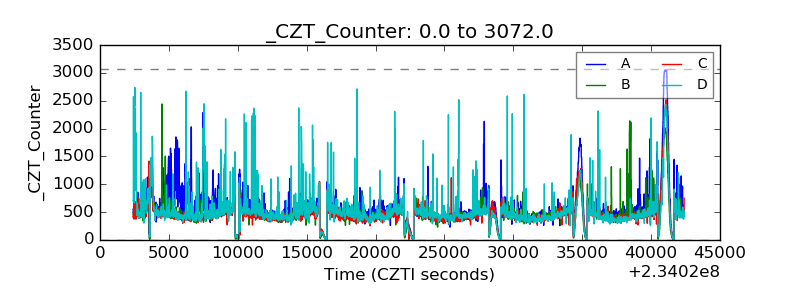 |
| +2.5 Volts monitor | 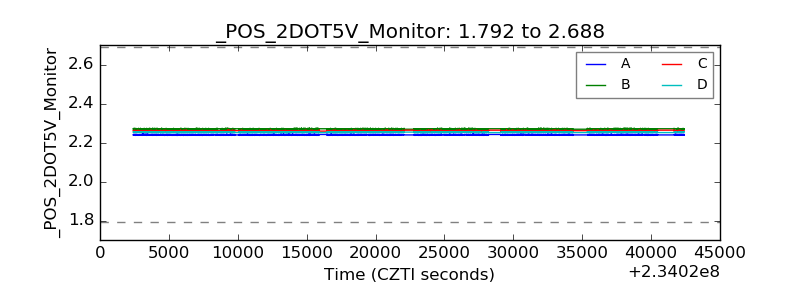 |
| +5 Volts monitor | 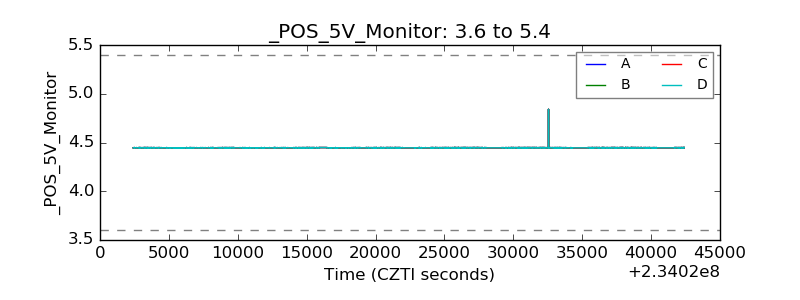 |
| _ROLL_ROT | 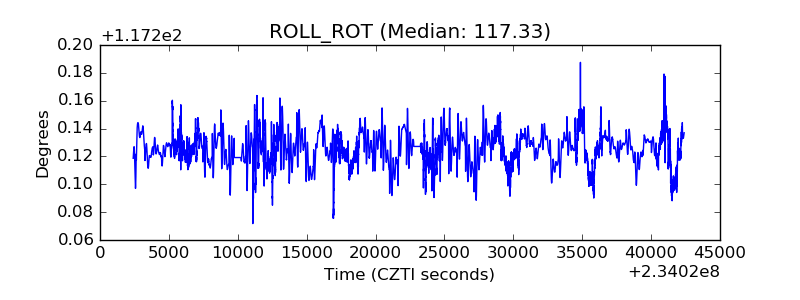 |
| _Roll_DEC | 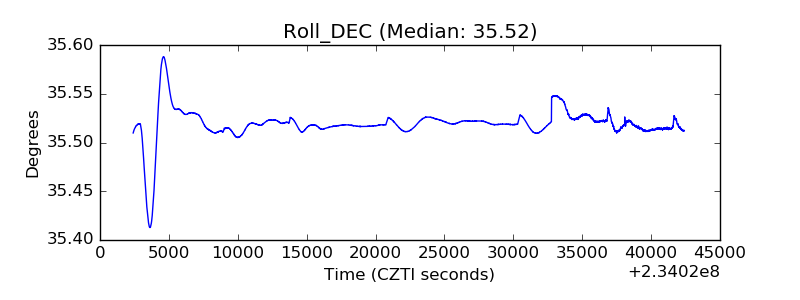 |
| _Roll_RA | 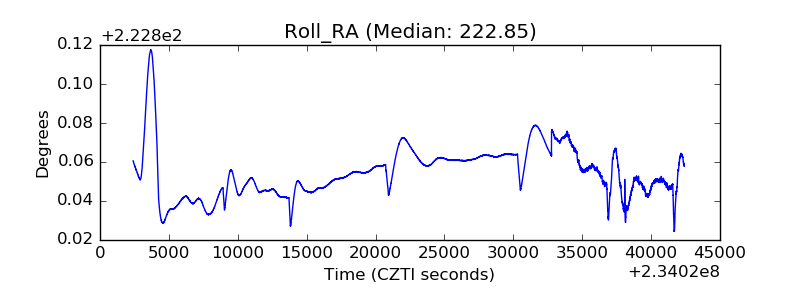 |
| Veto Counter | 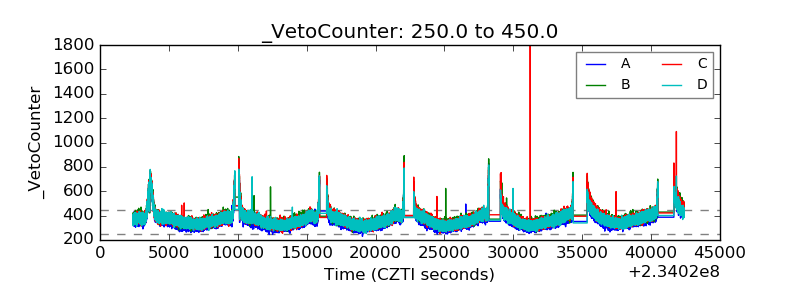 |