| Param | Original file | Final file |
|---|---|---|
| Filename | modeM0/AS1G07_070T02_9000001262_09065cztM0_level2.evt | modeM0/AS1G07_070T02_9000001262_09065cztM0_level2_quad_clean.evt |
| Size (bytes) | 247,890,240 | 25,130,880 |
| Size | 236.4 MB | 24.0 MB |
| Events in quadrant A | 2,088,642 | 140,382 |
| Events in quadrant B | 1,686,346 | 143,087 |
| Events in quadrant C | 1,494,711 | 139,564 |
| Events in quadrant D | 2,043,255 | 134,896 |
| Mode SS | |||
|---|---|---|---|
| Quadrant | BADHDUFLAG | Total packets | Discarded packets |
| A | 0 | 56 | 0 |
| B | 0 | 56 | 0 |
| C | 0 | 56 | 0 |
| D | 0 | 56 | 0 |
| Mode M9 | |||
|---|---|---|---|
| Quadrant | BADHDUFLAG | Total packets | Discarded packets |
| A | 0 | 1 | 0 |
| B | 0 | 1 | 0 |
| C | 0 | 1 | 0 |
| D | 0 | 1 | 0 |
| Mode M0 | |||
|---|---|---|---|
| Quadrant | BADHDUFLAG | Total packets | Discarded packets |
| A | 0 | 8105 | 7 |
| B | 0 | 6785 | 7 |
| C | 0 | 6284 | 6 |
| D | 0 | 7932 | 16 |
| Quadrant | Total seconds | Saturated seconds | Saturation percentage |
|---|---|---|---|
| A | 2842 | 253 | 8.902182% |
| B | 2841 | 222 | 7.814150% |
| C | 2842 | 152 | 5.348346% |
| D | 2841 | 336 | 11.826822% |
Noise dominated data is calculated using 1-second bins in cleaned event files. If a bin has >2000 counts, and if more than 50% of those come from <1% of pixels, then it is considered to be noise-dominated and hence unusable.
| Quadrant | # 1 sec bins | Bins with >0 counts | Bins with >2000 counts | High rate bins dominated by noise | Noise dominated (total time) | Noise dominated (detector-on time) | Marked lightcurve |
|---|---|---|---|---|---|---|---|
| A | 2889 | 2845 | 0 | 0 | 0.00% | 0.00% | 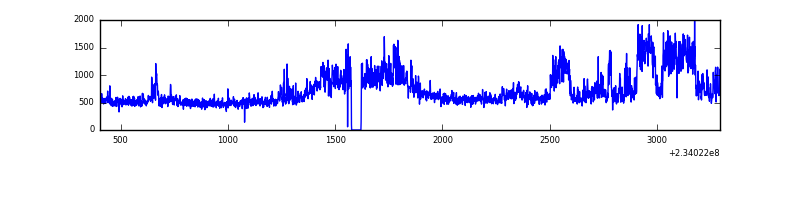 |
| B | 2889 | 2845 | 32 | 32 | 1.11% | 1.12% | 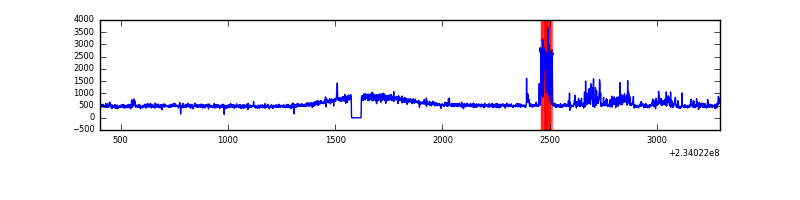 |
| C | 2889 | 2845 | 10 | 10 | 0.35% | 0.35% | 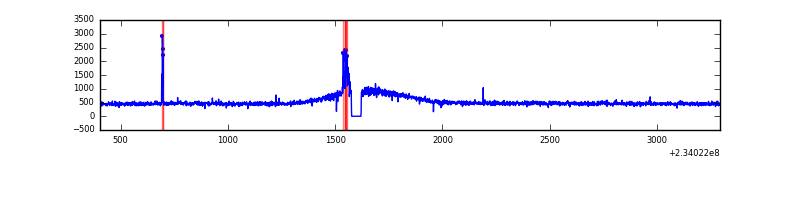 |
| D | 2889 | 2844 | 144 | 144 | 4.98% | 5.06% | 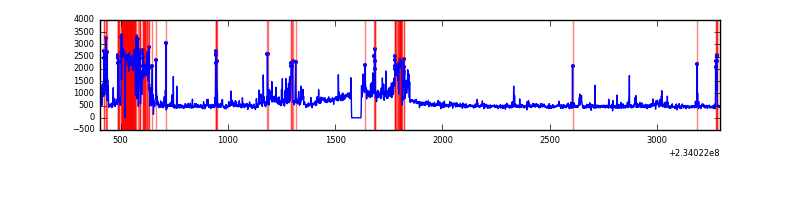 |
Top three noisy pixels from each quadrant. If the there are fewer than three noisy pixels in the level2.evt file, extra rows are filled as -1
| Pixel properties | Quadrant properties | ||||||
|---|---|---|---|---|---|---|---|
| Quadrant | DetID | PixID | Counts | Sigma | Mean | Median | Sigma |
| A | 8 | 5 | 614101 | 7637.35 | 378 | 368 | 80.4 |
| A | 1 | 162 | 10113 | 121.27 | 378 | 368 | 80.4 |
| A | 13 | 251 | 5107 | 58.97 | 378 | 368 | 80.4 |
| B | 10 | 16 | 193447 | 2569.36 | 380 | 368 | 75.1 |
| B | 11 | 203 | 8832 | 112.63 | 380 | 368 | 75.1 |
| B | 12 | 111 | 8688 | 110.72 | 380 | 368 | 75.1 |
| C | 14 | 234 | 42937 | 482.03 | 369 | 371 | 88.3 |
| C | 8 | 128 | 4010 | 41.21 | 369 | 371 | 88.3 |
| C | 13 | 61 | 2799 | 27.5 | 369 | 371 | 88.3 |
| D | 2 | 14 | 578611 | 6419.32 | 358 | 347 | 90.1 |
| D | 12 | 233 | 41842 | 460.64 | 358 | 347 | 90.1 |
| D | 1 | 52 | 30597 | 335.81 | 358 | 347 | 90.1 |
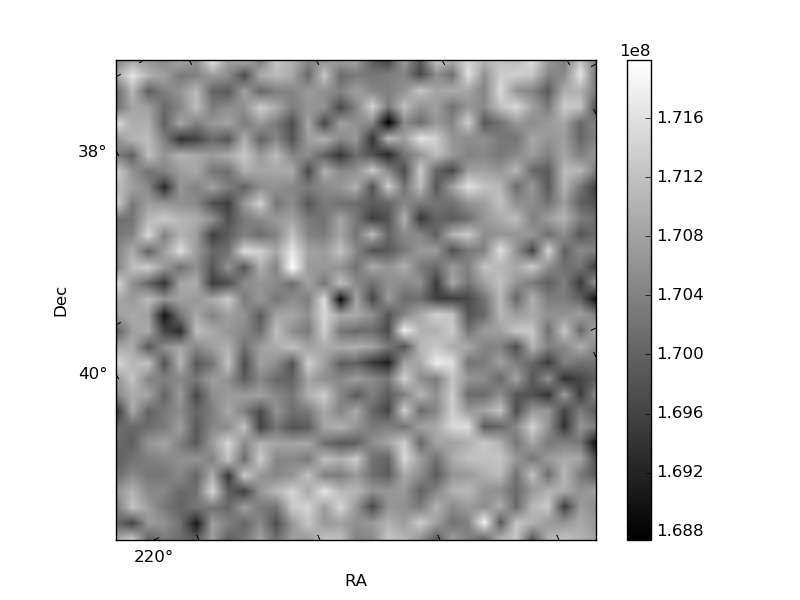
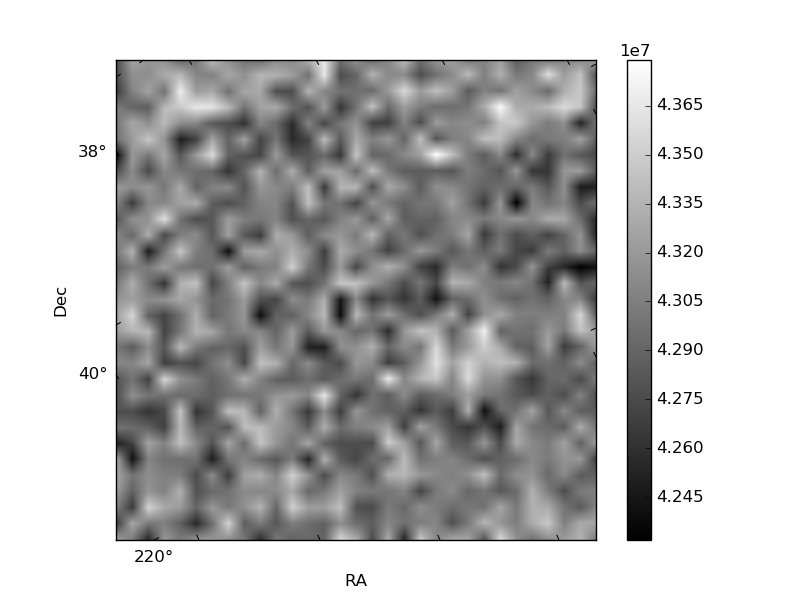
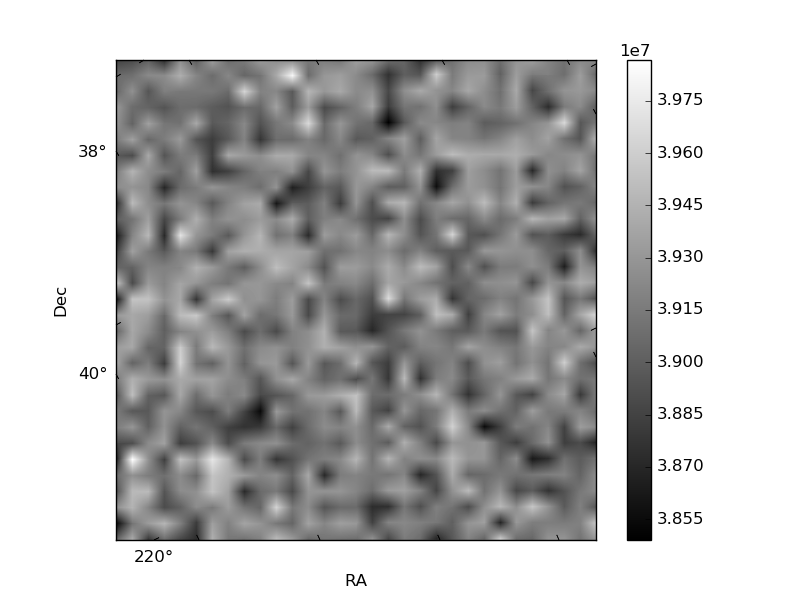
Histogram calculated using DETX and DETY for each event in the final _common_clean file
| Quadrant A | 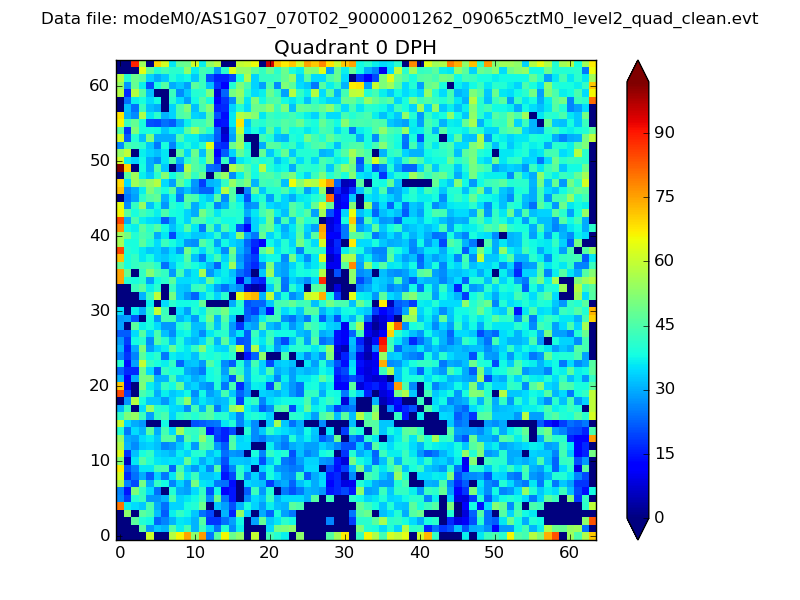 |
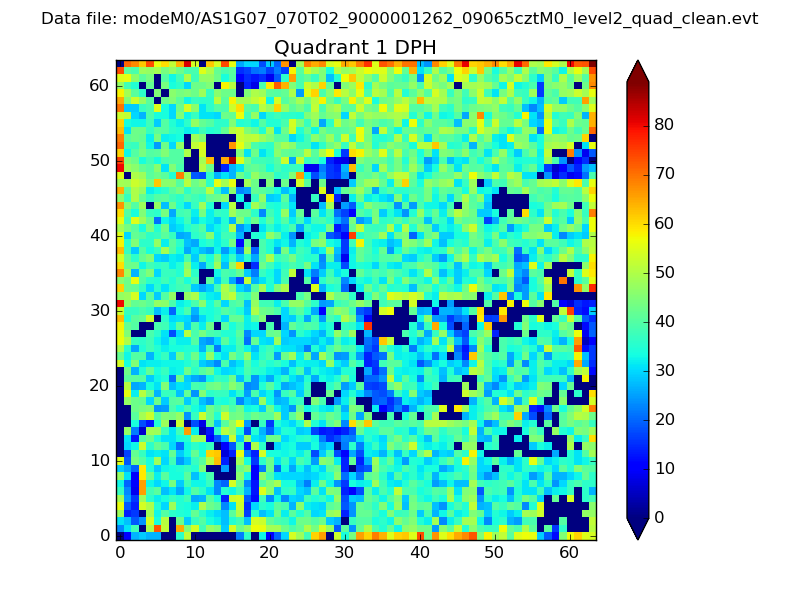 |
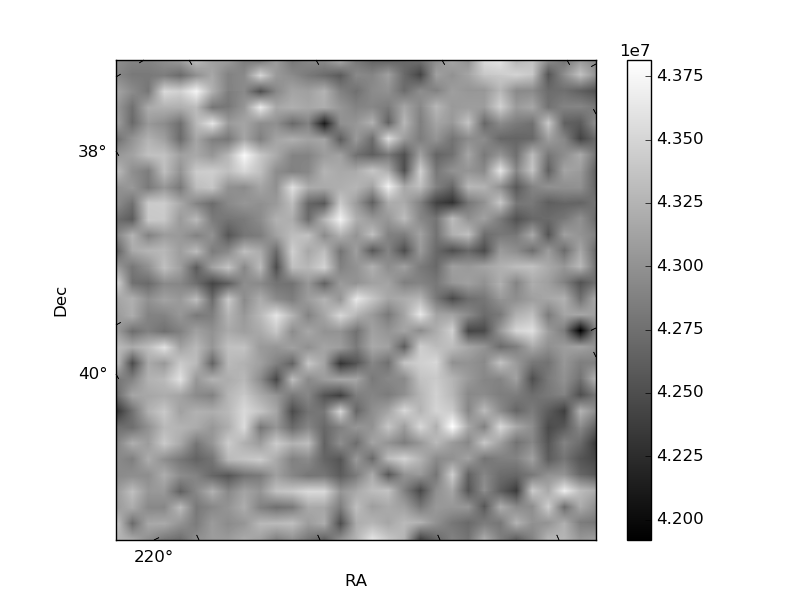
Quadrant B |
|---|---|---|---|
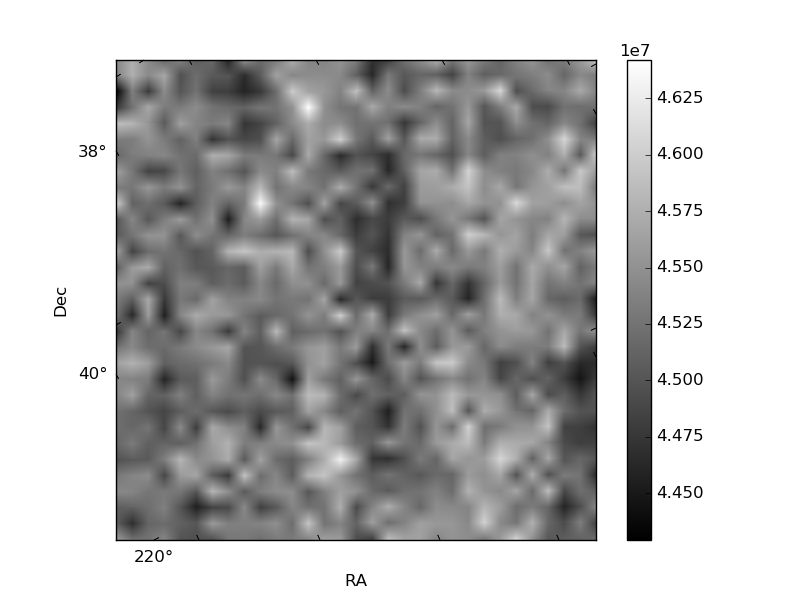
| Quadrant D | 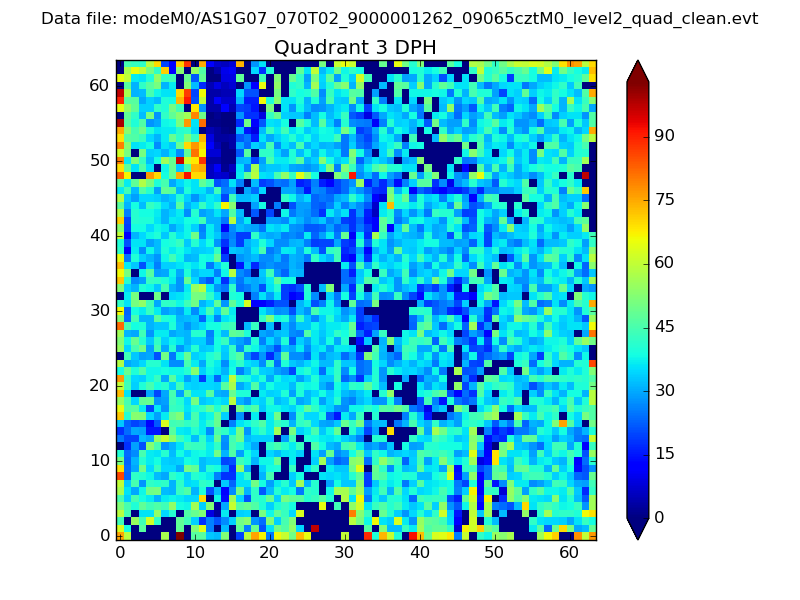 |
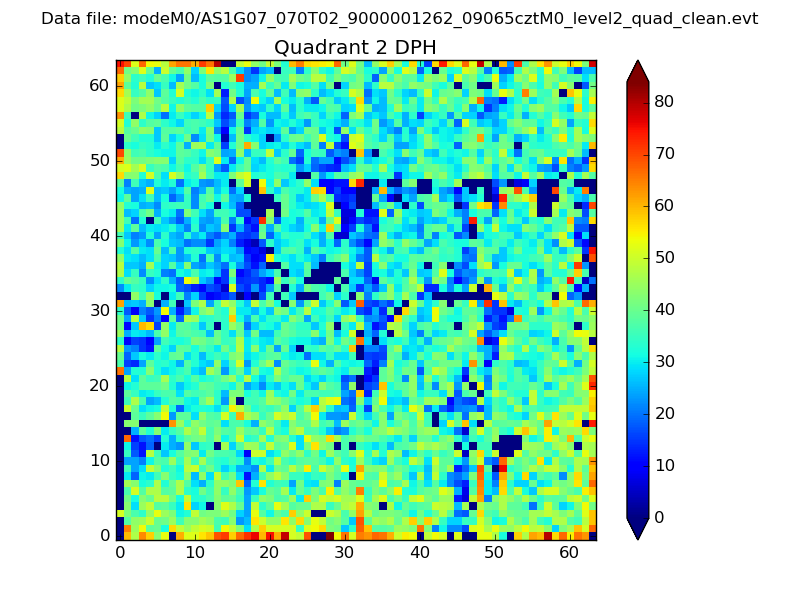 |
Quadrant C |
| Plot type | Count rate plots | Images |
|---|---|---|
| Comparison with Poisson distribution Blue bars denote a histogram of data divided into 1 sec bins. Red curve is a Poisson curve with rate = median count rate of data. |
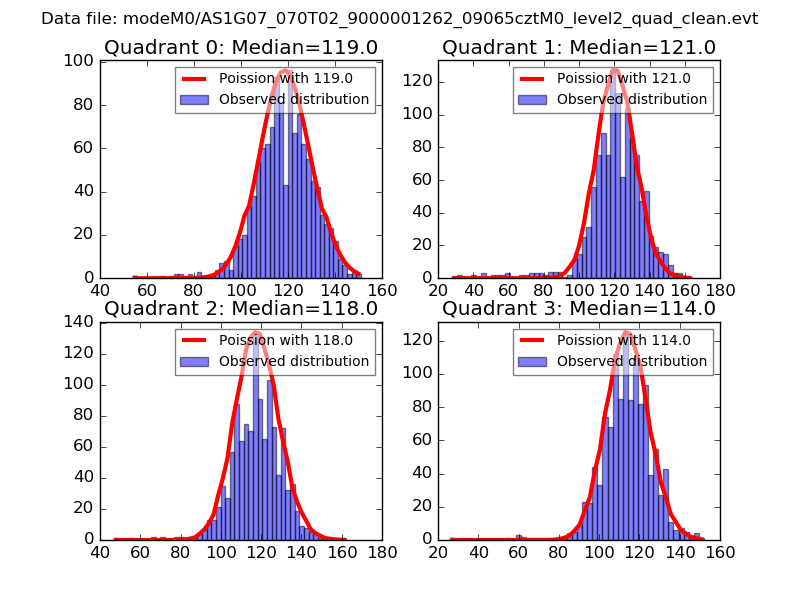 |
 |
| Quadrant-wise count rates Data is divided into 100 sec bins |
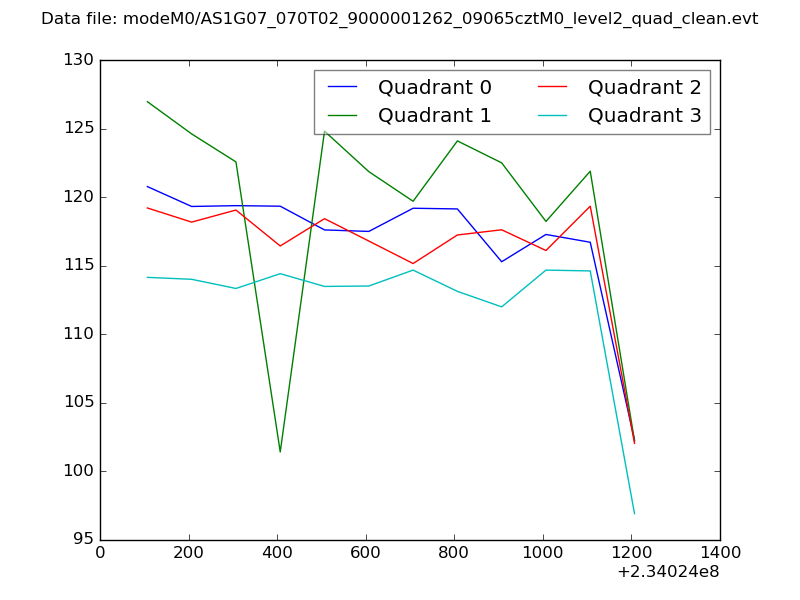 |
|
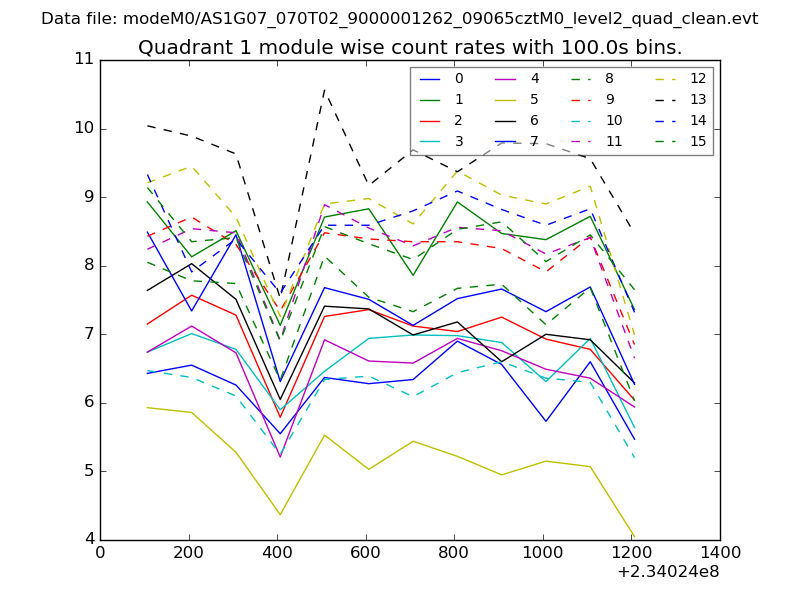
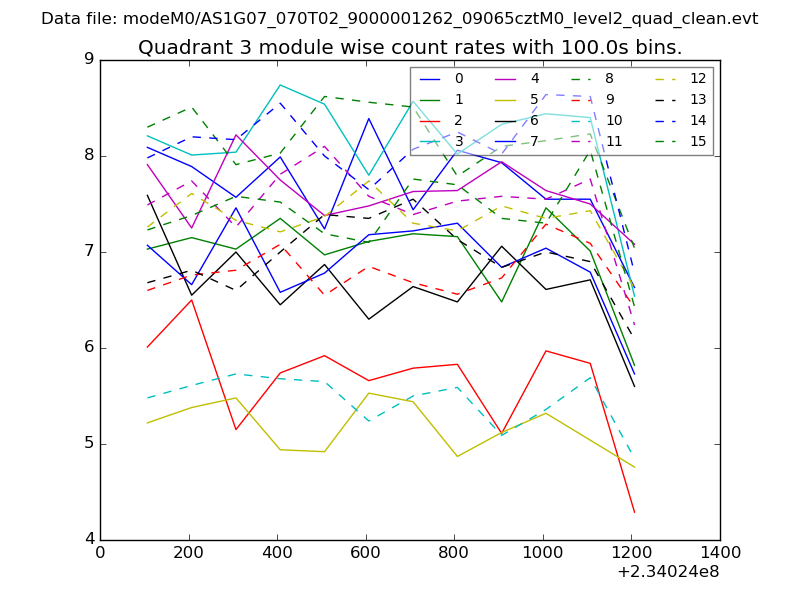
| Module-wise count rates for Quadrant A Data is divided into 100 sec bins |
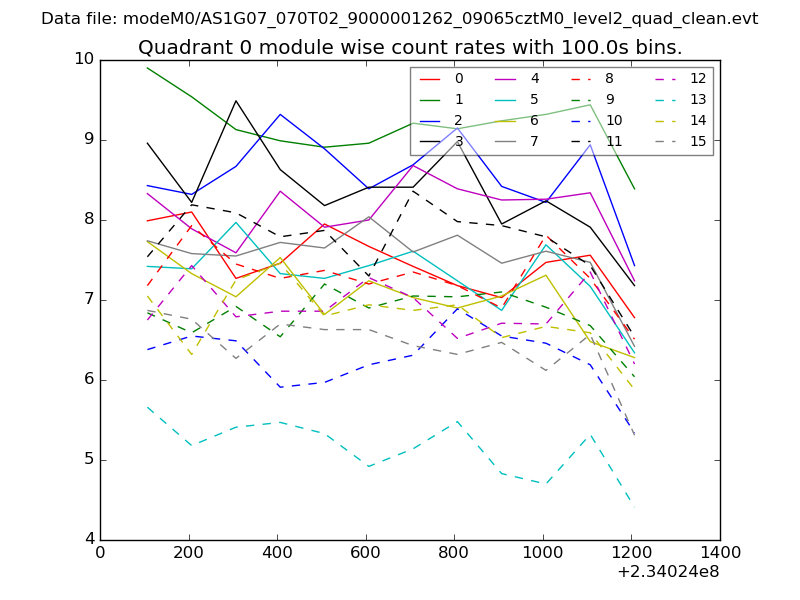 |
 |
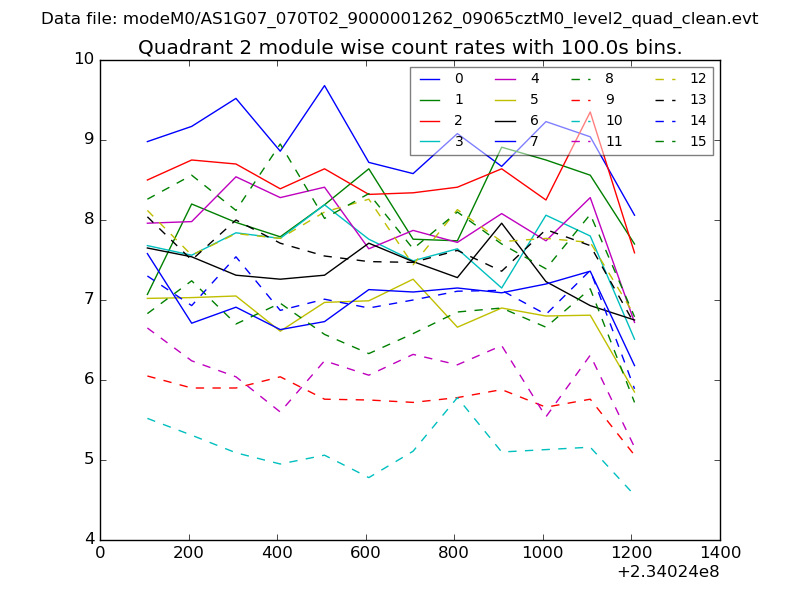
| Module-wise count rates for Quadrant B Data is divided into 100 sec bins |
 |
 |
| Module-wise count rates for Quadrant C Data is divided into 100 sec bins |
 |
 |
| Module-wise count rates for Quadrant D Data is divided into 100 sec bins |
 |
 |
| Parameter | Plot |
|---|---|
| CZT HV Monitor | 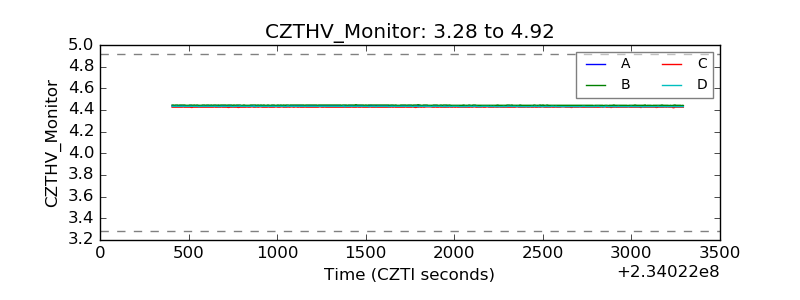 |
| D_VDD | 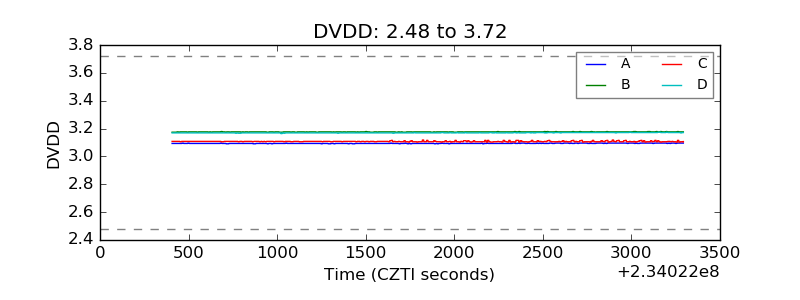 |
| Temperature 1 | 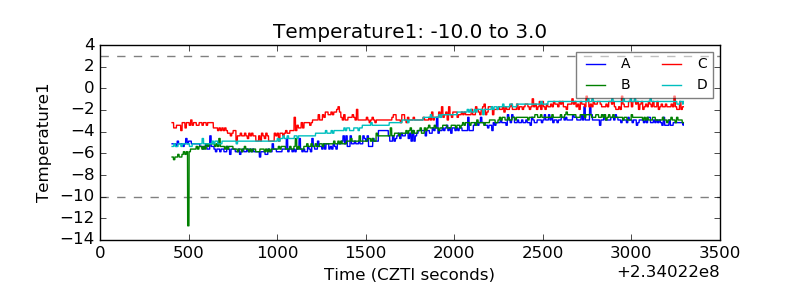 |
| Veto HV Monitor | 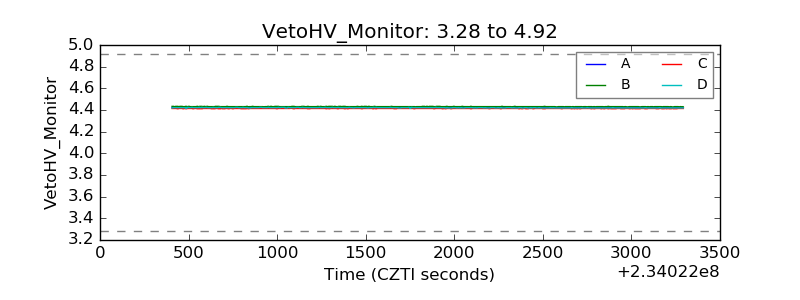 |
| Veto LLD | 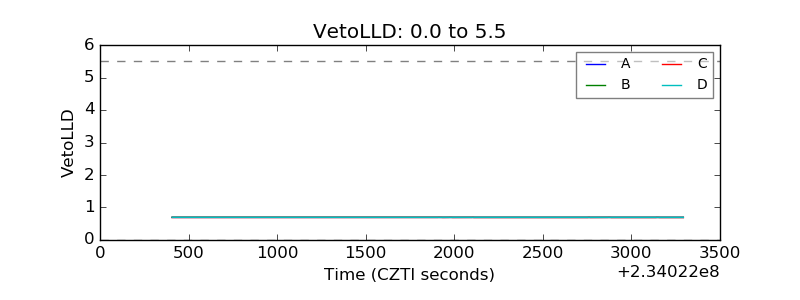 |
| Alpha Counter | 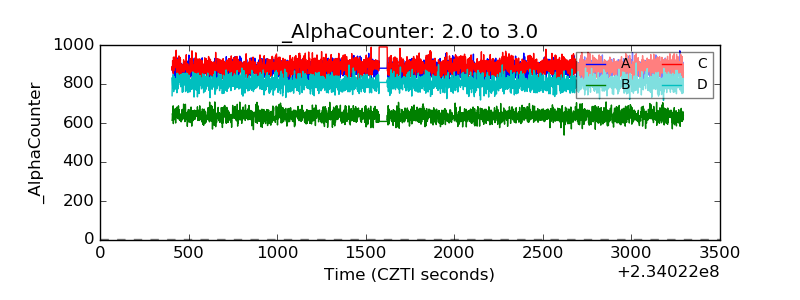 |
| _CPM_Rate | 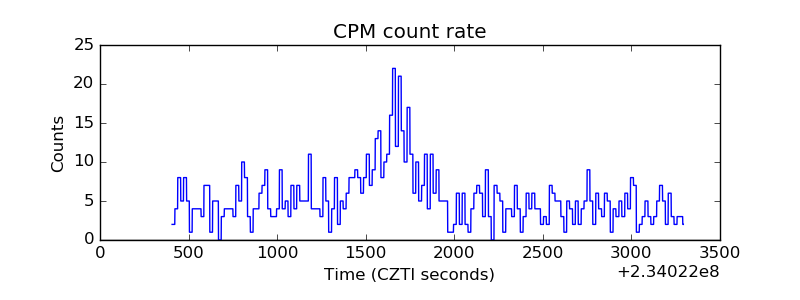 |
| CZT Counter | 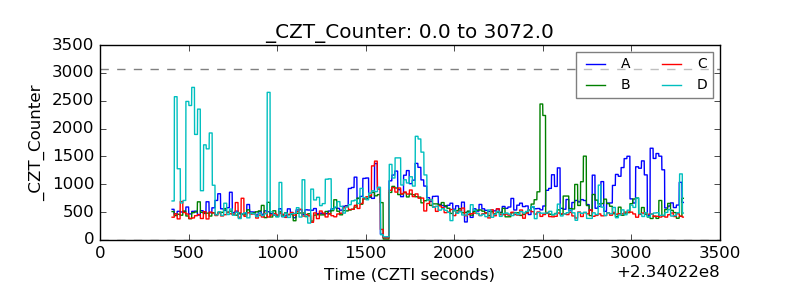 |
| +2.5 Volts monitor |  |
| +5 Volts monitor |  |
| _ROLL_ROT |  |
| _Roll_DEC | 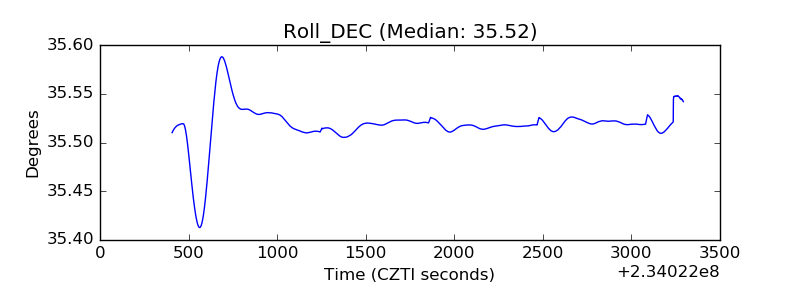 |
| _Roll_RA | 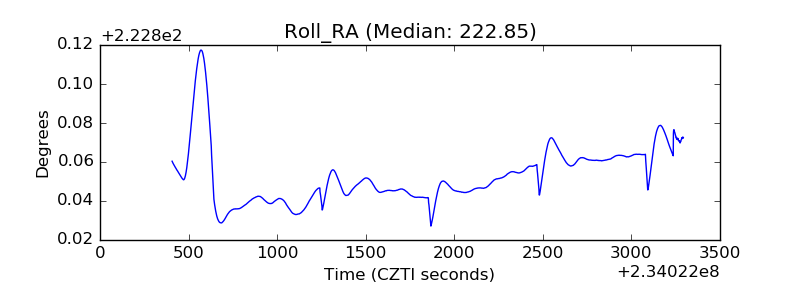 |
| Veto Counter | 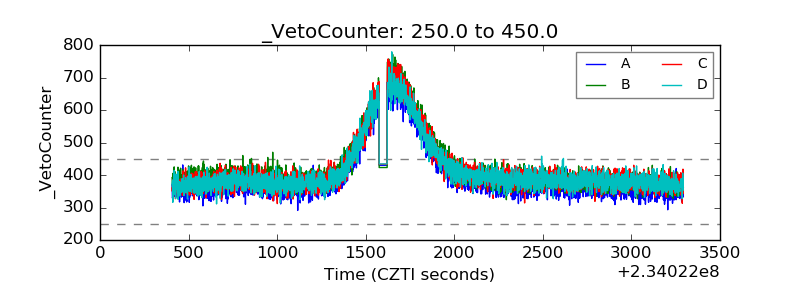 |