| Param | Original file | Final file |
|---|---|---|
| Filename | modeM0/AS1G07_070T02_9000001262_09066cztM0_level2.evt | modeM0/AS1G07_070T02_9000001262_09066cztM0_level2_quad_clean.evt |
| Size (bytes) | 560,111,040 | 99,912,960 |
| Size | 534.2 MB | 95.3 MB |
| Events in quadrant A | 5,384,112 | 627,590 |
| Events in quadrant B | 3,558,446 | 643,233 |
| Events in quadrant C | 3,301,592 | 636,853 |
| Events in quadrant D | 4,226,936 | 612,811 |
| Mode SS | |||
|---|---|---|---|
| Quadrant | BADHDUFLAG | Total packets | Discarded packets |
| A | 0 | 148 | 0 |
| B | 0 | 148 | 0 |
| C | 0 | 148 | 0 |
| D | 0 | 148 | 0 |
| Mode M9 | |||
|---|---|---|---|
| Quadrant | BADHDUFLAG | Total packets | Discarded packets |
| A | 0 | 3 | 0 |
| B | 0 | 3 | 0 |
| C | 0 | 3 | 0 |
| D | 0 | 3 | 0 |
| Mode M0 | |||
|---|---|---|---|
| Quadrant | BADHDUFLAG | Total packets | Discarded packets |
| A | 0 | 21066 | 27 |
| B | 0 | 15479 | 14 |
| C | 0 | 14872 | 10 |
| D | 0 | 17483 | 9 |
| Quadrant | Total seconds | Saturated seconds | Saturation percentage |
|---|---|---|---|
| A | 7252 | 157 | 2.164920% |
| B | 7253 | 123 | 1.695850% |
| C | 7254 | 57 | 0.785773% |
| D | 7255 | 215 | 2.963473% |
Noise dominated data is calculated using 1-second bins in cleaned event files. If a bin has >2000 counts, and if more than 50% of those come from <1% of pixels, then it is considered to be noise-dominated and hence unusable.
| Quadrant | # 1 sec bins | Bins with >0 counts | Bins with >2000 counts | High rate bins dominated by noise | Noise dominated (total time) | Noise dominated (detector-on time) | Marked lightcurve |
|---|---|---|---|---|---|---|---|
| A | 7558 | 7260 | 7 | 7 | 0.09% | 0.10% |  |
| B | 7558 | 7259 | 32 | 32 | 0.42% | 0.44% |  |
| C | 7558 | 7260 | 1 | 1 | 0.01% | 0.01% |  |
| D | 7558 | 7260 | 144 | 144 | 1.91% | 1.98% |  |
Top three noisy pixels from each quadrant. If the there are fewer than three noisy pixels in the level2.evt file, extra rows are filled as -1
| Pixel properties | Quadrant properties | ||||||
|---|---|---|---|---|---|---|---|
| Quadrant | DetID | PixID | Counts | Sigma | Mean | Median | Sigma |
| A | 8 | 5 | 2081599 | 11968.91 | 845 | 826 | 173.8 |
| A | 1 | 162 | 18247 | 100.21 | 845 | 826 | 173.8 |
| A | 13 | 251 | 11038 | 58.74 | 845 | 826 | 173.8 |
| B | 10 | 16 | 213439 | 1297.55 | 851 | 827 | 163.9 |
| B | 12 | 111 | 17884 | 104.09 | 851 | 827 | 163.9 |
| B | 11 | 111 | 14352 | 82.54 | 851 | 827 | 163.9 |
| C | 9 | 68 | 23947 | 119.54 | 832 | 838 | 193.3 |
| C | 8 | 128 | 10890 | 52.0 | 832 | 838 | 193.3 |
| C | 14 | 234 | 6529 | 29.44 | 832 | 838 | 193.3 |
| D | 1 | 52 | 653483 | 2945.2 | 823 | 804 | 221.6 |
| D | 2 | 14 | 99077 | 443.45 | 823 | 804 | 221.6 |
| D | 7 | 71 | 87401 | 390.77 | 823 | 804 | 221.6 |
Histogram calculated using DETX and DETY for each event in the final _common_clean file
| Quadrant A |  |
 |
Quadrant B |
|---|---|---|---|
| Quadrant D |  |
 |
Quadrant C |
| Plot type | Count rate plots | Images |
|---|---|---|
| Comparison with Poisson distribution Blue bars denote a histogram of data divided into 1 sec bins. Red curve is a Poisson curve with rate = median count rate of data. |
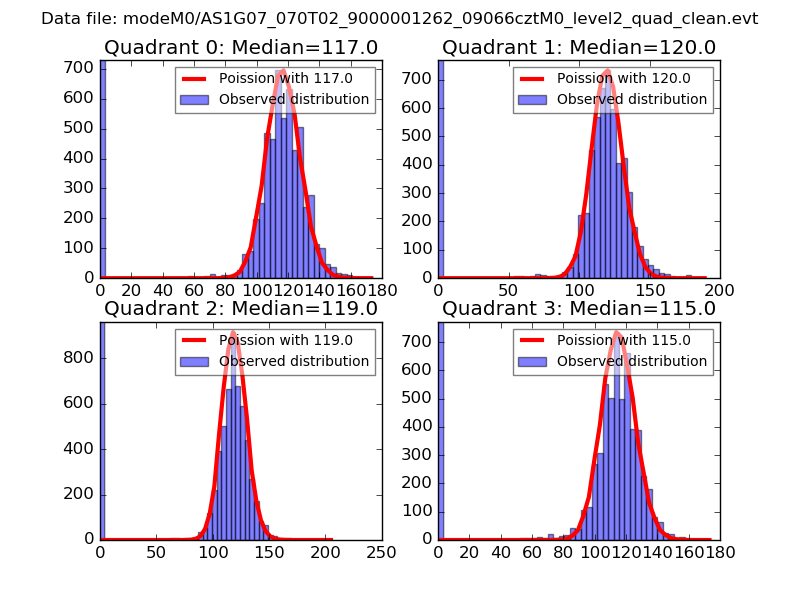 |
 |
| Quadrant-wise count rates Data is divided into 100 sec bins |
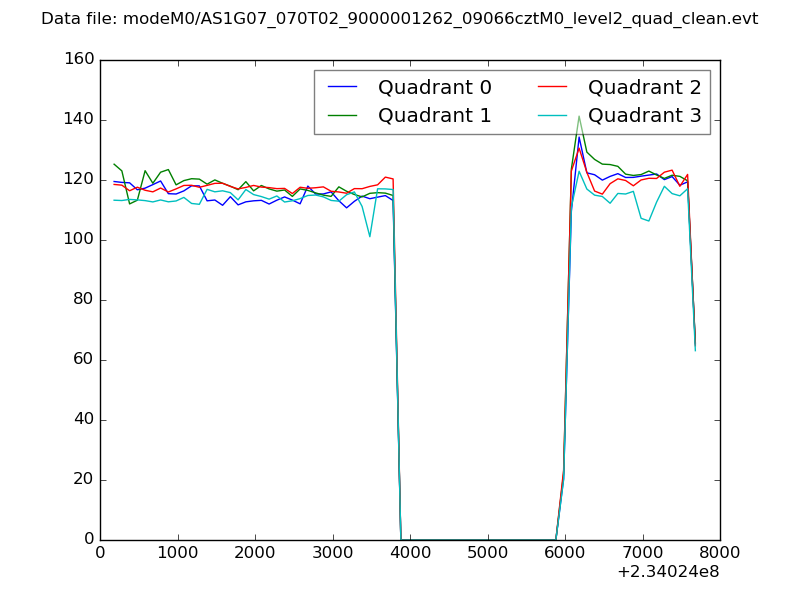 |
|
| Module-wise count rates for Quadrant A Data is divided into 100 sec bins |
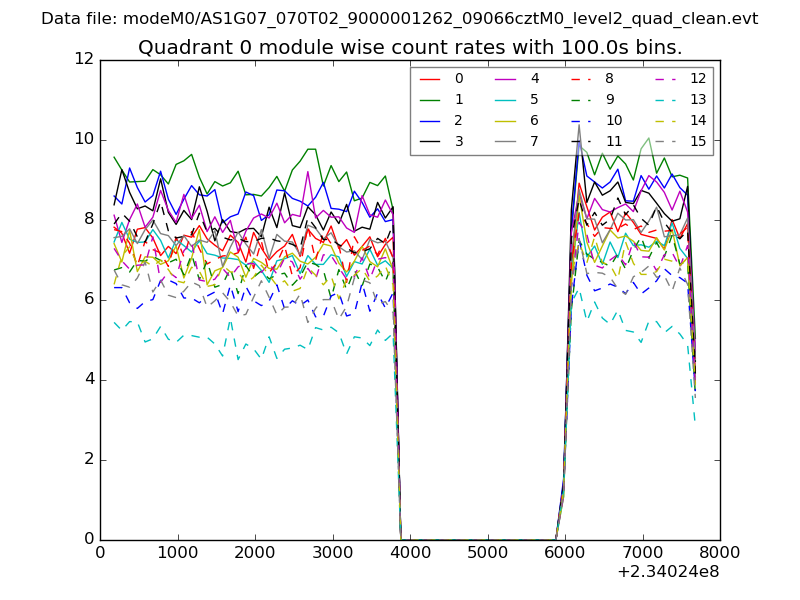 |
 |
| Module-wise count rates for Quadrant B Data is divided into 100 sec bins |
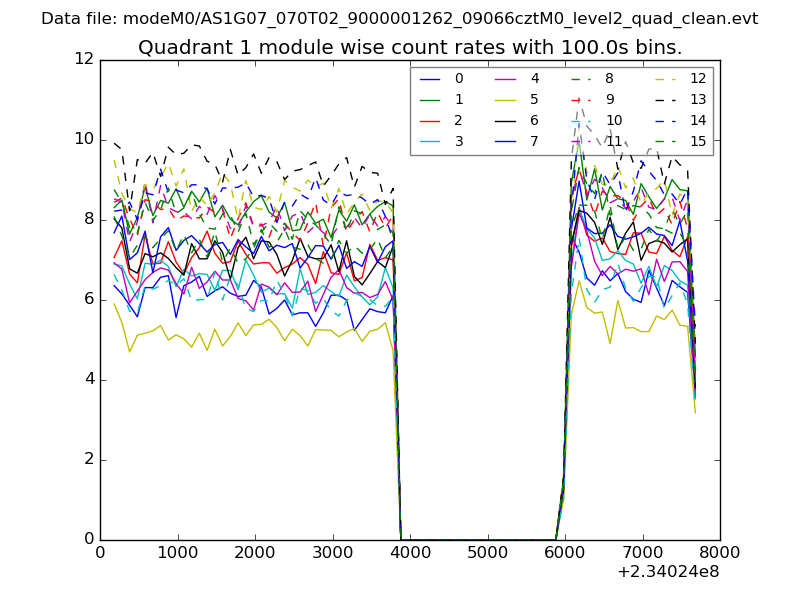 |
 |
| Module-wise count rates for Quadrant C Data is divided into 100 sec bins |
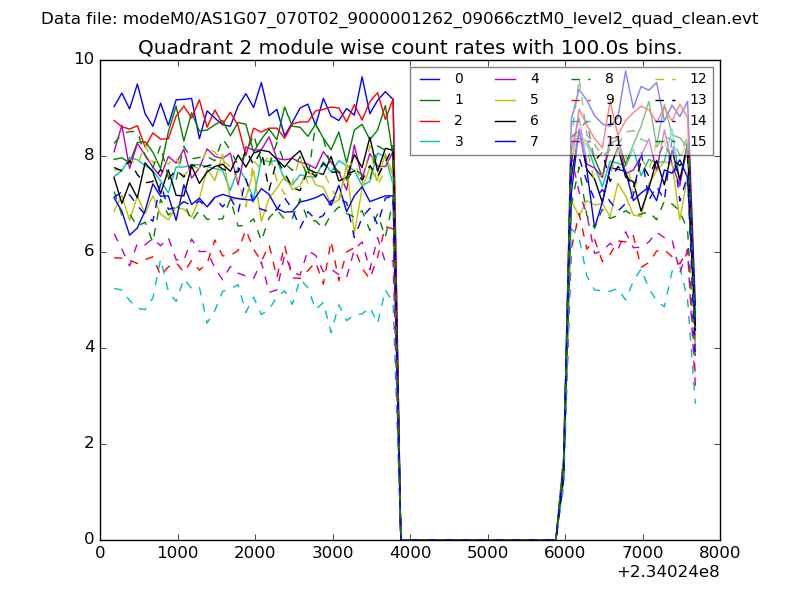 |
 |
| Module-wise count rates for Quadrant D Data is divided into 100 sec bins |
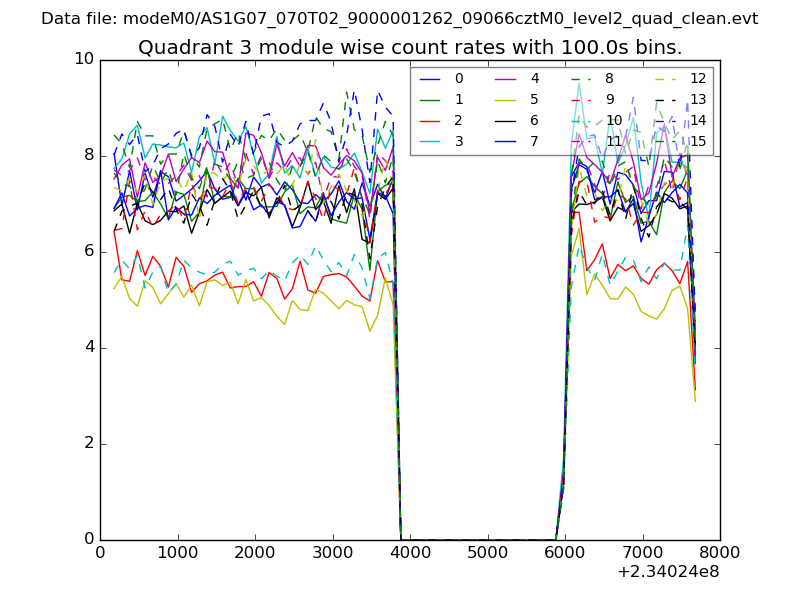 |
 |
| Parameter | Plot |
|---|---|
| CZT HV Monitor | 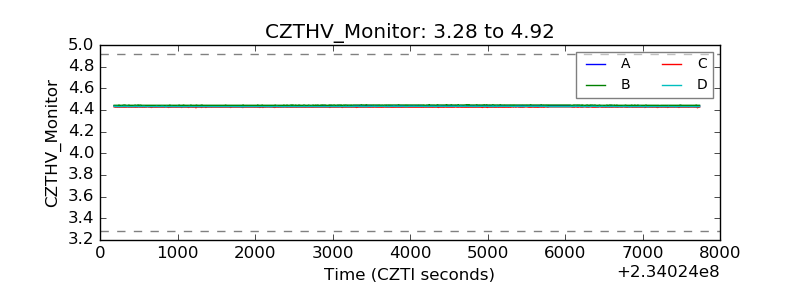 |
| D_VDD |  |
| Temperature 1 |  |
| Veto HV Monitor |  |
| Veto LLD |  |
| Alpha Counter | 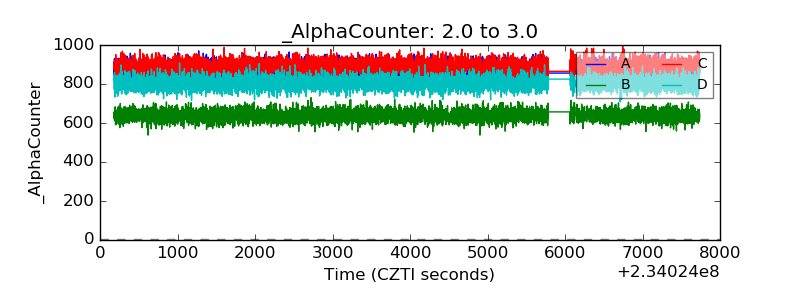 |
| _CPM_Rate | 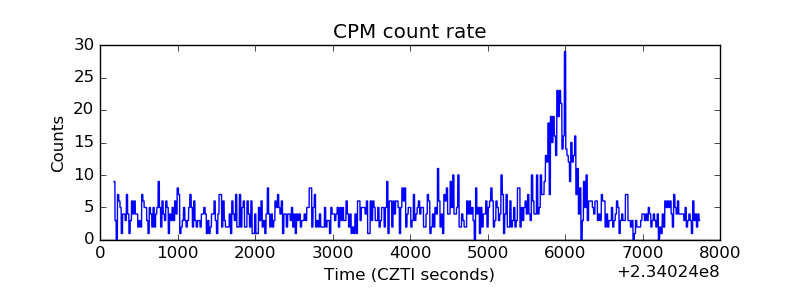 |
| CZT Counter |  |
| +2.5 Volts monitor |  |
| +5 Volts monitor |  |
| _ROLL_ROT | 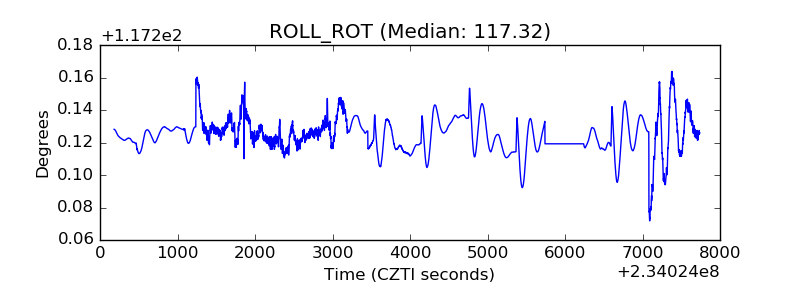 |
| _Roll_DEC | 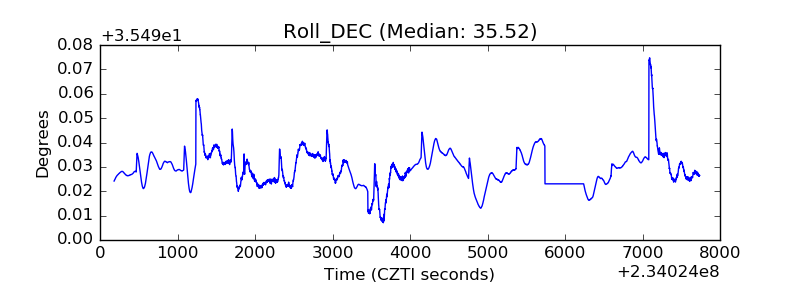 |
| _Roll_RA |  |
| Veto Counter | 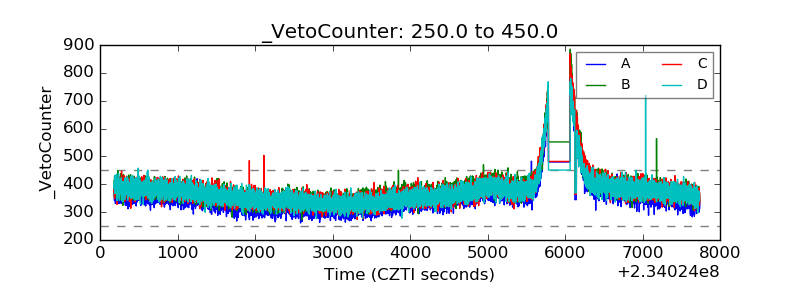 |