| Param | Original file | Final file |
|---|---|---|
| Filename | modeM0/AS1G07_070T02_9000001262_09069cztM0_level2.evt | modeM0/AS1G07_070T02_9000001262_09069cztM0_level2_quad_clean.evt |
| Size (bytes) | 1,207,572,480 | 227,001,600 |
| Size | 1.1 GB | 216.5 MB |
| Events in quadrant A | 9,405,019 | 1,407,234 |
| Events in quadrant B | 8,196,401 | 1,425,191 |
| Events in quadrant C | 7,915,441 | 1,424,094 |
| Events in quadrant D | 9,836,408 | 1,377,428 |
| Mode SS | |||
|---|---|---|---|
| Quadrant | BADHDUFLAG | Total packets | Discarded packets |
| A | 0 | 368 | 0 |
| B | 0 | 368 | 0 |
| C | 0 | 368 | 0 |
| D | 0 | 368 | 2 |
| Mode M9 | |||
|---|---|---|---|
| Quadrant | BADHDUFLAG | Total packets | Discarded packets |
| A | 0 | 20 | 0 |
| B | 0 | 20 | 0 |
| C | 0 | 20 | 0 |
| D | 0 | 20 | 0 |
| Mode M0 | |||
|---|---|---|---|
| Quadrant | BADHDUFLAG | Total packets | Discarded packets |
| A | 0 | 39994 | 16 |
| B | 0 | 36901 | 13 |
| C | 0 | 36608 | 11 |
| D | 0 | 41544 | 5 |
| Quadrant | Total seconds | Saturated seconds | Saturation percentage |
|---|---|---|---|
| A | 18006 | 144 | 0.799733% |
| B | 18005 | 100 | 0.555401% |
| C | 18006 | 46 | 0.255470% |
| D | 18009 | 297 | 1.649175% |
Noise dominated data is calculated using 1-second bins in cleaned event files. If a bin has >2000 counts, and if more than 50% of those come from <1% of pixels, then it is considered to be noise-dominated and hence unusable.
| Quadrant | # 1 sec bins | Bins with >0 counts | Bins with >2000 counts | High rate bins dominated by noise | Noise dominated (total time) | Noise dominated (detector-on time) | Marked lightcurve |
|---|---|---|---|---|---|---|---|
| A | 20070 | 18013 | 16 | 16 | 0.08% | 0.09% | 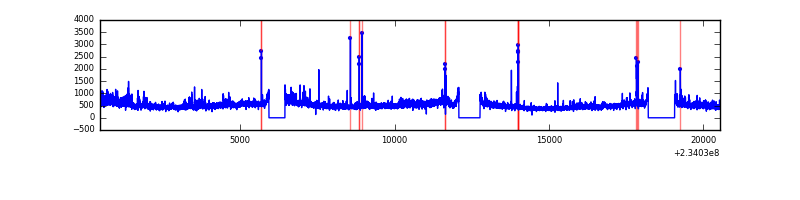 |
| B | 20070 | 18011 | 4 | 4 | 0.02% | 0.02% | 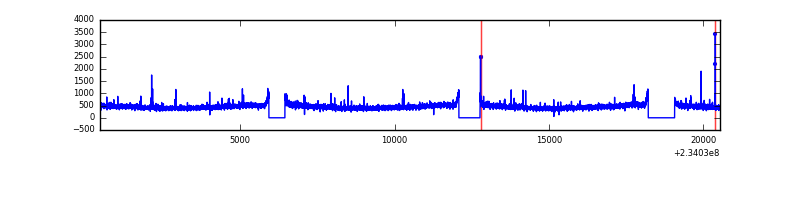 |
| C | 20070 | 18013 | 2 | 2 | 0.01% | 0.01% | 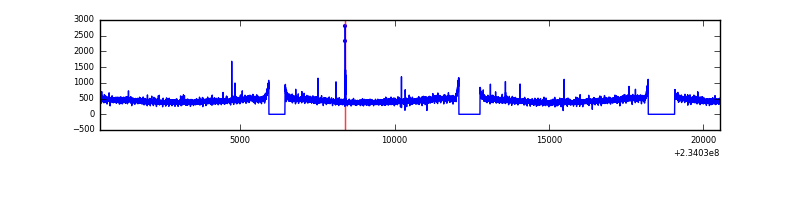 |
| D | 20070 | 18013 | 181 | 181 | 0.90% | 1.00% | 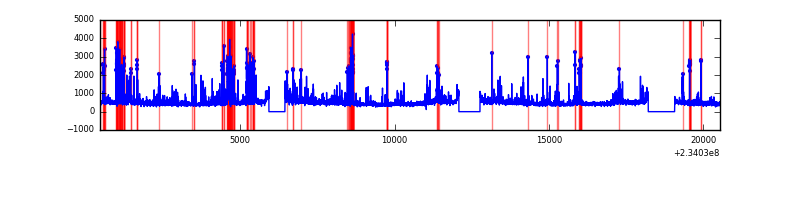 |
Top three noisy pixels from each quadrant. If the there are fewer than three noisy pixels in the level2.evt file, extra rows are filled as -1
| Pixel properties | Quadrant properties | ||||||
|---|---|---|---|---|---|---|---|
| Quadrant | DetID | PixID | Counts | Sigma | Mean | Median | Sigma |
| A | 8 | 5 | 1342651 | 3238.7 | 2053 | 2008 | 413.9 |
| A | 5 | 16 | 53264 | 123.82 | 2053 | 2008 | 413.9 |
| A | 15 | 239 | 49183 | 113.96 | 2053 | 2008 | 413.9 |
| B | 12 | 111 | 43223 | 104.63 | 2071 | 2021 | 393.8 |
| B | 0 | 214 | 35839 | 85.88 | 2071 | 2021 | 393.8 |
| B | 11 | 111 | 35135 | 84.09 | 2071 | 2021 | 393.8 |
| C | 14 | 234 | 28537 | 56.81 | 2019 | 2031 | 466.5 |
| C | 13 | 61 | 15151 | 28.12 | 2019 | 2031 | 466.5 |
| C | 12 | 4 | 10146 | 17.39 | 2019 | 2031 | 466.5 |
| D | 2 | 14 | 704553 | 1349.42 | 1998 | 1946 | 520.7 |
| D | 1 | 52 | 606611 | 1161.31 | 1998 | 1946 | 520.7 |
| D | 8 | 195 | 352105 | 672.51 | 1998 | 1946 | 520.7 |
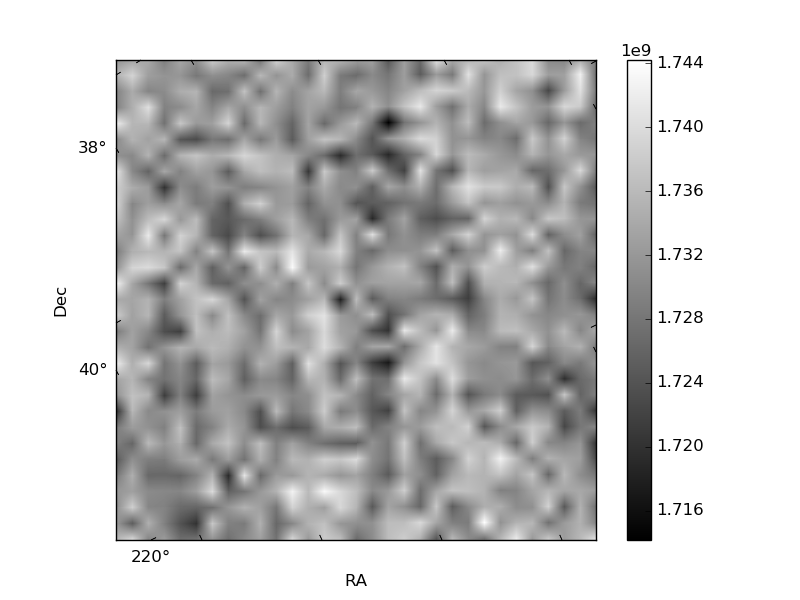
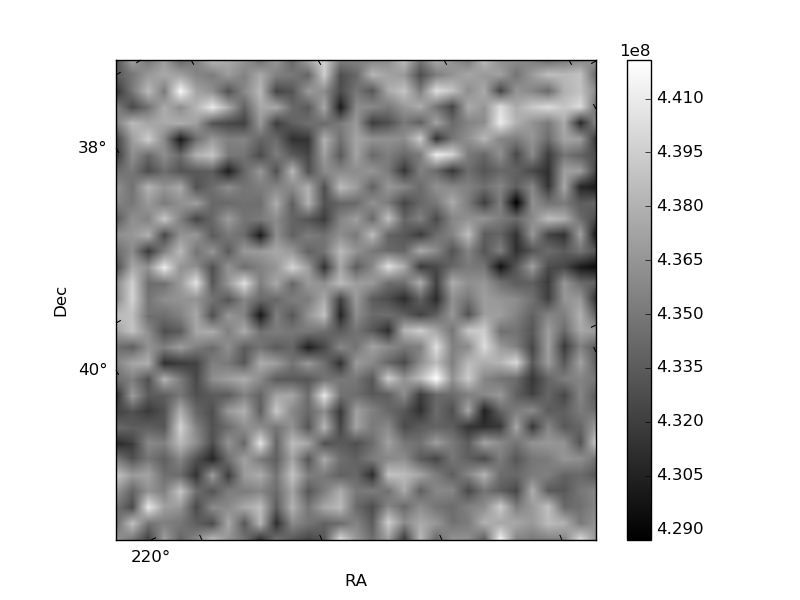
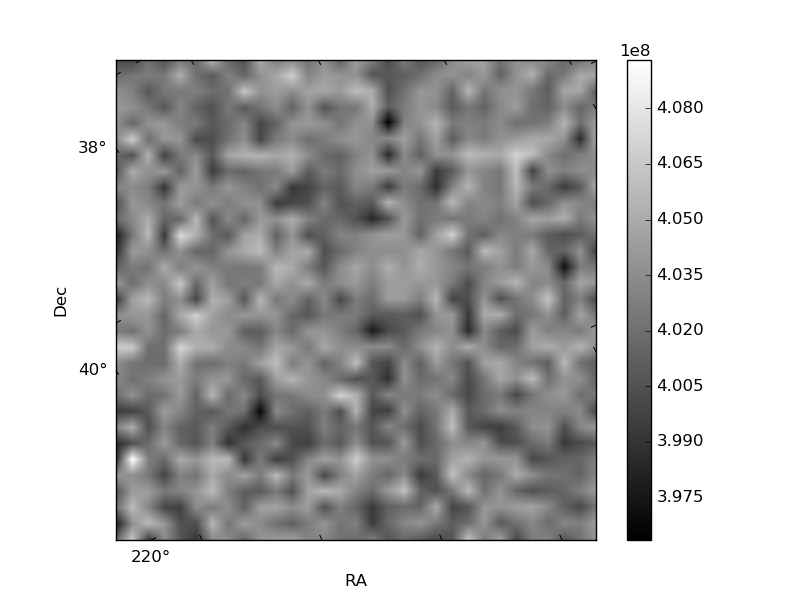
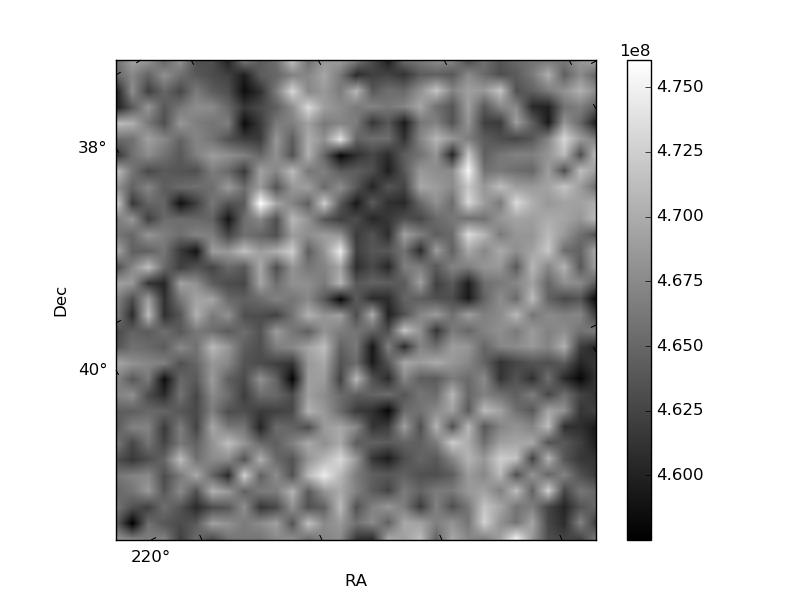
Histogram calculated using DETX and DETY for each event in the final _common_clean file
| Quadrant A | 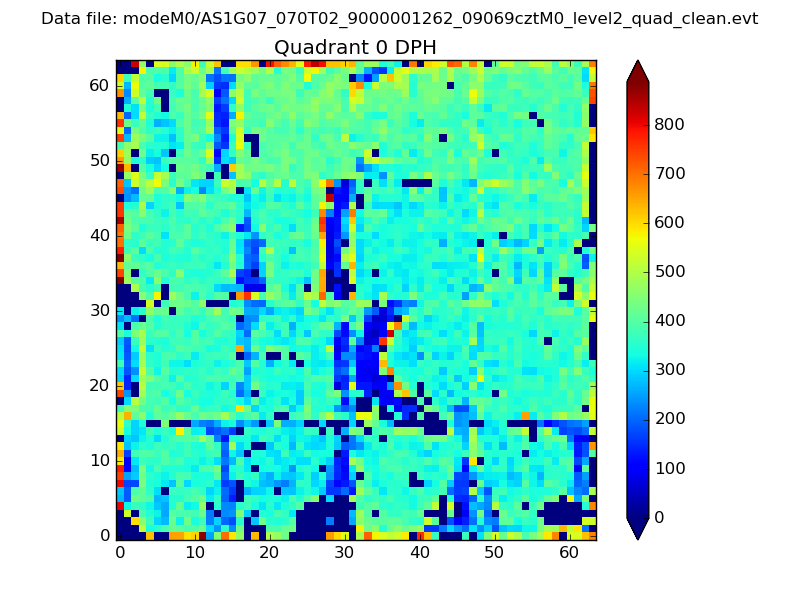 |
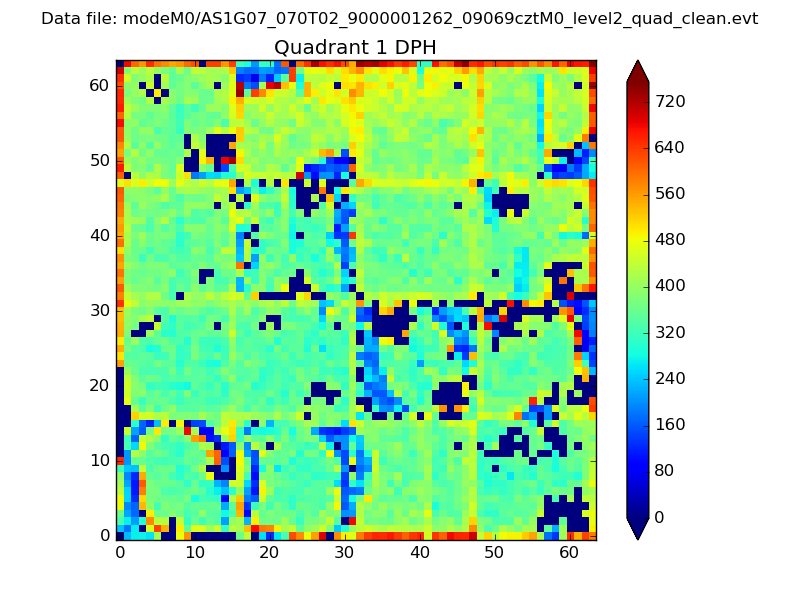 |
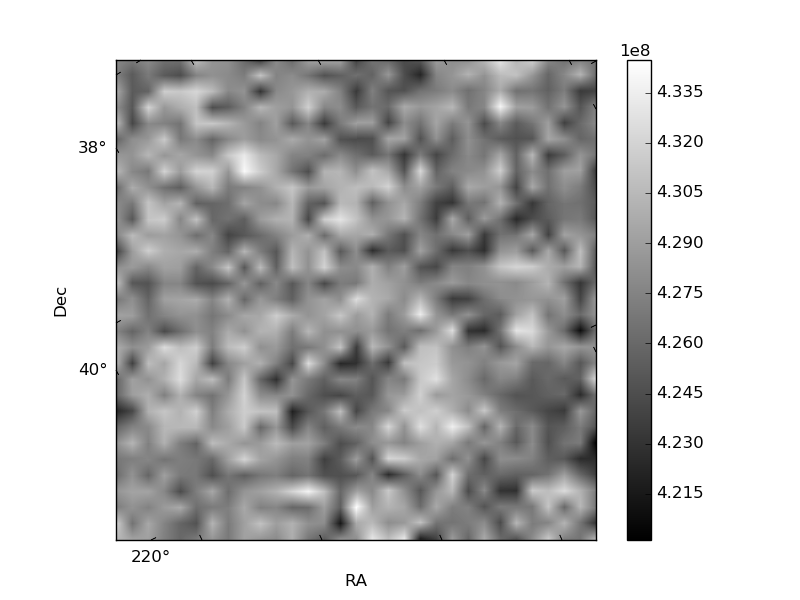
Quadrant B |
|---|---|---|---|
| Quadrant D | 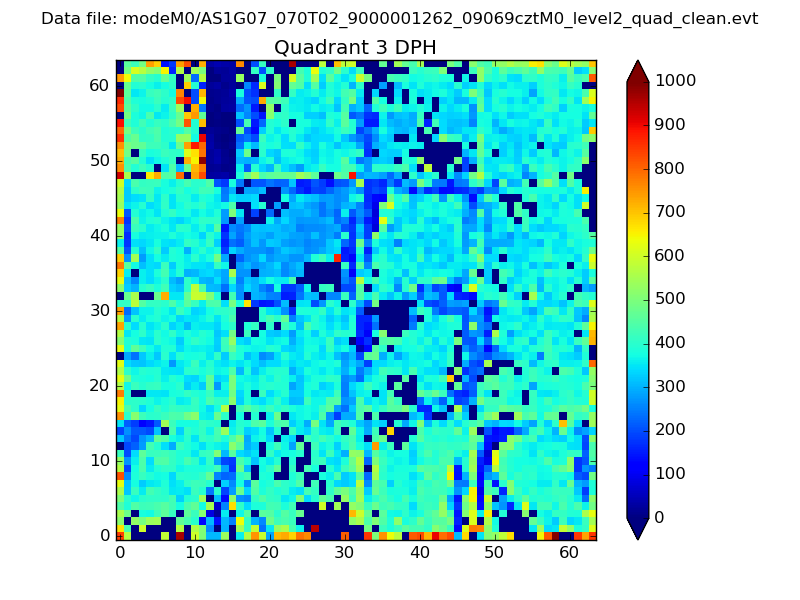 |
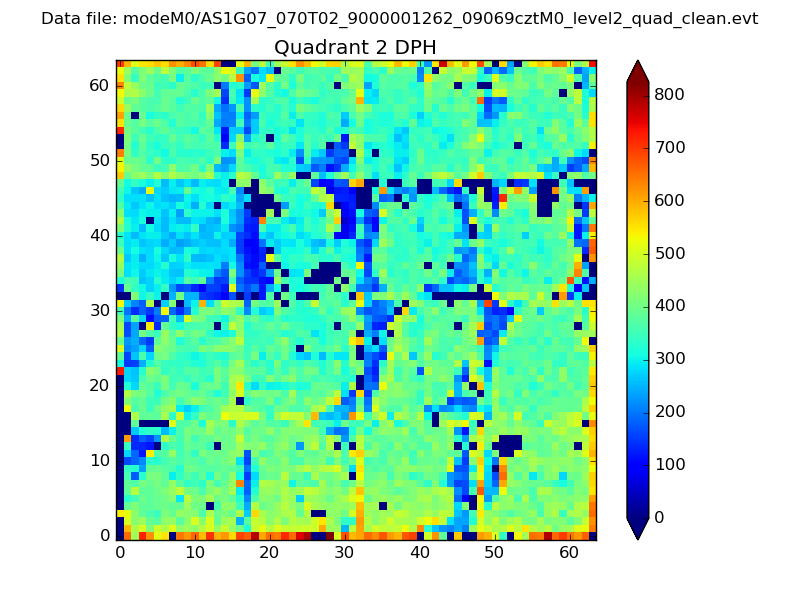 |
Quadrant C |
| Plot type | Count rate plots | Images |
|---|---|---|
| Comparison with Poisson distribution Blue bars denote a histogram of data divided into 1 sec bins. Red curve is a Poisson curve with rate = median count rate of data. |
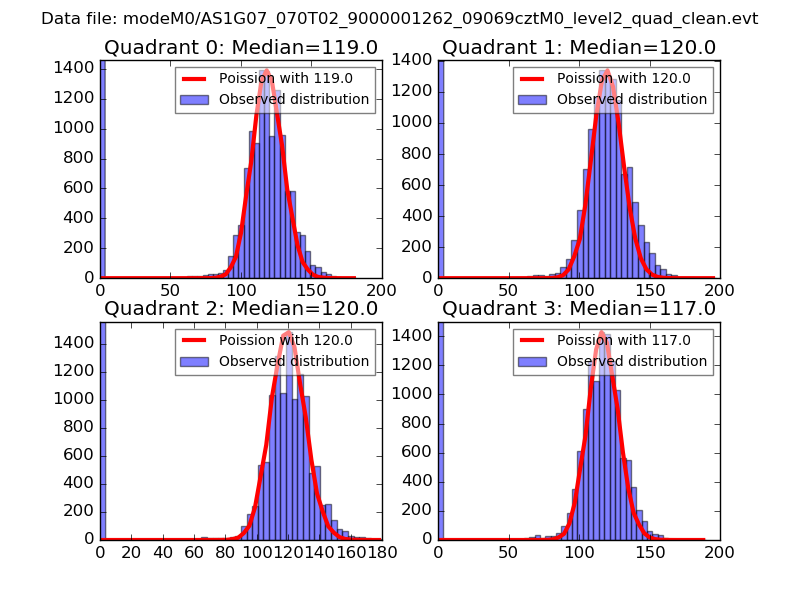 |
 |
| Quadrant-wise count rates Data is divided into 100 sec bins |
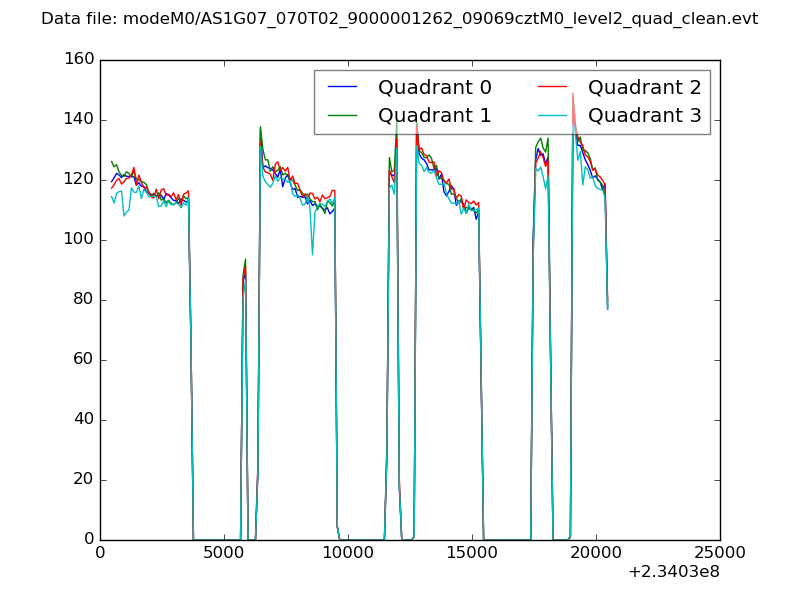 |
|
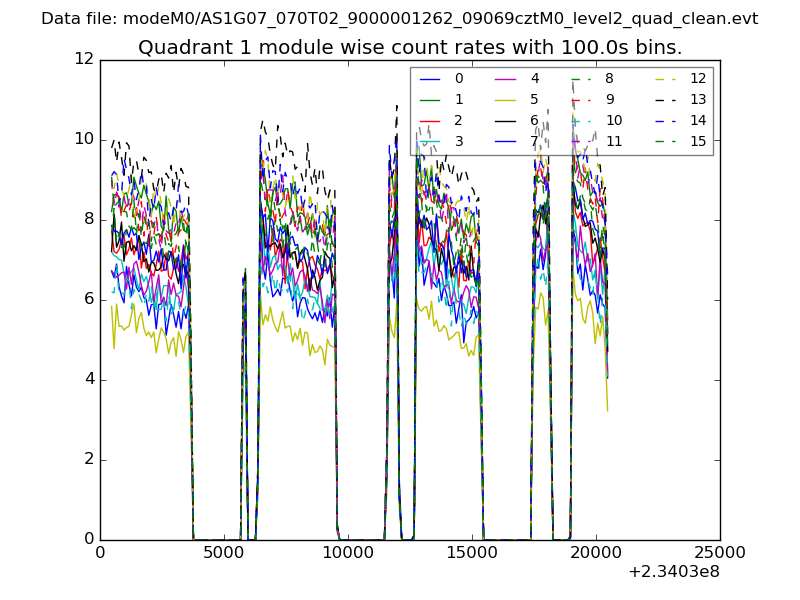
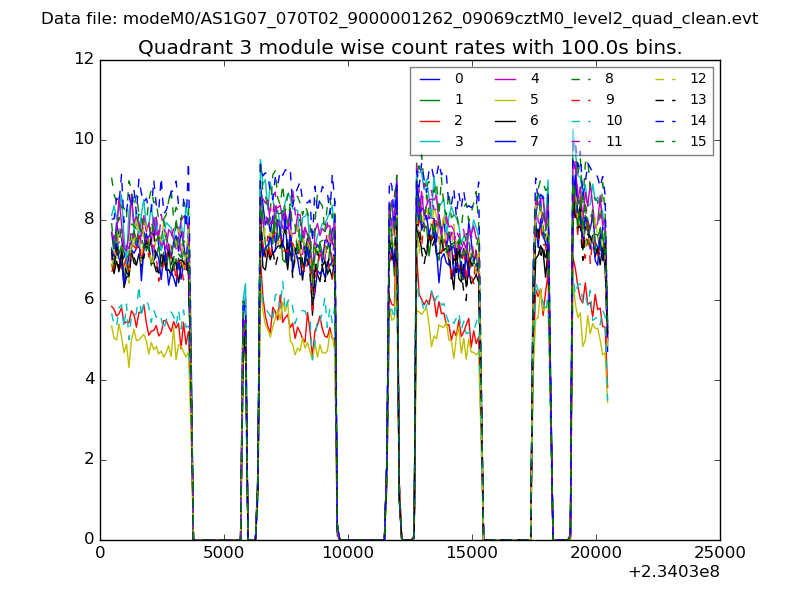
| Module-wise count rates for Quadrant A Data is divided into 100 sec bins |
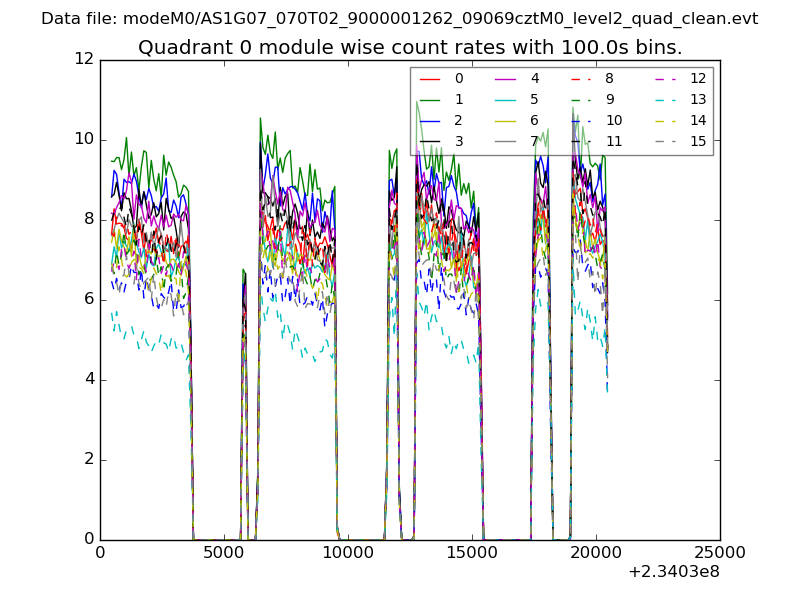 |
 |
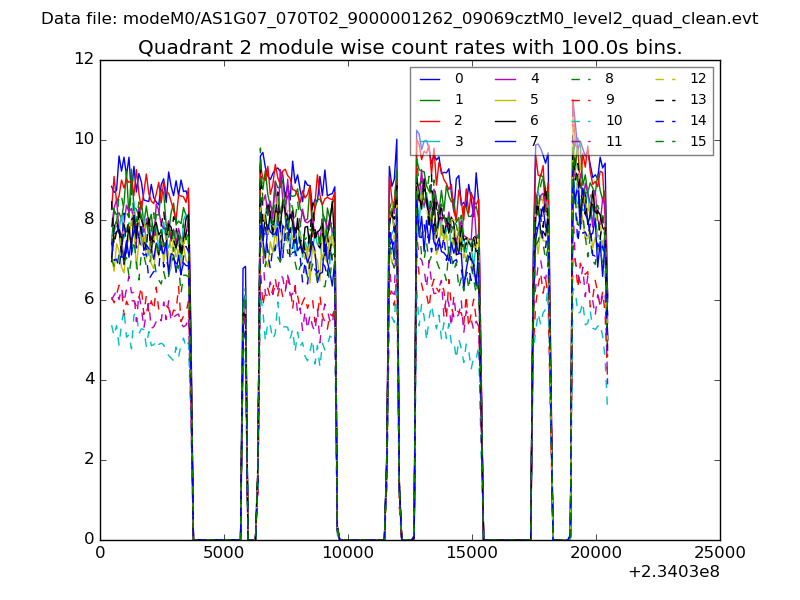
| Module-wise count rates for Quadrant B Data is divided into 100 sec bins |
 |
 |
| Module-wise count rates for Quadrant C Data is divided into 100 sec bins |
 |
 |
| Module-wise count rates for Quadrant D Data is divided into 100 sec bins |
 |
 |
| Parameter | Plot |
|---|---|
| CZT HV Monitor | 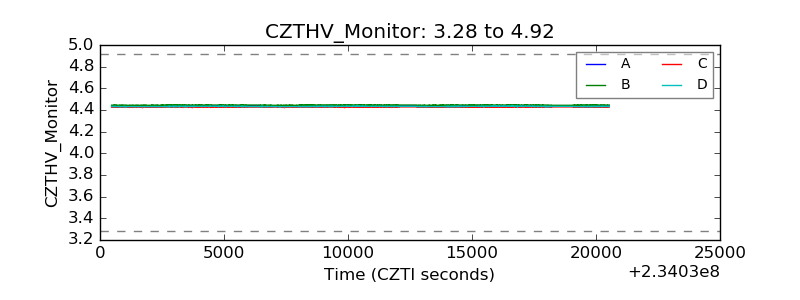 |
| D_VDD | 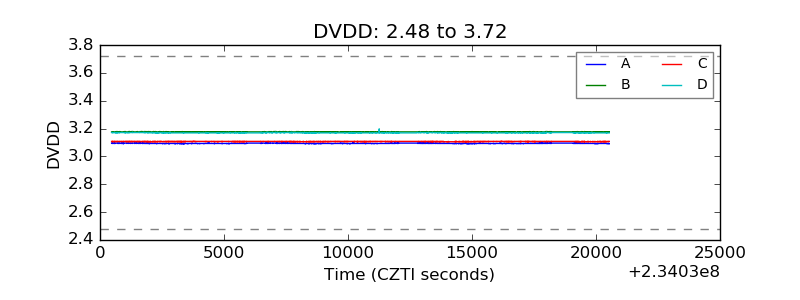 |
| Temperature 1 | 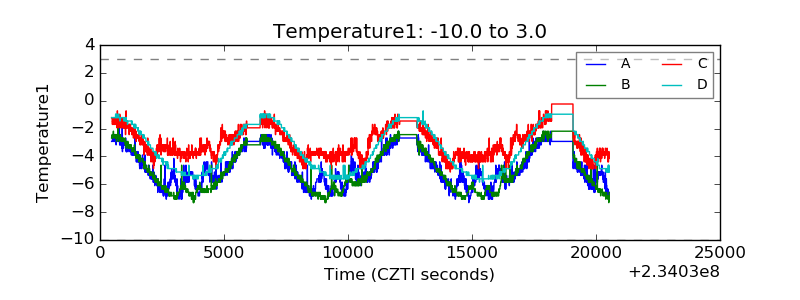 |
| Veto HV Monitor | 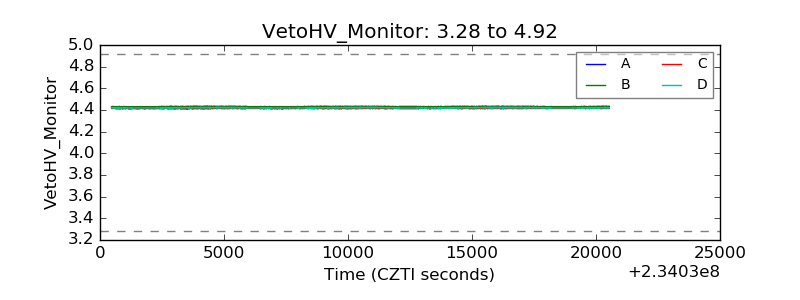 |
| Veto LLD | 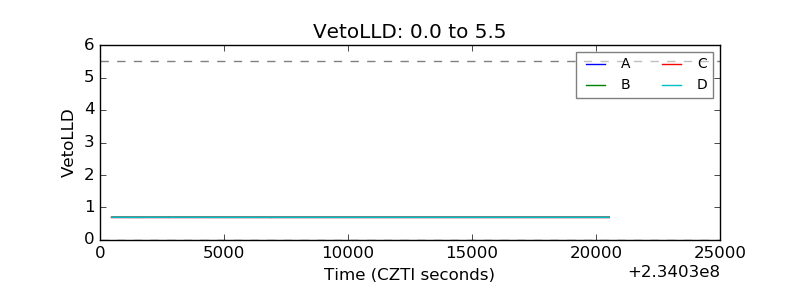 |
| Alpha Counter | 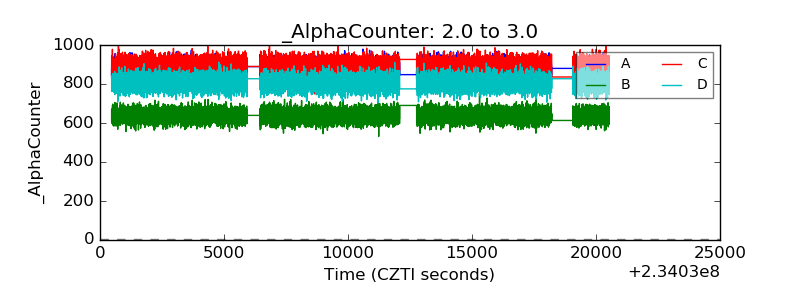 |
| _CPM_Rate | 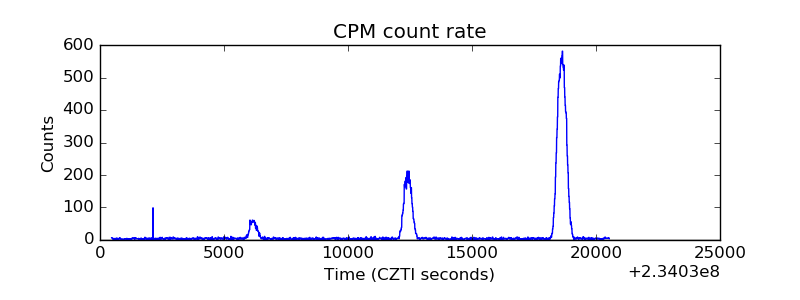 |
| CZT Counter | 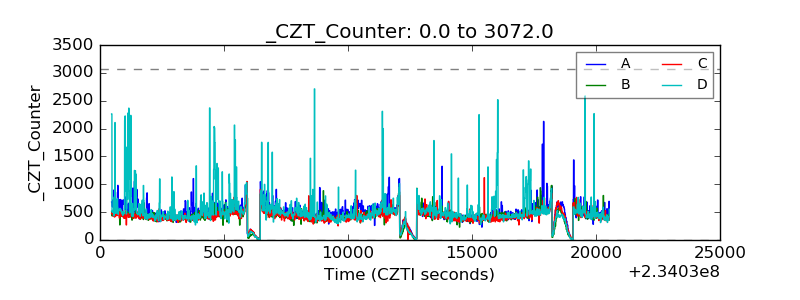 |
| +2.5 Volts monitor |  |
| +5 Volts monitor | 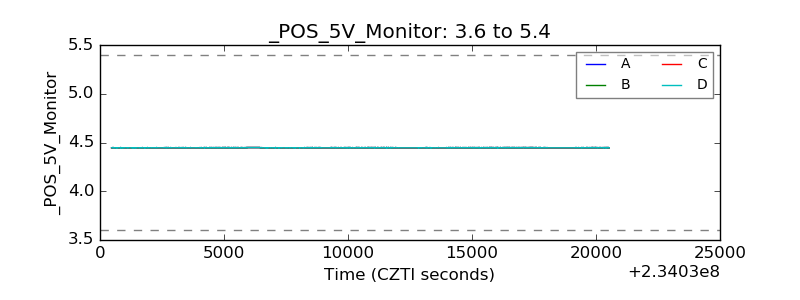 |
| _ROLL_ROT | 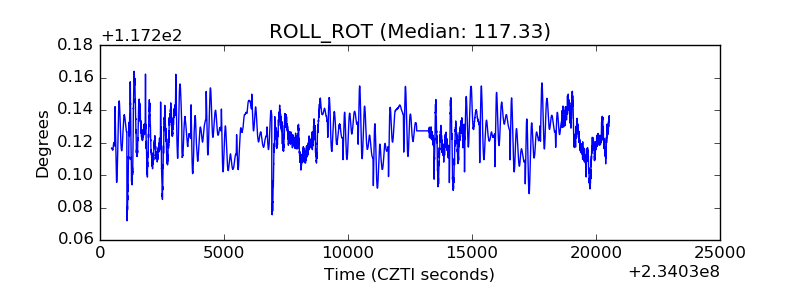 |
| _Roll_DEC | 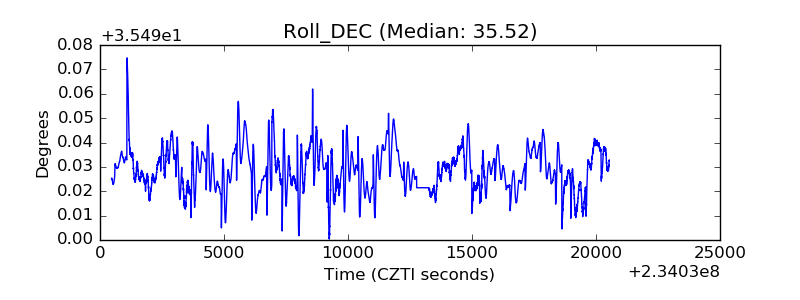 |
| _Roll_RA | 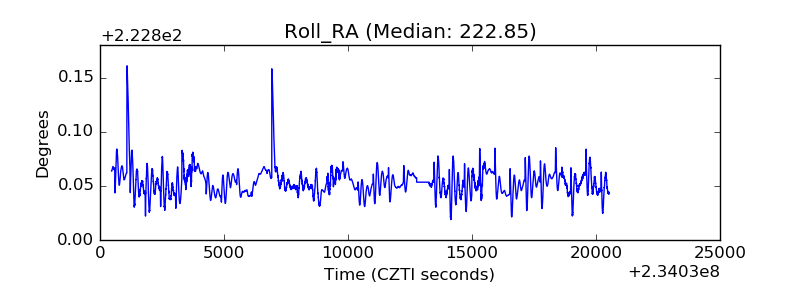 |
| Veto Counter | 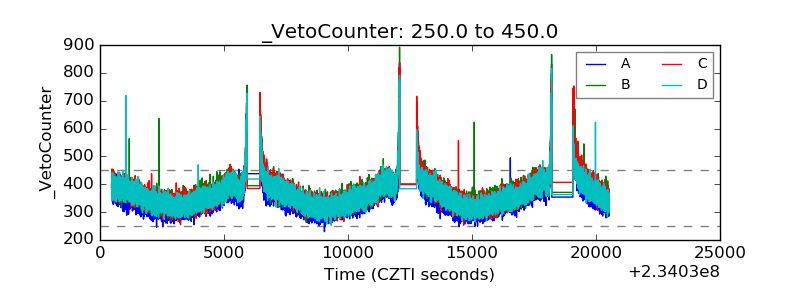 |