| Param | Original file | Final file |
|---|---|---|
| Filename | modeM0/AS1G07_070T02_9000001262_09073cztM0_level2.evt | modeM0/AS1G07_070T02_9000001262_09073cztM0_level2_quad_clean.evt |
| Size (bytes) | 56,943,360 | 16,560,000 |
| Size | 54.3 MB | 15.8 MB |
| Events in quadrant A | 519,221 | 110,118 |
| Events in quadrant B | 384,008 | 114,697 |
| Events in quadrant C | 375,301 | 110,915 |
| Events in quadrant D | 391,517 | 105,328 |
| Mode SS | |||
|---|---|---|---|
| Quadrant | BADHDUFLAG | Total packets | Discarded packets |
| A | 0 | 16 | 0 |
| B | 0 | 16 | 0 |
| C | 0 | 16 | 0 |
| D | 0 | 16 | 0 |
| Mode M9 | |||
|---|---|---|---|
| Quadrant | BADHDUFLAG | Total packets | Discarded packets |
| A | 0 | 8 | 0 |
| B | 0 | 8 | 0 |
| C | 0 | 8 | 0 |
| D | 0 | 9 | 0 |
| Mode M0 | |||
|---|---|---|---|
| Quadrant | BADHDUFLAG | Total packets | Discarded packets |
| A | 0 | 2062 | 1 |
| B | 0 | 1567 | 1 |
| C | 0 | 1542 | 1 |
| D | 0 | 1643 | 1 |
| Quadrant | Total seconds | Saturated seconds | Saturation percentage |
|---|---|---|---|
| A | 748 | 5 | 0.668449% |
| B | 748 | 1 | 0.133690% |
| C | 748 | 3 | 0.401070% |
| D | 748 | 1 | 0.133690% |
Noise dominated data is calculated using 1-second bins in cleaned event files. If a bin has >2000 counts, and if more than 50% of those come from <1% of pixels, then it is considered to be noise-dominated and hence unusable.
| Quadrant | # 1 sec bins | Bins with >0 counts | Bins with >2000 counts | High rate bins dominated by noise | Noise dominated (total time) | Noise dominated (detector-on time) | Marked lightcurve |
|---|---|---|---|---|---|---|---|
| A | 748 | 748 | 1 | 1 | 0.13% | 0.13% | 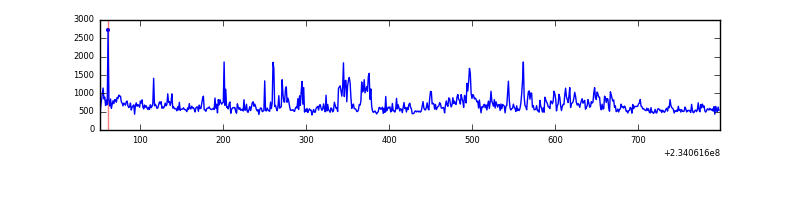 |
| B | 748 | 748 | 0 | 0 | 0.00% | 0.00% | 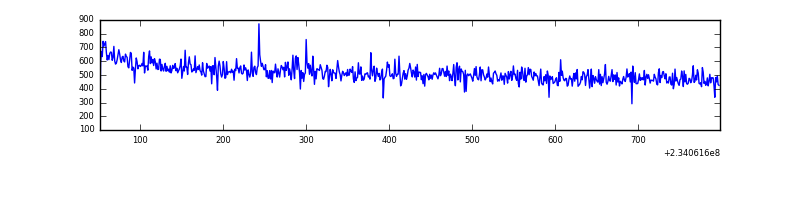 |
| C | 748 | 748 | 0 | 0 | 0.00% | 0.00% |  |
| D | 748 | 748 | 1 | 1 | 0.13% | 0.13% | 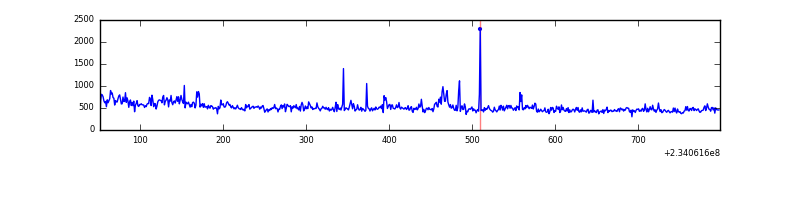 |
Top three noisy pixels from each quadrant. If the there are fewer than three noisy pixels in the level2.evt file, extra rows are filled as -1
| Pixel properties | Quadrant properties | ||||||
|---|---|---|---|---|---|---|---|
| Quadrant | DetID | PixID | Counts | Sigma | Mean | Median | Sigma |
| A | 8 | 5 | 145898 | 6778.37 | 96 | 94 | 21.5 |
| A | 1 | 162 | 1559 | 68.11 | 96 | 94 | 21.5 |
| A | 0 | 226 | 922 | 38.49 | 96 | 94 | 21.5 |
| B | 12 | 111 | 1954 | 89.27 | 98 | 96 | 20.8 |
| B | 11 | 111 | 1559 | 70.29 | 98 | 96 | 20.8 |
| B | 14 | 111 | 1128 | 49.59 | 98 | 96 | 20.8 |
| C | 13 | 61 | 748 | 27.15 | 96 | 96 | 24.0 |
| C | 7 | 159 | 373 | 11.53 | 96 | 96 | 24.0 |
| C | 3 | 202 | 228 | 5.5 | 96 | 96 | 24.0 |
| D | 1 | 52 | 18210 | 727.16 | 93 | 90 | 24.9 |
| D | 6 | 225 | 5216 | 205.71 | 93 | 90 | 24.9 |
| D | 2 | 14 | 5018 | 197.76 | 93 | 90 | 24.9 |
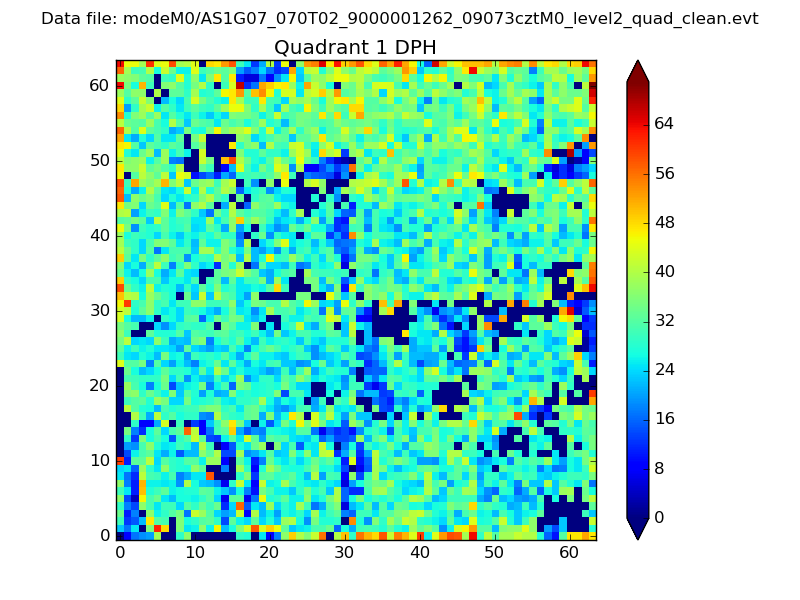
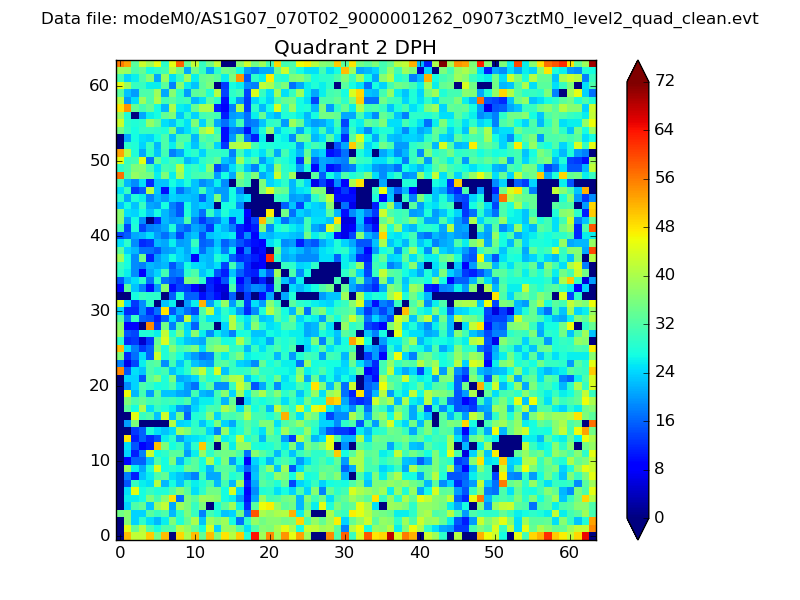
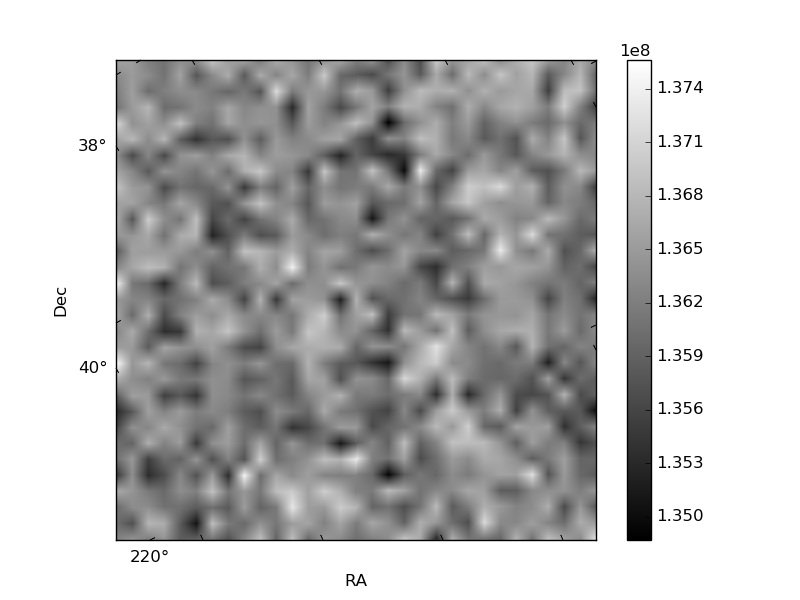
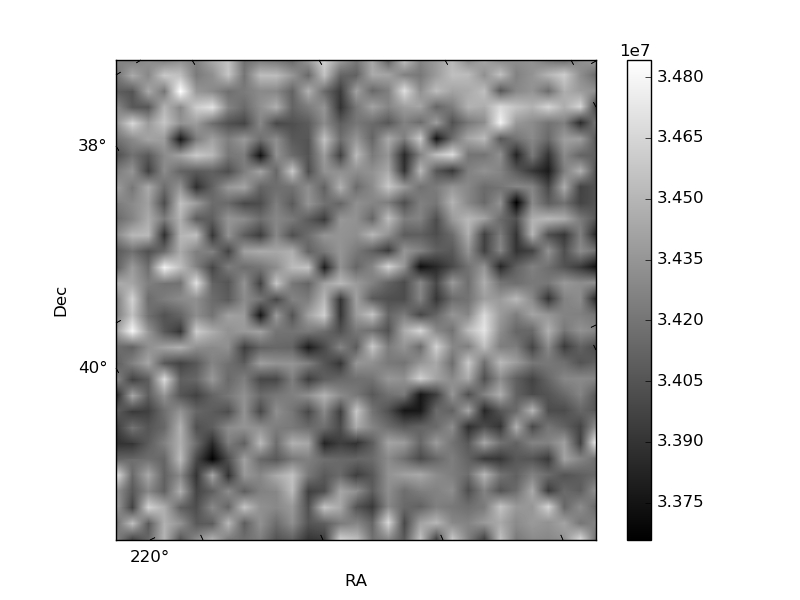
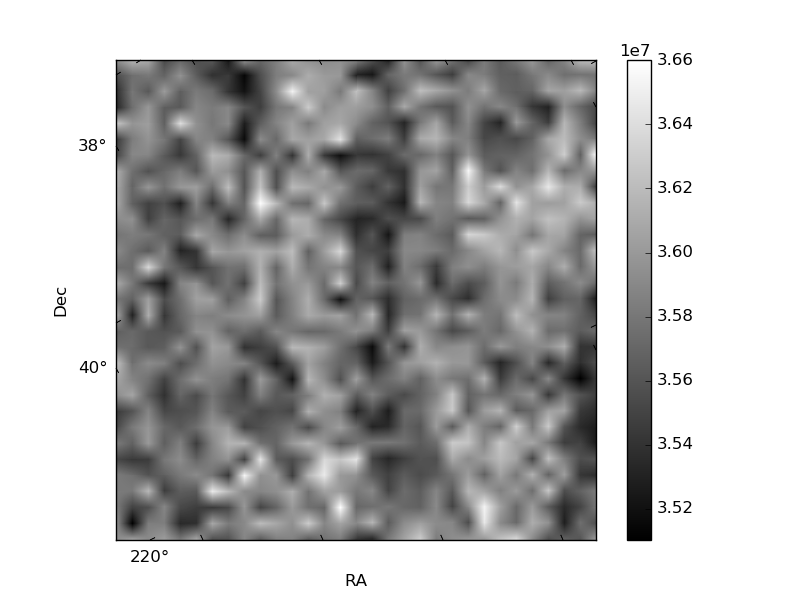
Histogram calculated using DETX and DETY for each event in the final _common_clean file
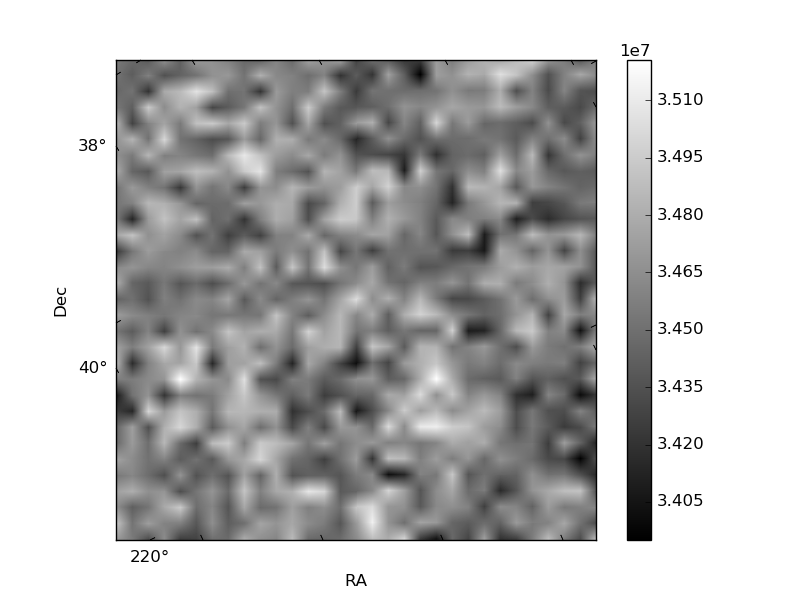
| Quadrant A | 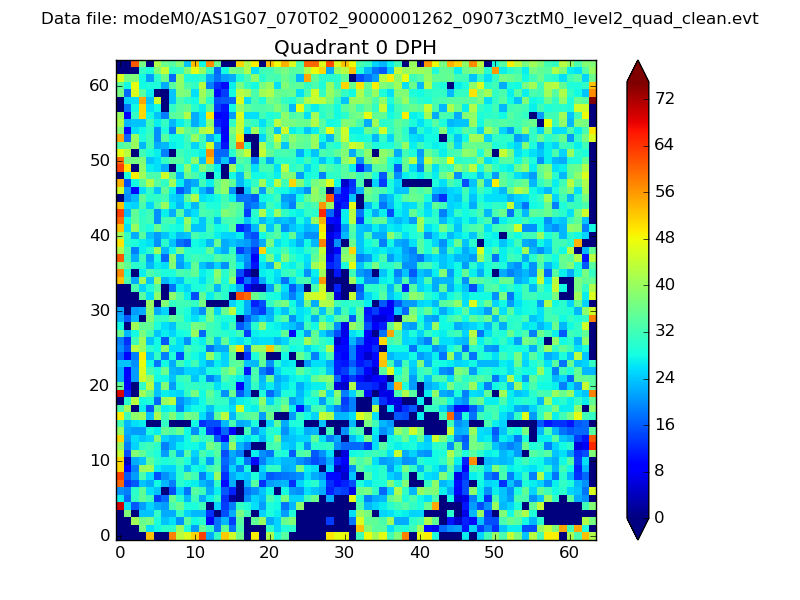 |
 |
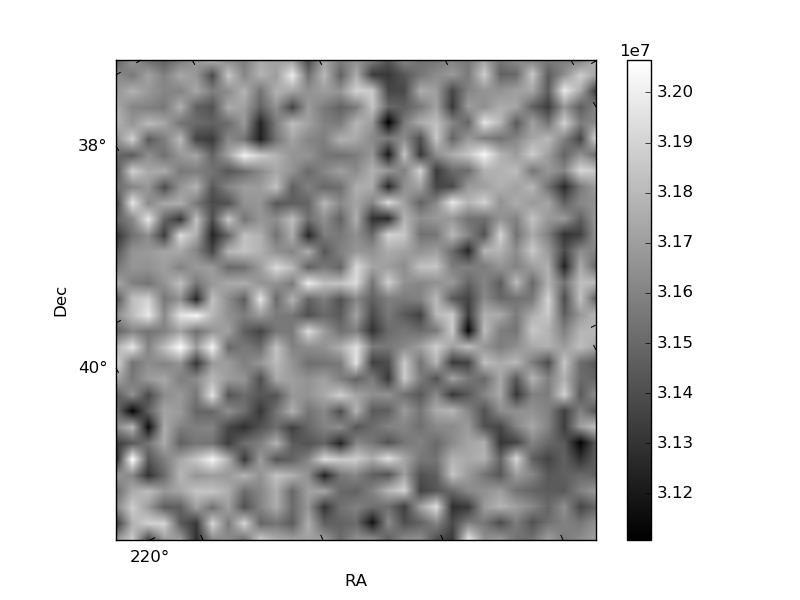
Quadrant B |
|---|---|---|---|
| Quadrant D | 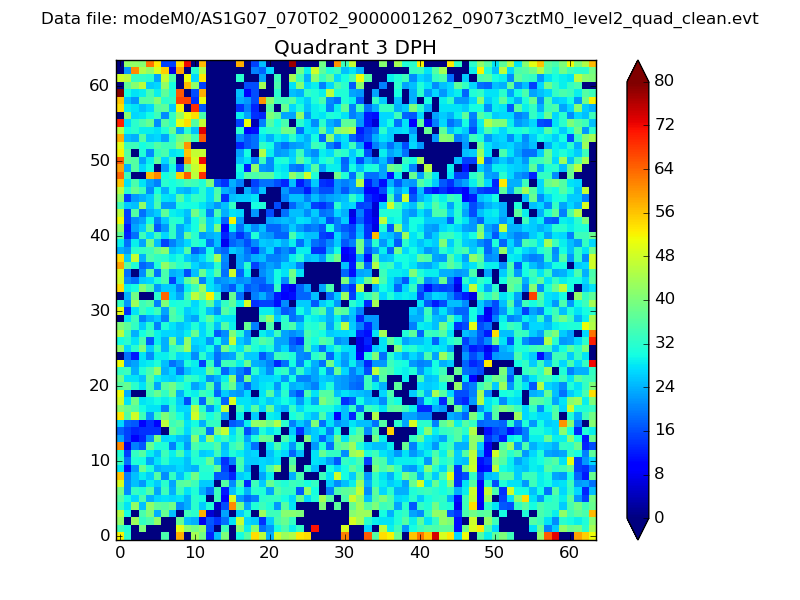 |
 |
Quadrant C |
| Plot type | Count rate plots | Images |
|---|---|---|
| Comparison with Poisson distribution Blue bars denote a histogram of data divided into 1 sec bins. Red curve is a Poisson curve with rate = median count rate of data. |
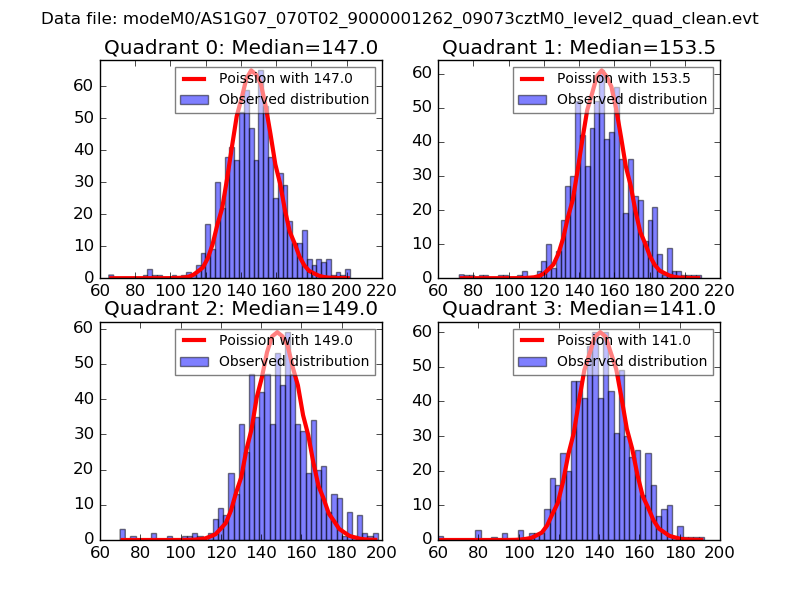 |
 |
| Quadrant-wise count rates Data is divided into 100 sec bins |
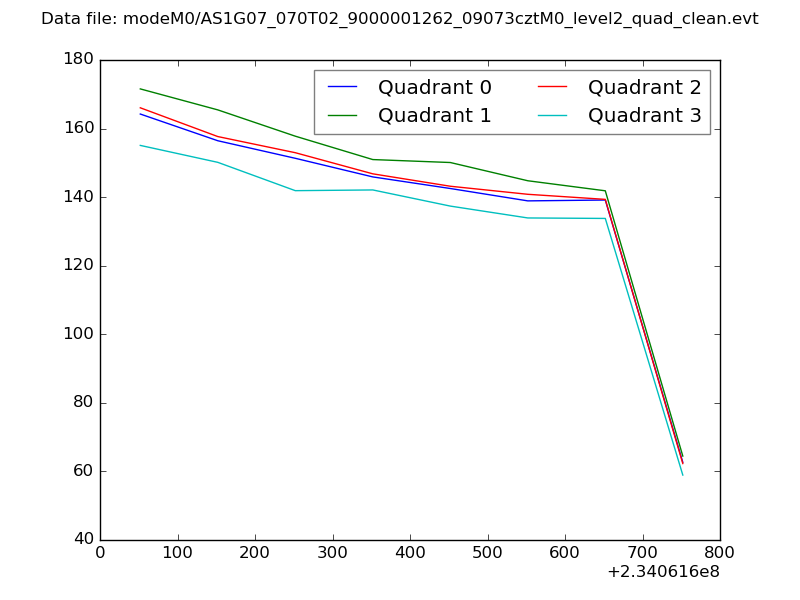 |
|
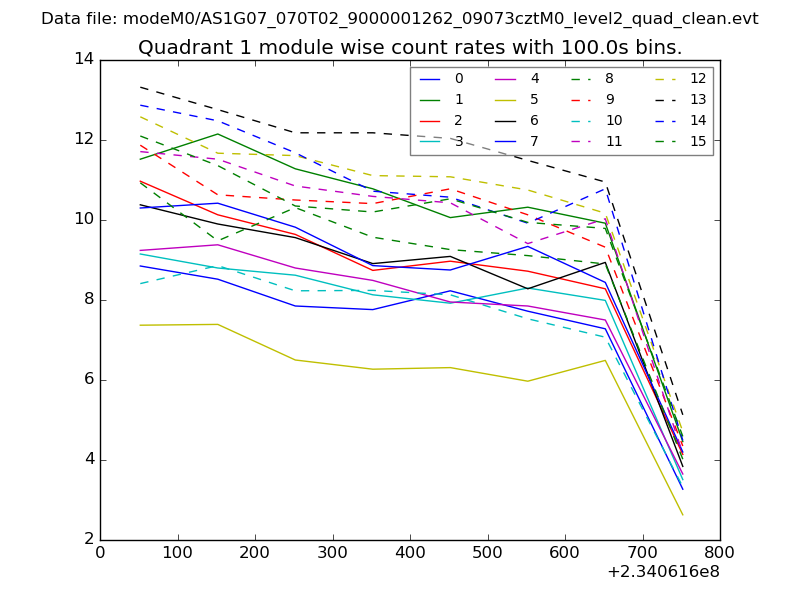
| Module-wise count rates for Quadrant A Data is divided into 100 sec bins |
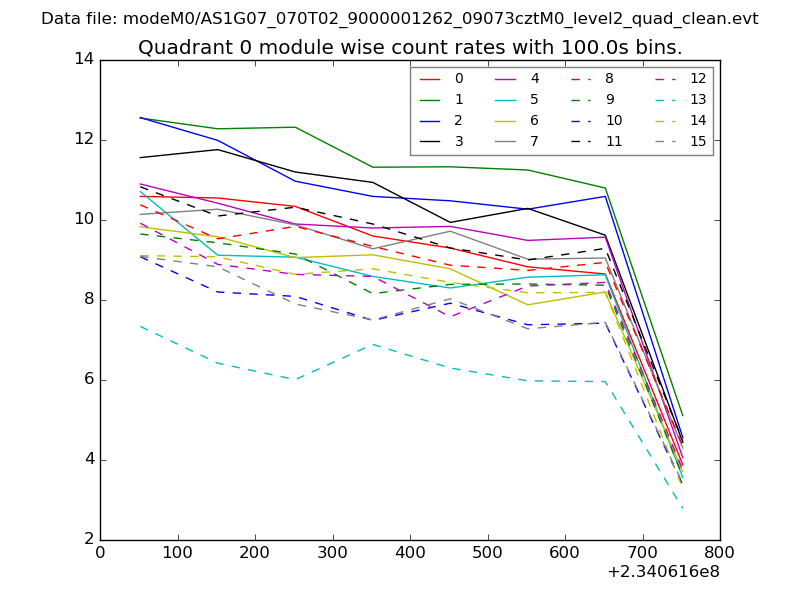 |
 |
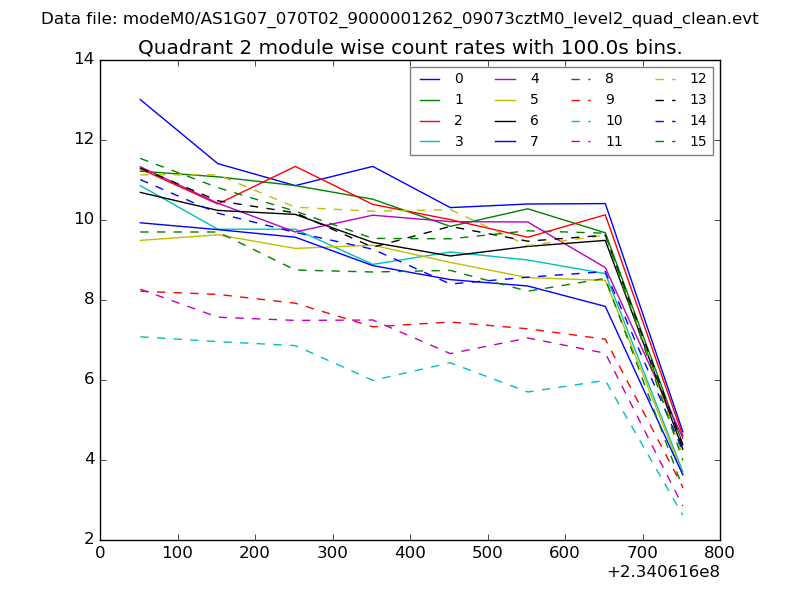
| Module-wise count rates for Quadrant B Data is divided into 100 sec bins |
 |
 |
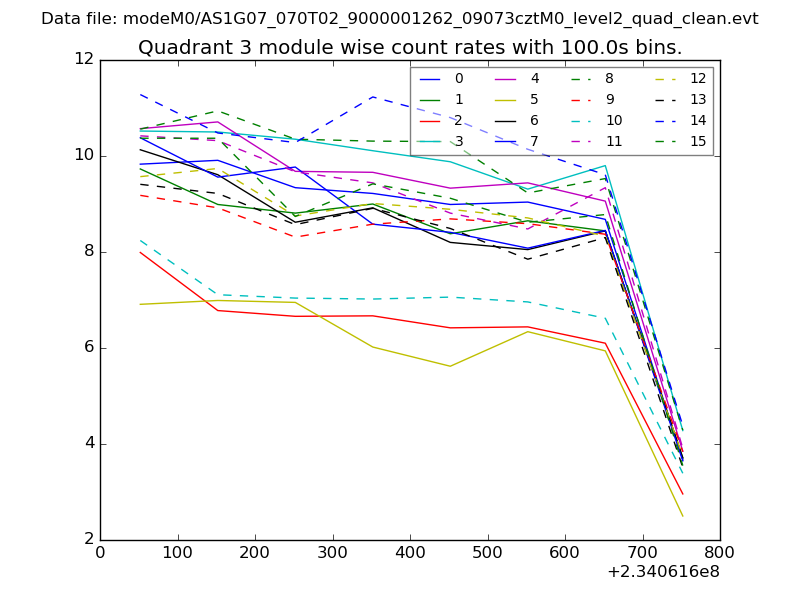
| Module-wise count rates for Quadrant C Data is divided into 100 sec bins |
 |
 |
| Module-wise count rates for Quadrant D Data is divided into 100 sec bins |
 |
 |
| Parameter | Plot |
|---|---|
| CZT HV Monitor | 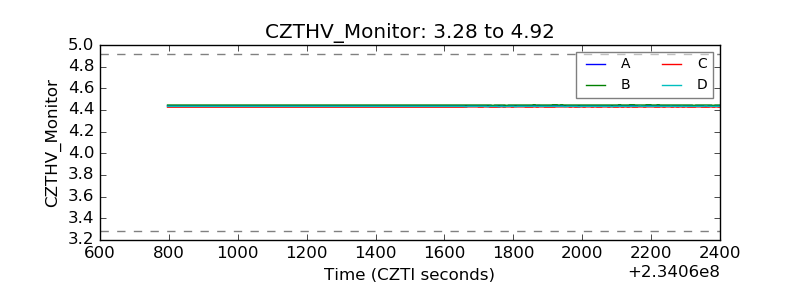 |
| D_VDD | 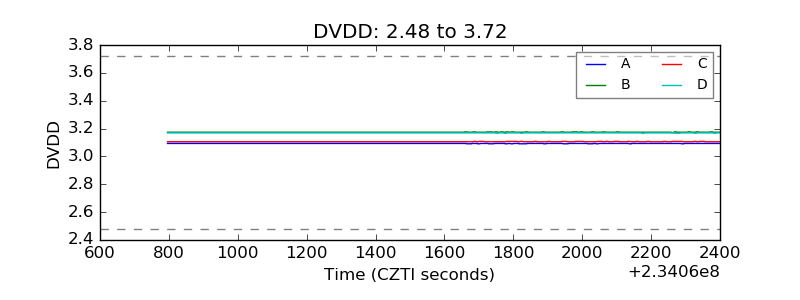 |
| Temperature 1 | 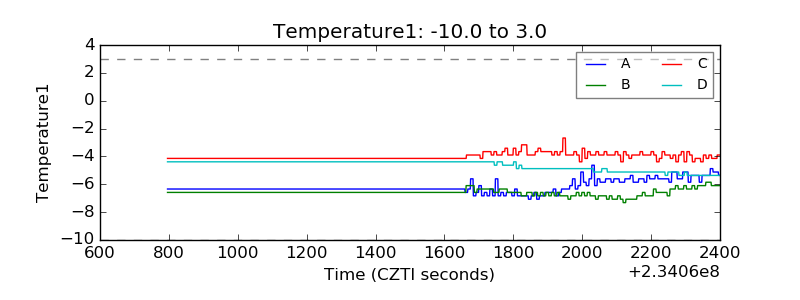 |
| Veto HV Monitor | 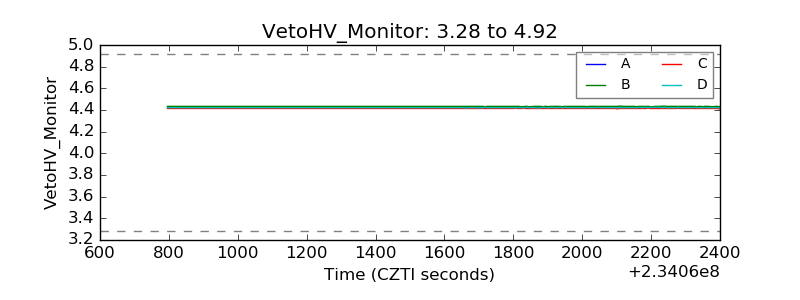 |
| Veto LLD | 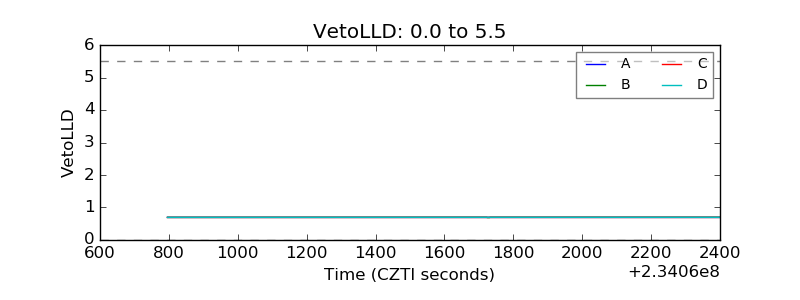 |
| Alpha Counter | 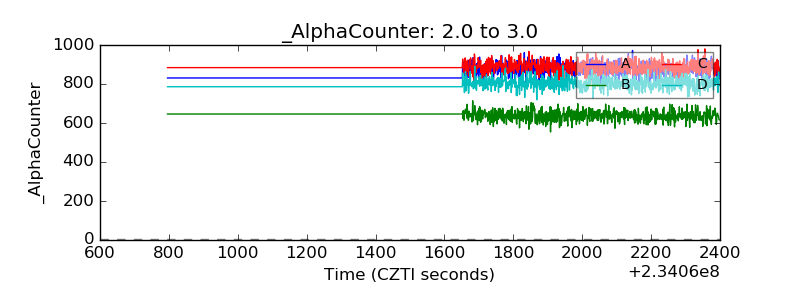 |
| _CPM_Rate | 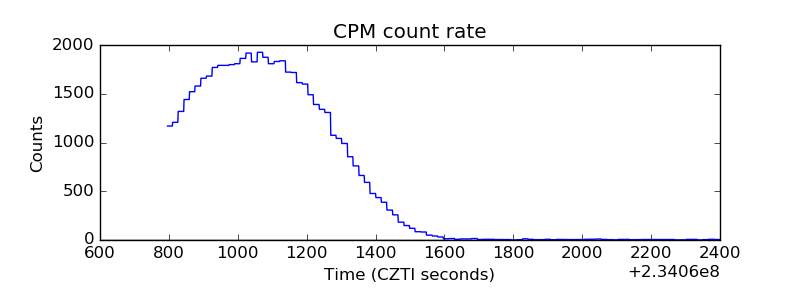 |
| CZT Counter | 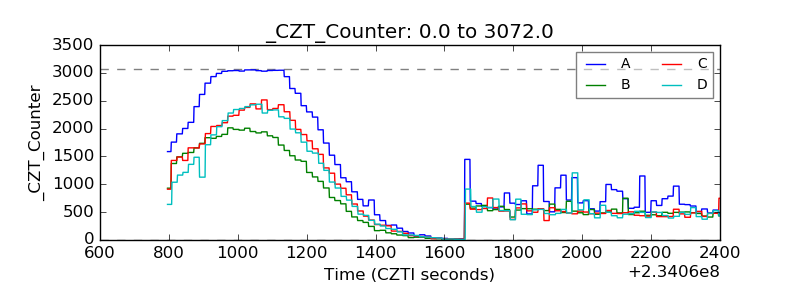 |
| +2.5 Volts monitor |  |
| +5 Volts monitor |  |
| _ROLL_ROT | 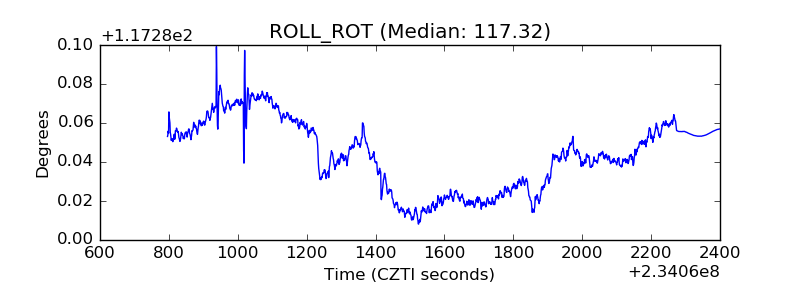 |
| _Roll_DEC | 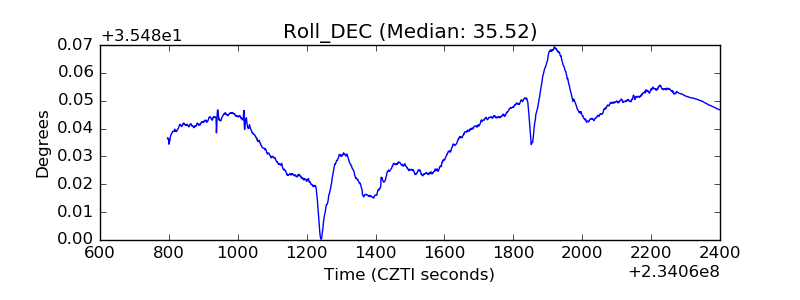 |
| _Roll_RA | 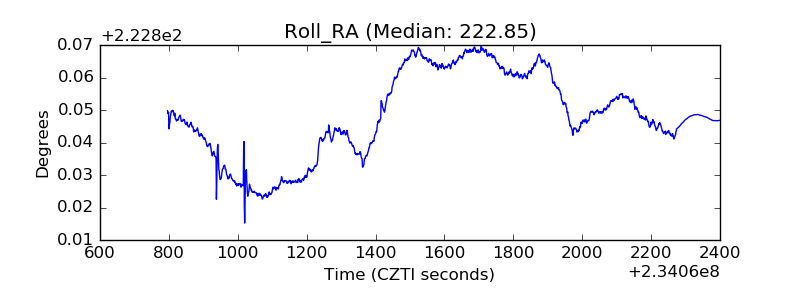 |
| Veto Counter | 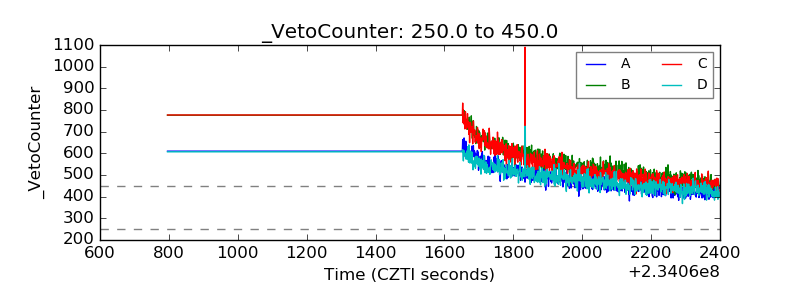 |