| Param | Original file | Final file |
|---|---|---|
| Filename | modeM0/AS1A03_120T01_9000001266cztM0_level2.fits | modeM0/AS1A03_120T01_9000001266cztM0_level2_quad_clean.evt |
| Size (bytes) | 786,067,200 | 702,129,600 |
| Size | 749.7 MB | 669.6 MB |
| Events in quadrant A | 4,788,930 | 4,094,077 |
| Events in quadrant B | 4,660,420 | 4,140,824 |
| Events in quadrant C | 4,702,242 | 3,893,812 |
| Events in quadrant D | 3,998,294 | 3,480,594 |
| Mode M9 | |||
|---|---|---|---|
| Quadrant | BADHDUFLAG | Total packets | Discarded packets |
| A | 0 | 154 | 0 |
| B | 0 | 153 | 0 |
| C | 0 | 154 | 0 |
| D | 0 | 154 | 0 |
| Mode M0 | |||
|---|---|---|---|
| Quadrant | BADHDUFLAG | Total packets | Discarded packets |
| A | 0 | 184950 | 0 |
| B | 0 | 173880 | 0 |
| C | 0 | 169742 | 0 |
| D | 0 | 200725 | 0 |
| Mode SS | |||
|---|---|---|---|
| Quadrant | BADHDUFLAG | Total packets | Discarded packets |
| A | 0 | 1688 | 0 |
| B | 0 | 1688 | 0 |
| C | 0 | 1692 | 0 |
| D | 0 | 1688 | 0 |
| Quadrant | Total seconds | Saturated seconds | Saturation percentage |
|---|---|---|---|
| A | 82379 | 1337 | 1.622986% |
| B | 82476 | 1213 | 1.470731% |
| C | 82504 | 752 | 0.911471% |
| D | 82411 | 3030 | 3.676694% |
Noise dominated data is calculated using 1-second bins in cleaned event files. If a bin has >2000 counts, and if more than 50% of those come from <1% of pixels, then it is considered to be noise-dominated and hence unusable.
| Quadrant | # 1 sec bins | Bins with >0 counts | Bins with >2000 counts | High rate bins dominated by noise | Noise dominated (total time) | Noise dominated (detector-on time) | Marked lightcurve |
|---|---|---|---|---|---|---|---|
| A | 144500 | 83220 | 0 | 0 | 0.00% | 0.00% |  |
| B | 144500 | 83249 | 0 | 0 | 0.00% | 0.00% |  |
| C | 144500 | 83244 | 0 | 0 | 0.00% | 0.00% | 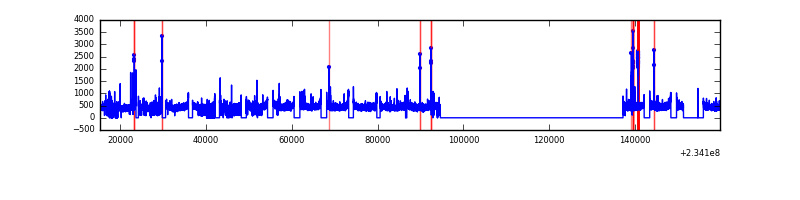 |
| D | 144500 | 83214 | 0 | 0 | 0.00% | 0.00% | 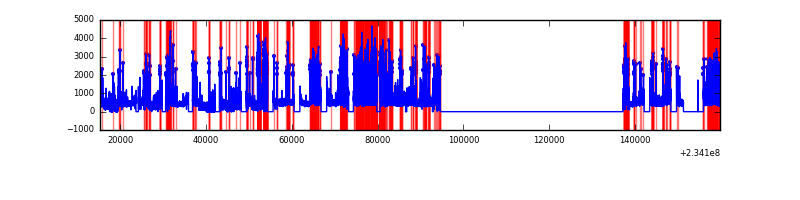 |
Top three noisy pixels from each quadrant. If the there are fewer than three noisy pixels in the level2.evt file, extra rows are filled as -1
| Pixel properties | Quadrant properties | ||||||
|---|---|---|---|---|---|---|---|
| Quadrant | DetID | PixID | Counts | Sigma | Mean | Median | Sigma |
| A | 0 | 29 | 4508 | 10.8 | 1246 | 1166 | 309.4 |
| A | 7 | 110 | 4010 | 9.19 | 1246 | 1166 | 309.4 |
| A | 9 | 19 | 3525 | 7.62 | 1246 | 1166 | 309.4 |
| B | 2 | 9 | 4018 | 11.58 | 1232 | 1172 | 245.7 |
| B | 12 | 226 | 3146 | 8.04 | 1232 | 1172 | 245.7 |
| B | 3 | 17 | 3115 | 7.91 | 1232 | 1172 | 245.7 |
| C | 1 | 80 | 3421 | 6.98 | 1242 | 1152 | 325.1 |
| C | 1 | 81 | 3414 | 6.96 | 1242 | 1152 | 325.1 |
| C | 12 | 241 | 3282 | 6.55 | 1242 | 1152 | 325.1 |
| D | 7 | 5 | 2942 | 6.29 | 1142 | 1040 | 302.4 |
| D | 6 | 231 | 2938 | 6.28 | 1142 | 1040 | 302.4 |
| D | 7 | 3 | 2831 | 5.92 | 1142 | 1040 | 302.4 |
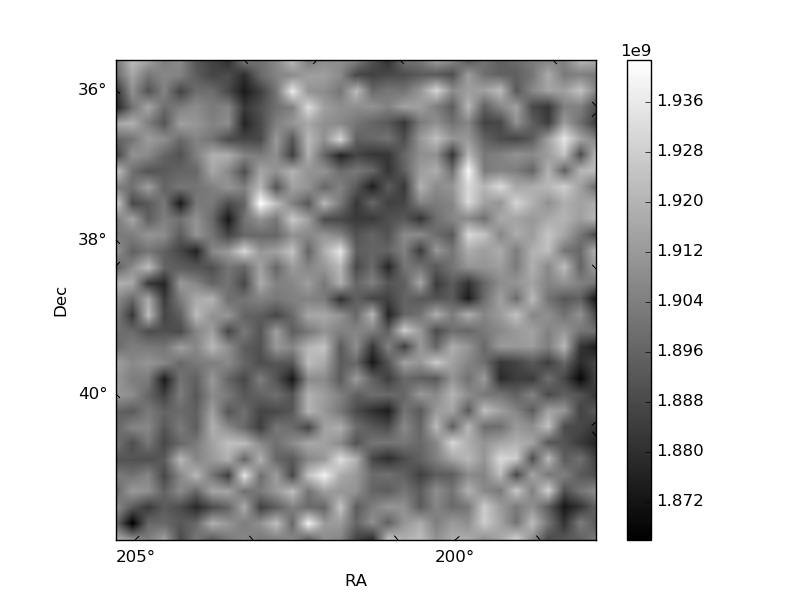
Histogram calculated using DETX and DETY for each event in the final _common_clean file
| Quadrant A |  |
 |
Quadrant B |
|---|---|---|---|
| Quadrant D |  |
 |
Quadrant C |
| Plot type | Count rate plots | Images |
|---|---|---|
| Comparison with Poisson distribution Blue bars denote a histogram of data divided into 1 sec bins. Red curve is a Poisson curve with rate = median count rate of data. |
 |
 |
| Quadrant-wise count rates Data is divided into 100 sec bins |
 |
|
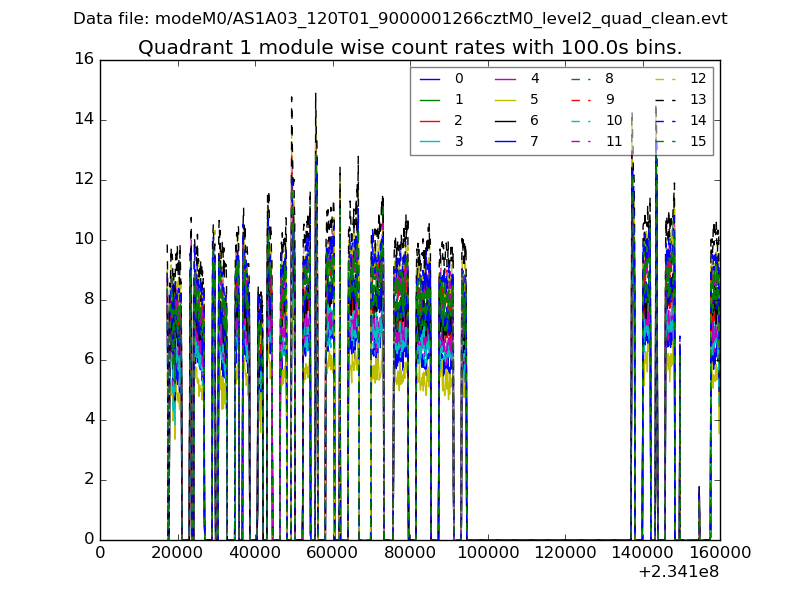
| Module-wise count rates for Quadrant A Data is divided into 100 sec bins |
 |
 |
| Module-wise count rates for Quadrant B Data is divided into 100 sec bins |
 |
 |
| Module-wise count rates for Quadrant C Data is divided into 100 sec bins |
 |
 |
| Module-wise count rates for Quadrant D Data is divided into 100 sec bins |
 |
 |
| Parameter | Plot |
|---|---|
| CZT HV Monitor |  |
| D_VDD |  |
| Temperature 1 |  |
| Veto HV Monitor |  |
| Veto LLD |  |
| Alpha Counter |  |
| _CPM_Rate |  |
| CZT Counter |  |
| +2.5 Volts monitor | 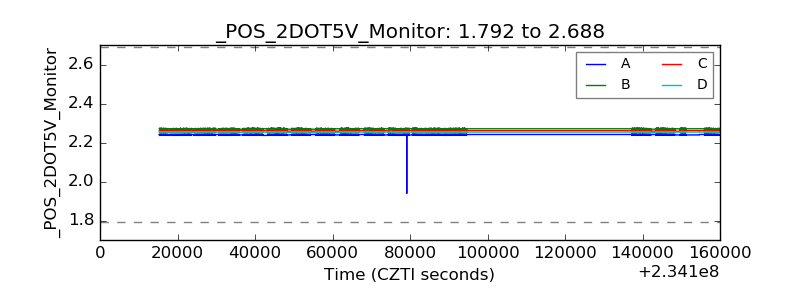 |
| +5 Volts monitor |  |
| _ROLL_ROT |  |
| _Roll_DEC |  |
| _Roll_RA | 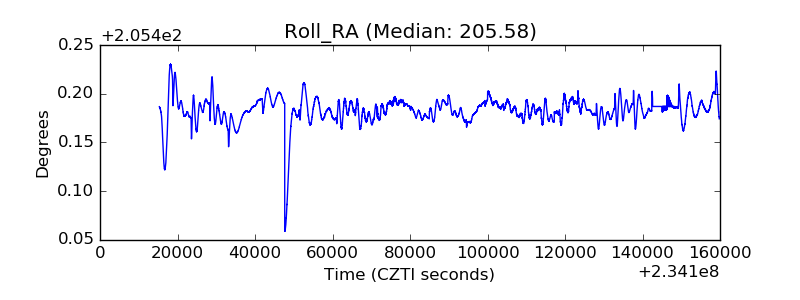 |
| Veto Counter | 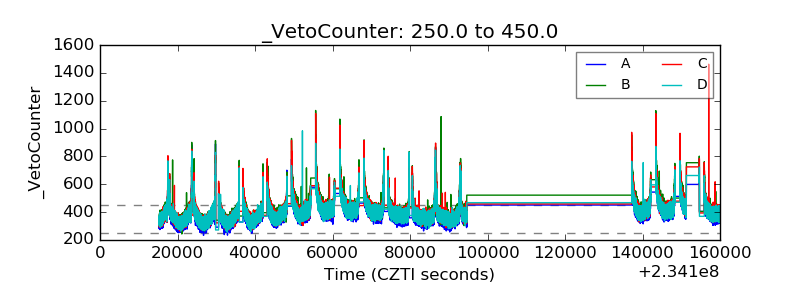 |