| Param | Original file | Final file |
|---|---|---|
| Filename | modeM0/AS1A03_120T01_9000001266_09081cztM0_level2.evt | modeM0/AS1A03_120T01_9000001266_09081cztM0_level2_quad_clean.evt |
| Size (bytes) | 246,415,680 | 31,458,240 |
| Size | 235.0 MB | 30.0 MB |
| Events in quadrant A | 2,127,152 | 175,419 |
| Events in quadrant B | 1,764,378 | 181,553 |
| Events in quadrant C | 1,630,471 | 178,251 |
| Events in quadrant D | 1,702,862 | 170,426 |
| Mode M9 | |||
|---|---|---|---|
| Quadrant | BADHDUFLAG | Total packets | Discarded packets |
| A | 0 | 4 | 0 |
| B | 0 | 4 | 1 |
| C | 0 | 4 | 0 |
| D | 0 | 4 | 2 |
| Mode M0 | |||
|---|---|---|---|
| Quadrant | BADHDUFLAG | Total packets | Discarded packets |
| A | 0 | 9186 | 597 |
| B | 0 | 7939 | 500 |
| C | 0 | 7607 | 452 |
| D | 0 | 7905 | 505 |
| Mode SS | |||
|---|---|---|---|
| Quadrant | BADHDUFLAG | Total packets | Discarded packets |
| A | 0 | 76 | 2 |
| B | 0 | 76 | 4 |
| C | 0 | 76 | 6 |
| D | 0 | 76 | 2 |
| Quadrant | Total seconds | Saturated seconds | Saturation percentage |
|---|---|---|---|
| A | 3458 | 61 | 1.764025% |
| B | 3472 | 42 | 1.209677% |
| C | 3473 | 34 | 0.978981% |
| D | 3459 | 25 | 0.722752% |
Noise dominated data is calculated using 1-second bins in cleaned event files. If a bin has >2000 counts, and if more than 50% of those come from <1% of pixels, then it is considered to be noise-dominated and hence unusable.
| Quadrant | # 1 sec bins | Bins with >0 counts | Bins with >2000 counts | High rate bins dominated by noise | Noise dominated (total time) | Noise dominated (detector-on time) | Marked lightcurve |
|---|---|---|---|---|---|---|---|
| A | 4111 | 3622 | 8 | 8 | 0.19% | 0.22% | 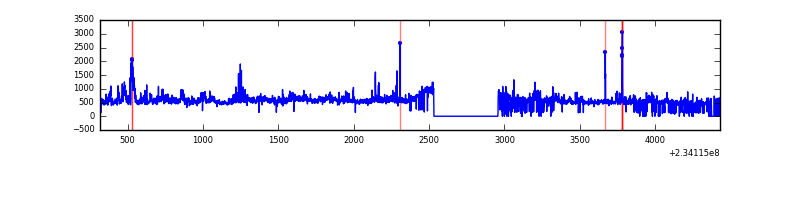 |
| B | 4112 | 3640 | 3 | 3 | 0.07% | 0.08% | 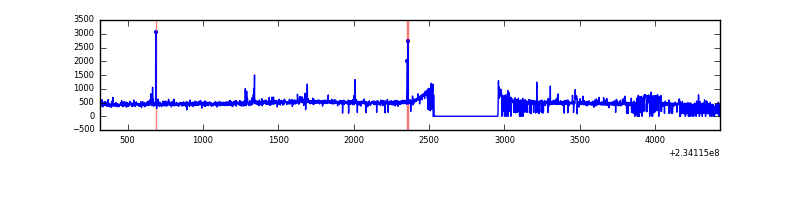 |
| C | 4112 | 3631 | 0 | 0 | 0.00% | 0.00% | 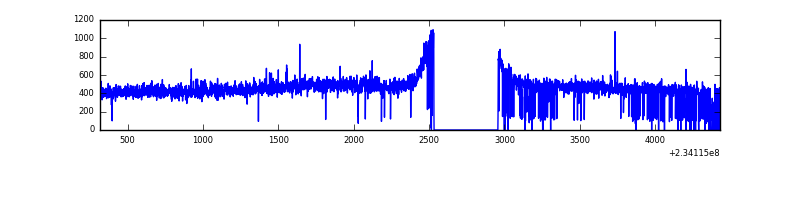 |
| D | 4112 | 3626 | 2 | 2 | 0.05% | 0.06% | 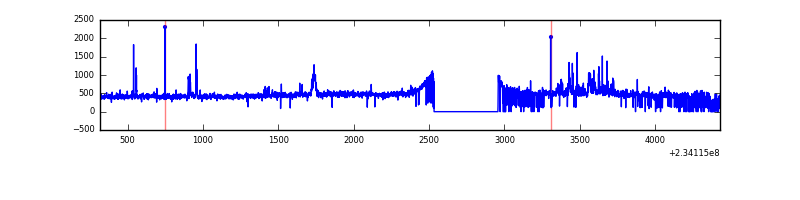 |
Top three noisy pixels from each quadrant. If the there are fewer than three noisy pixels in the level2.evt file, extra rows are filled as -1
| Pixel properties | Quadrant properties | ||||||
|---|---|---|---|---|---|---|---|
| Quadrant | DetID | PixID | Counts | Sigma | Mean | Median | Sigma |
| A | 8 | 5 | 408518 | 4646.67 | 424 | 415 | 87.8 |
| A | 1 | 162 | 32860 | 369.42 | 424 | 415 | 87.8 |
| A | 5 | 16 | 12639 | 139.18 | 424 | 415 | 87.8 |
| B | 5 | 174 | 39224 | 457.27 | 429 | 417 | 84.9 |
| B | 0 | 229 | 23371 | 270.47 | 429 | 417 | 84.9 |
| B | 4 | 80 | 16283 | 186.95 | 429 | 417 | 84.9 |
| C | 13 | 61 | 3184 | 28.32 | 416 | 417 | 97.7 |
| C | 14 | 234 | 2462 | 20.93 | 416 | 417 | 97.7 |
| C | 8 | 128 | 2423 | 20.53 | 416 | 417 | 97.7 |
| D | 6 | 225 | 38144 | 359.09 | 416 | 402 | 105.1 |
| D | 1 | 52 | 28991 | 272.0 | 416 | 402 | 105.1 |
| D | 7 | 71 | 20633 | 192.48 | 416 | 402 | 105.1 |
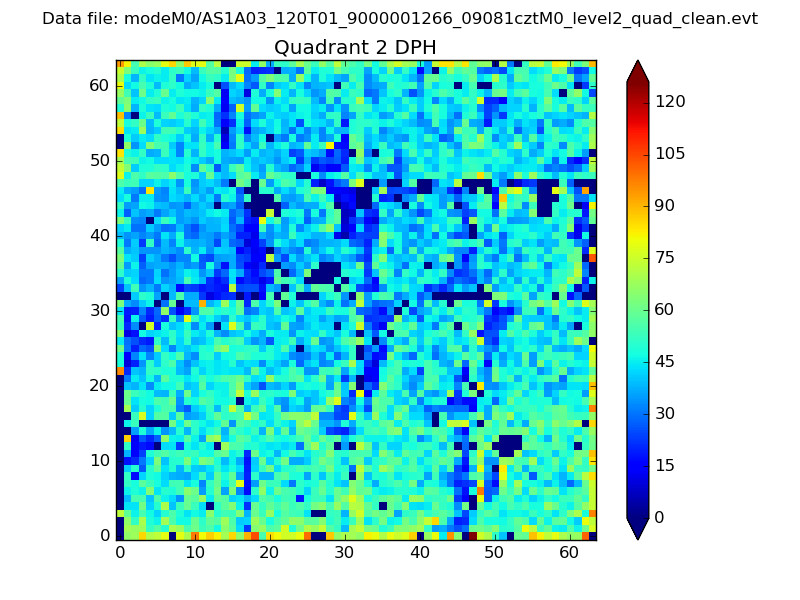
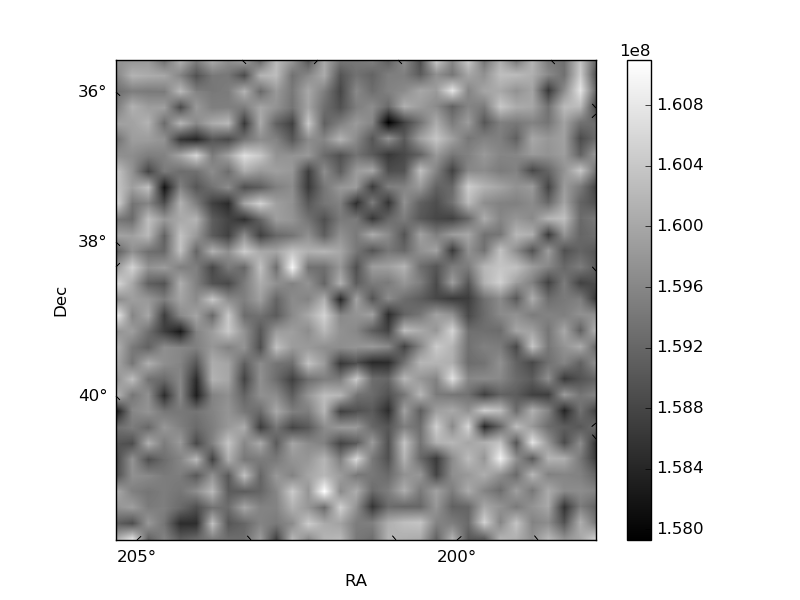
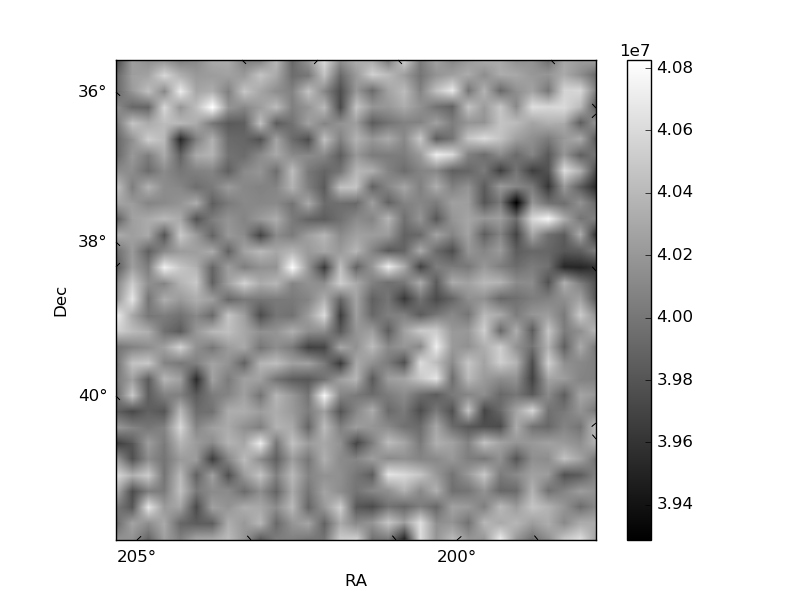
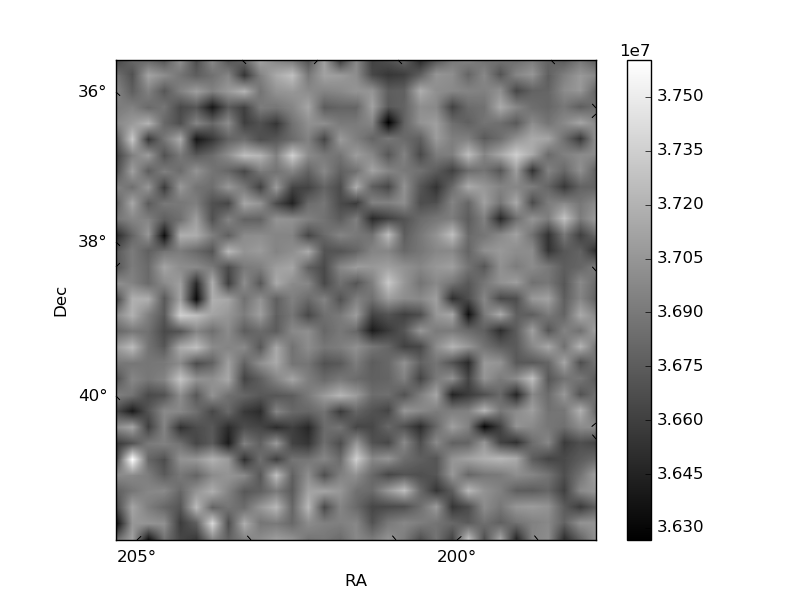
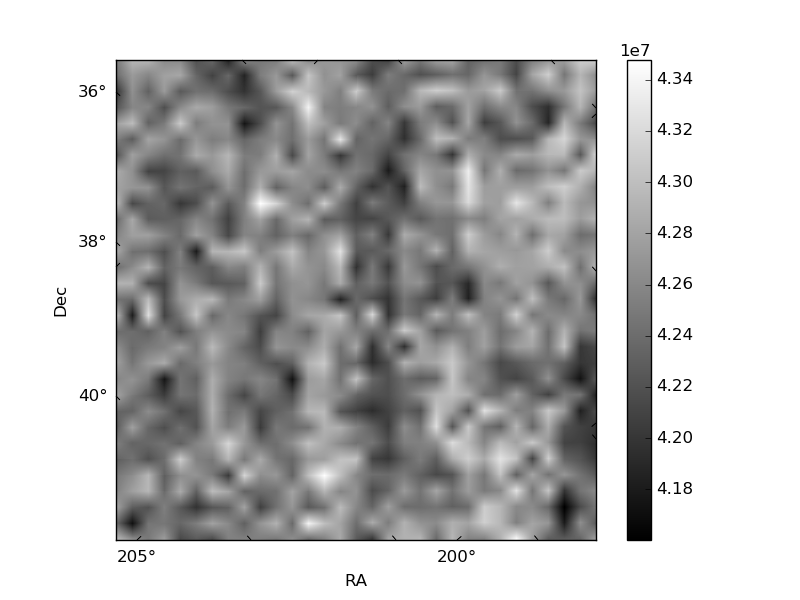
Histogram calculated using DETX and DETY for each event in the final _common_clean file
| Quadrant A | 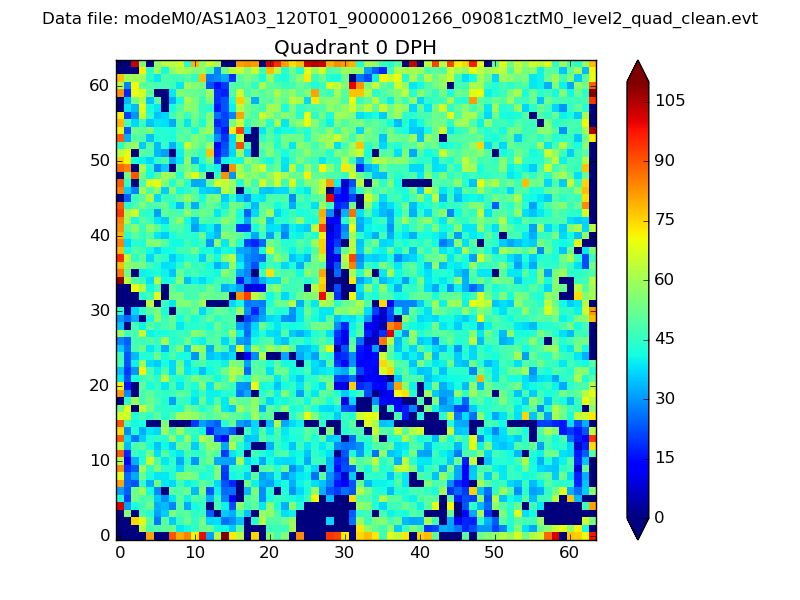 |
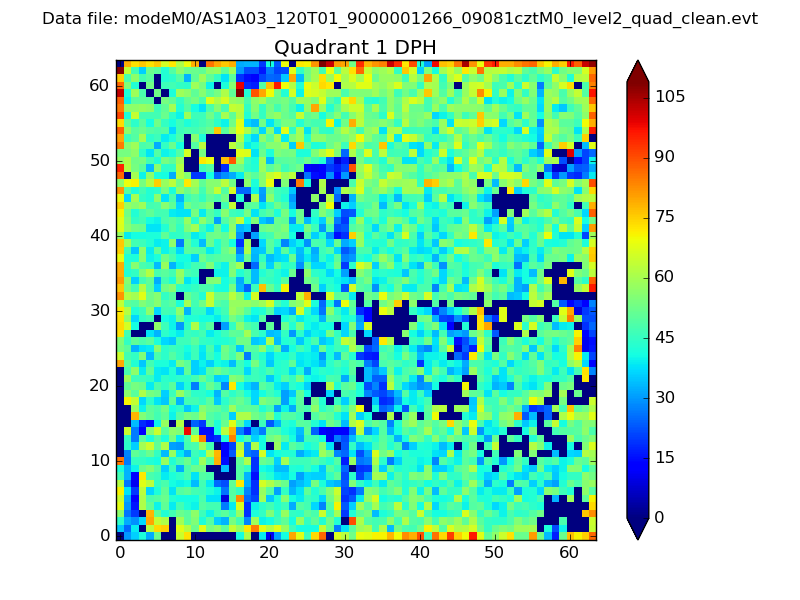 |
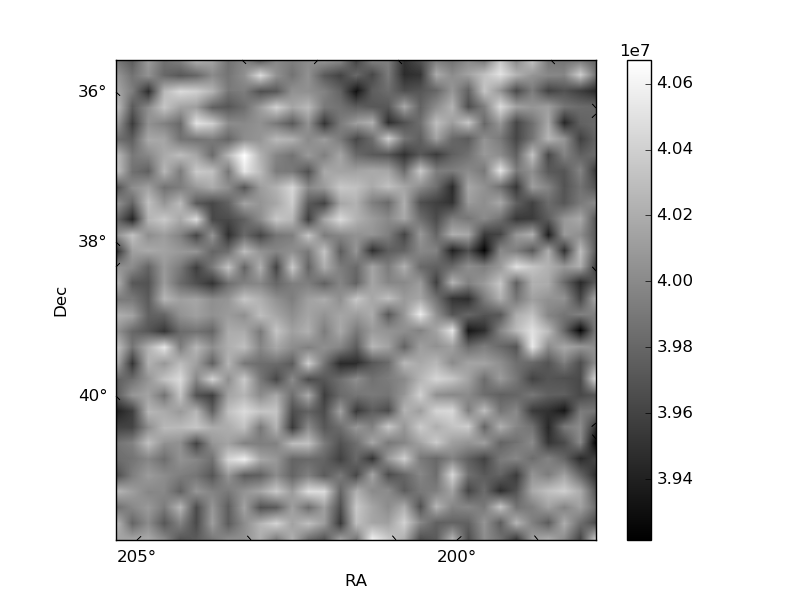
Quadrant B |
|---|---|---|---|
| Quadrant D | 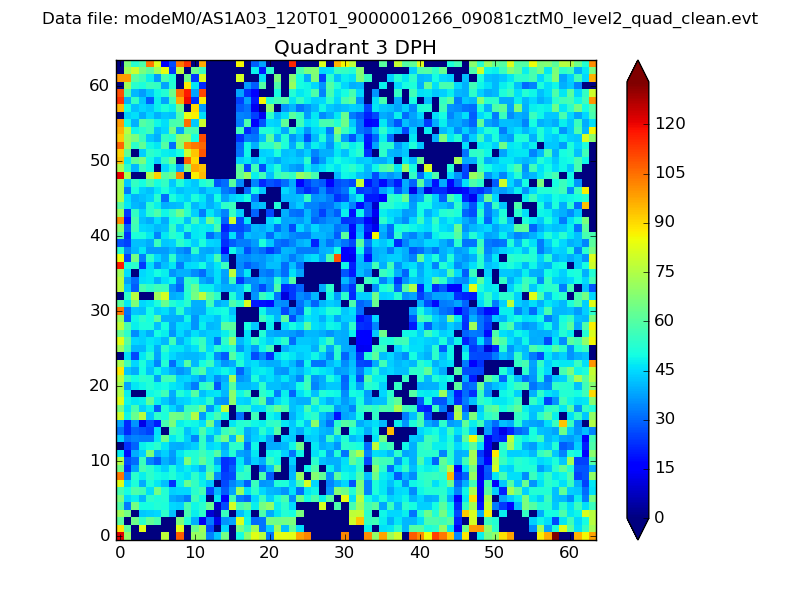 |
 |
Quadrant C |
| Plot type | Count rate plots | Images |
|---|---|---|
| Comparison with Poisson distribution Blue bars denote a histogram of data divided into 1 sec bins. Red curve is a Poisson curve with rate = median count rate of data. |
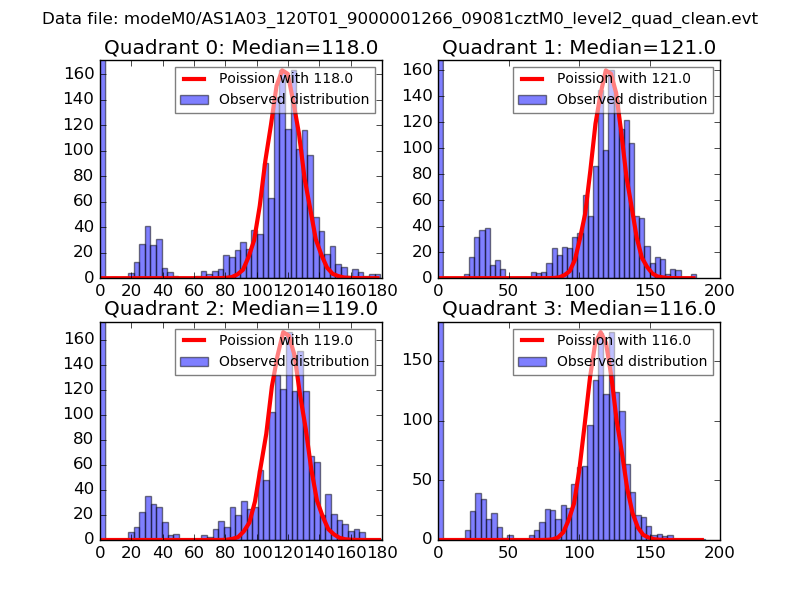 |
 |
| Quadrant-wise count rates Data is divided into 100 sec bins |
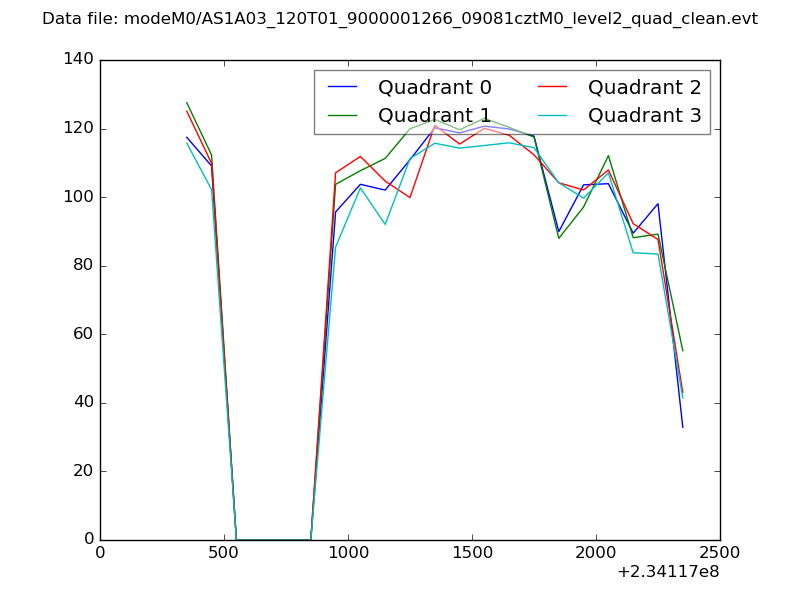 |
|
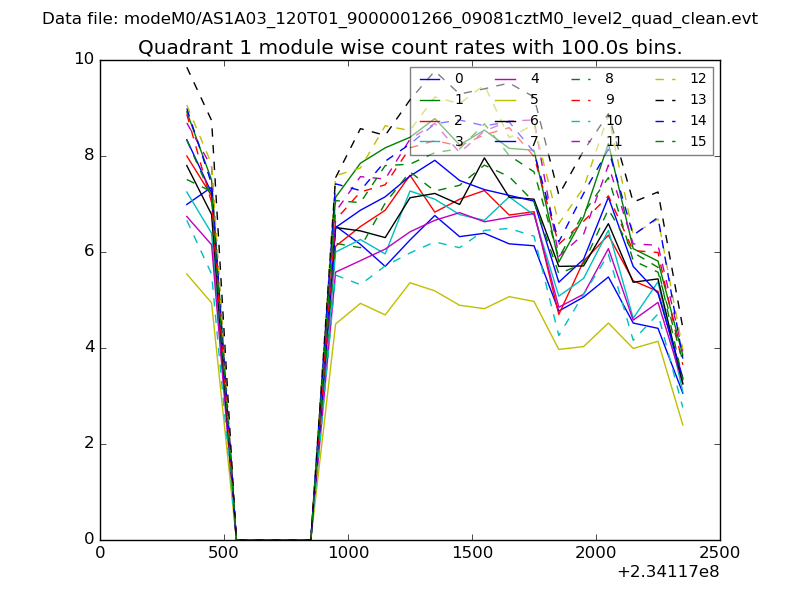
| Module-wise count rates for Quadrant A Data is divided into 100 sec bins |
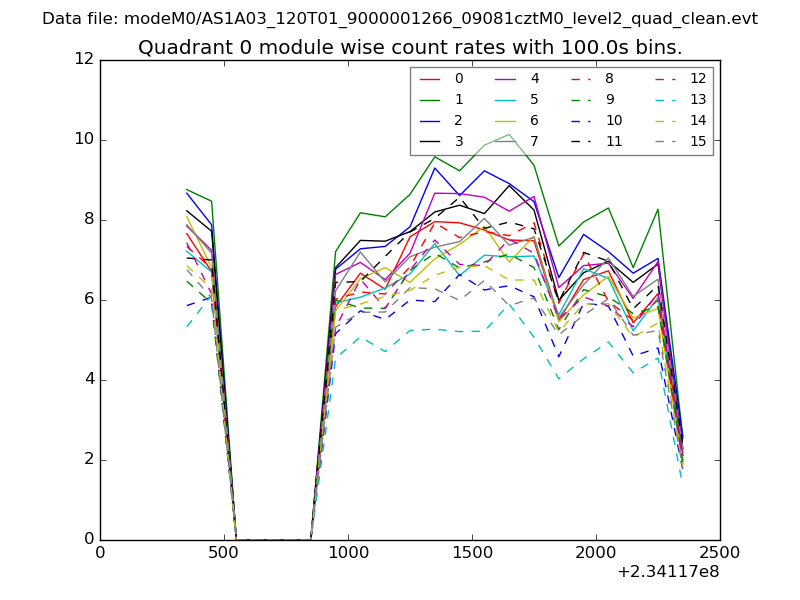 |
 |
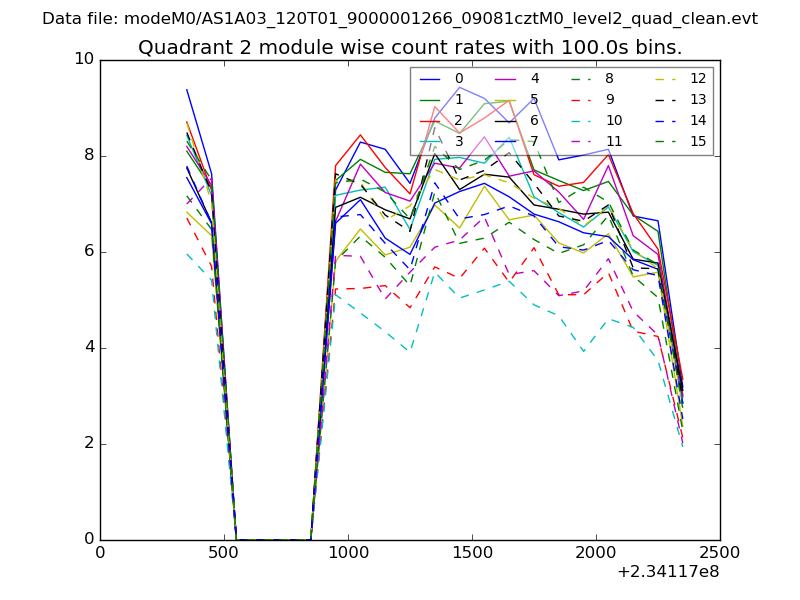
| Module-wise count rates for Quadrant B Data is divided into 100 sec bins |
 |
 |
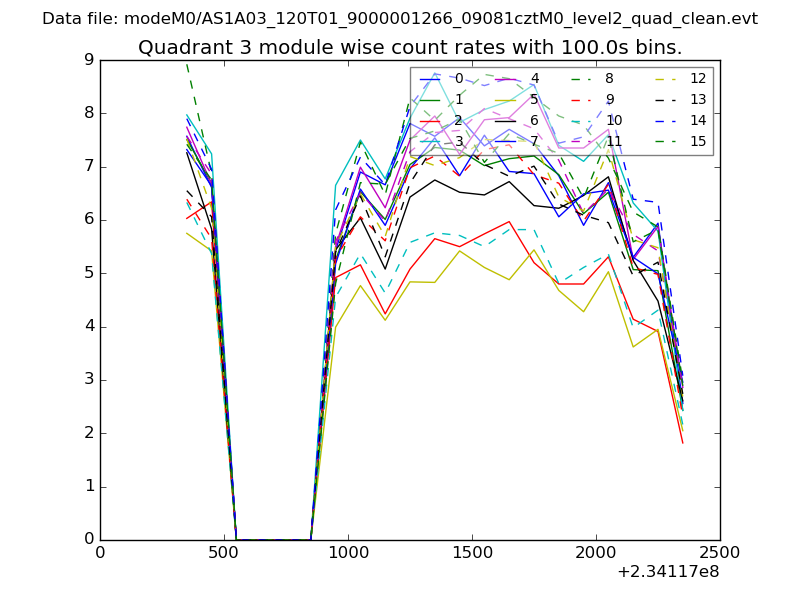
| Module-wise count rates for Quadrant C Data is divided into 100 sec bins |
 |
 |
| Module-wise count rates for Quadrant D Data is divided into 100 sec bins |
 |
 |
| Parameter | Plot |
|---|---|
| CZT HV Monitor | 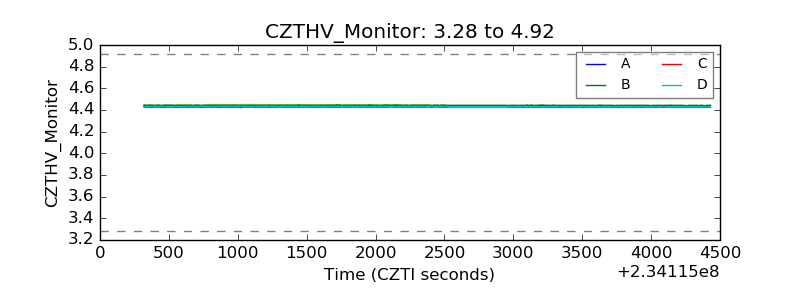 |
| D_VDD | 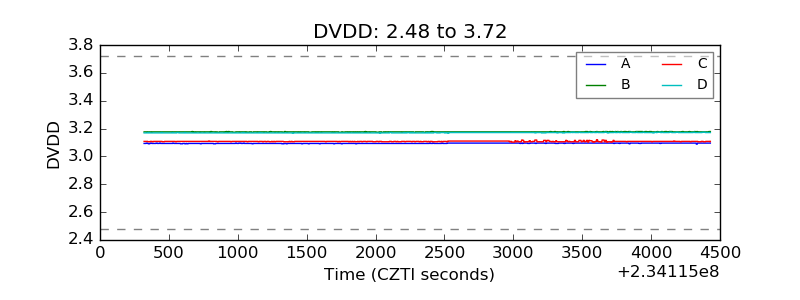 |
| Temperature 1 | 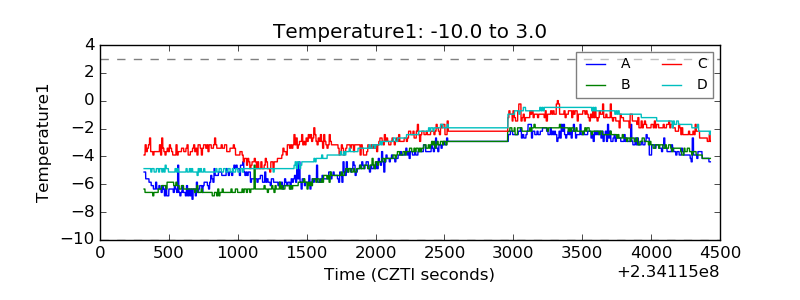 |
| Veto HV Monitor | 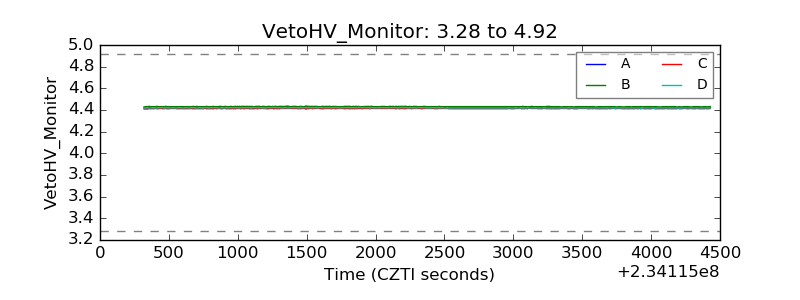 |
| Veto LLD |  |
| Alpha Counter | 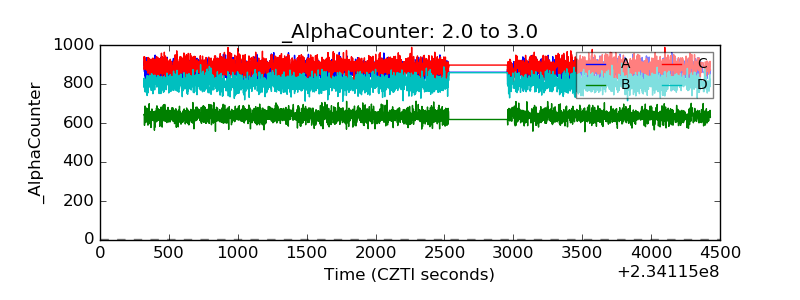 |
| _CPM_Rate | 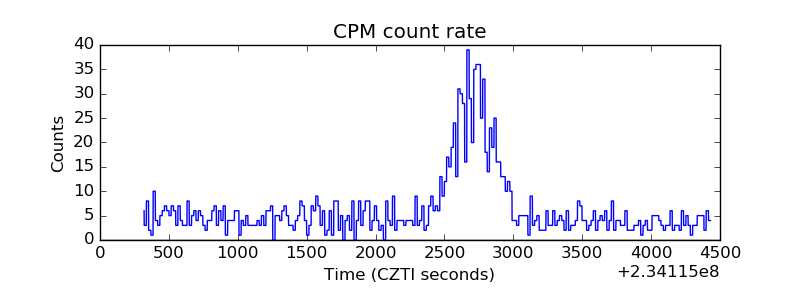 |
| CZT Counter | 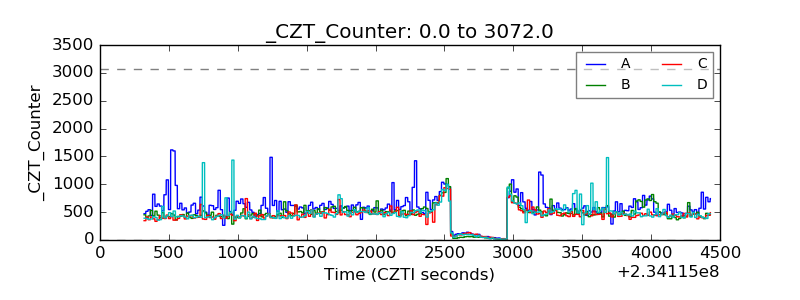 |
| +2.5 Volts monitor |  |
| +5 Volts monitor |  |
| _ROLL_ROT | 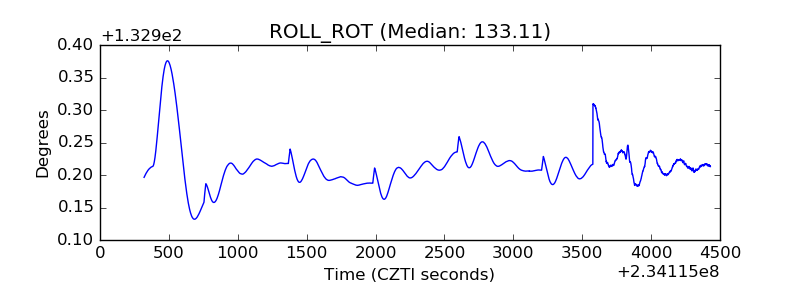 |
| _Roll_DEC | 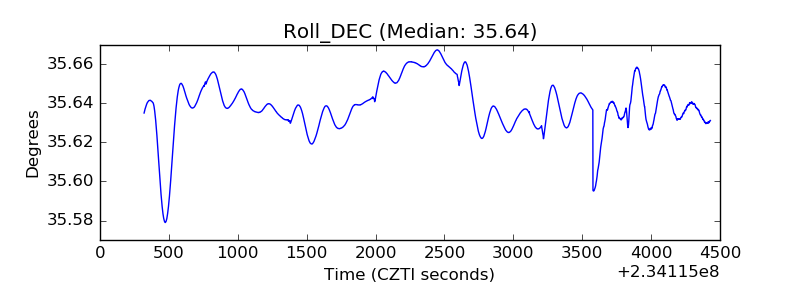 |
| _Roll_RA | 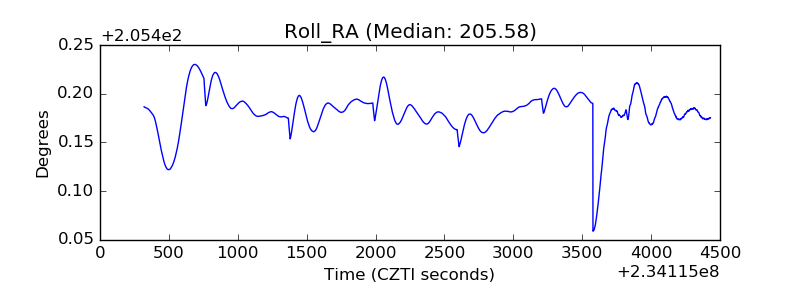 |
| Veto Counter | 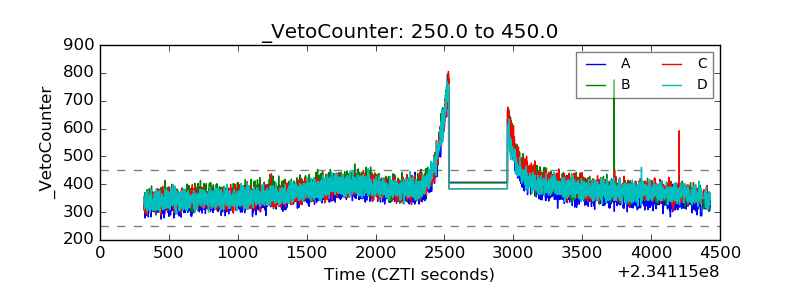 |