| Param | Original file | Final file |
|---|---|---|
| Filename | modeM0/AS1A03_120T01_9000001266_09083cztM0_level2.evt | modeM0/AS1A03_120T01_9000001266_09083cztM0_level2_quad_clean.evt |
| Size (bytes) | 874,405,440 | 163,425,600 |
| Size | 833.9 MB | 155.9 MB |
| Events in quadrant A | 7,344,980 | 1,020,885 |
| Events in quadrant B | 6,372,031 | 1,035,299 |
| Events in quadrant C | 5,653,224 | 1,024,703 |
| Events in quadrant D | 6,249,685 | 989,245 |
| Mode M9 | |||
|---|---|---|---|
| Quadrant | BADHDUFLAG | Total packets | Discarded packets |
| A | 0 | 17 | 0 |
| B | 0 | 17 | 0 |
| C | 0 | 17 | 0 |
| D | 0 | 17 | 0 |
| Mode M0 | |||
|---|---|---|---|
| Quadrant | BADHDUFLAG | Total packets | Discarded packets |
| A | 0 | 30404 | 213 |
| B | 0 | 27745 | 142 |
| C | 0 | 26148 | 143 |
| D | 0 | 27651 | 162 |
| Mode SS | |||
|---|---|---|---|
| Quadrant | BADHDUFLAG | Total packets | Discarded packets |
| A | 0 | 260 | 0 |
| B | 0 | 260 | 0 |
| C | 0 | 260 | 0 |
| D | 0 | 260 | 0 |
| Quadrant | Total seconds | Saturated seconds | Saturation percentage |
|---|---|---|---|
| A | 12704 | 188 | 1.479849% |
| B | 12725 | 148 | 1.163065% |
| C | 12719 | 55 | 0.432424% |
| D | 12718 | 146 | 1.147979% |
Noise dominated data is calculated using 1-second bins in cleaned event files. If a bin has >2000 counts, and if more than 50% of those come from <1% of pixels, then it is considered to be noise-dominated and hence unusable.
| Quadrant | # 1 sec bins | Bins with >0 counts | Bins with >2000 counts | High rate bins dominated by noise | Noise dominated (total time) | Noise dominated (detector-on time) | Marked lightcurve |
|---|---|---|---|---|---|---|---|
| A | 14168 | 12787 | 46 | 46 | 0.32% | 0.36% | 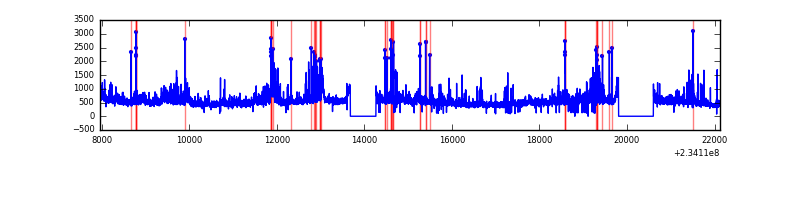 |
| B | 14168 | 12789 | 42 | 42 | 0.30% | 0.33% | 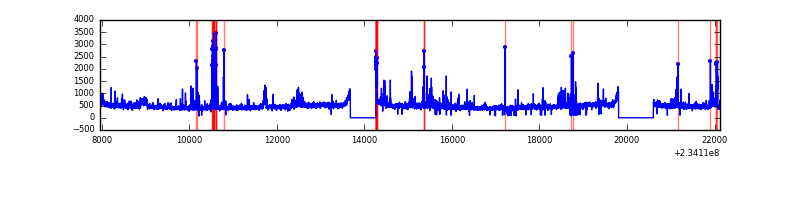 |
| C | 14168 | 12786 | 5 | 5 | 0.04% | 0.04% | 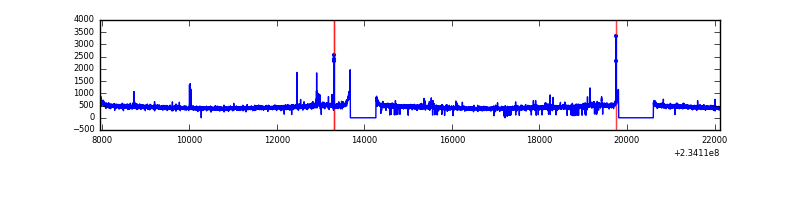 |
| D | 14168 | 12786 | 86 | 86 | 0.61% | 0.67% | 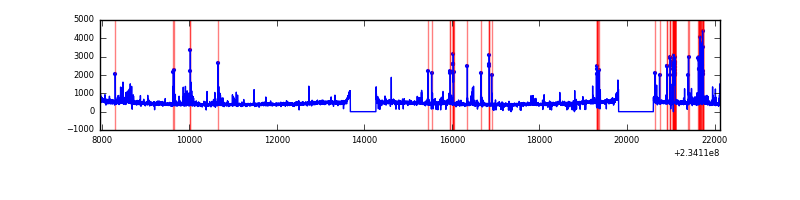 |
Top three noisy pixels from each quadrant. If the there are fewer than three noisy pixels in the level2.evt file, extra rows are filled as -1
| Pixel properties | Quadrant properties | ||||||
|---|---|---|---|---|---|---|---|
| Quadrant | DetID | PixID | Counts | Sigma | Mean | Median | Sigma |
| A | 8 | 5 | 1277459 | 4326.22 | 1456 | 1423 | 295.0 |
| A | 15 | 174 | 142411 | 478.0 | 1456 | 1423 | 295.0 |
| A | 1 | 162 | 128175 | 429.73 | 1456 | 1423 | 295.0 |
| B | 4 | 48 | 259549 | 928.33 | 1466 | 1434 | 278.0 |
| B | 4 | 80 | 96041 | 340.26 | 1466 | 1434 | 278.0 |
| B | 5 | 174 | 86302 | 305.23 | 1466 | 1434 | 278.0 |
| C | 14 | 234 | 59436 | 175.33 | 1430 | 1436 | 330.8 |
| C | 13 | 61 | 10604 | 27.71 | 1430 | 1436 | 330.8 |
| C | 8 | 128 | 7792 | 19.21 | 1430 | 1436 | 330.8 |
| D | 13 | 104 | 230006 | 653.04 | 1426 | 1383 | 350.1 |
| D | 8 | 195 | 150069 | 424.71 | 1426 | 1383 | 350.1 |
| D | 1 | 52 | 143131 | 404.89 | 1426 | 1383 | 350.1 |
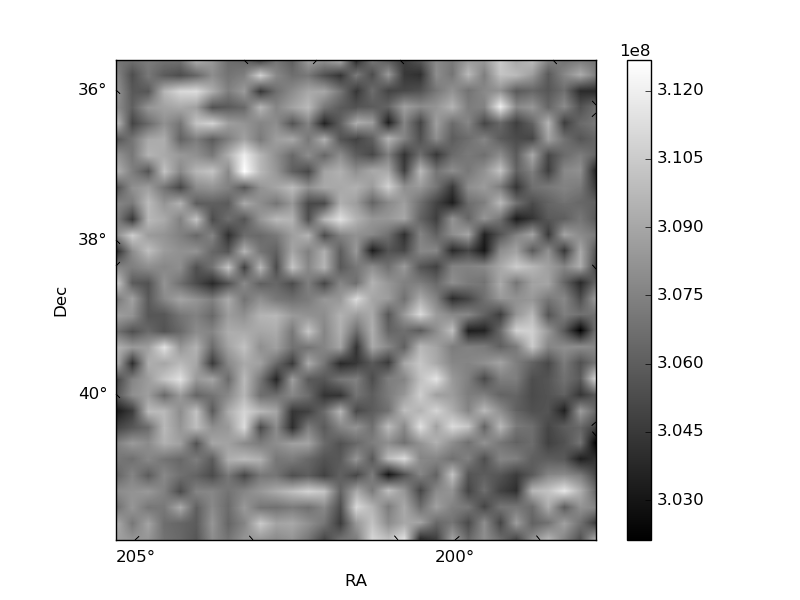
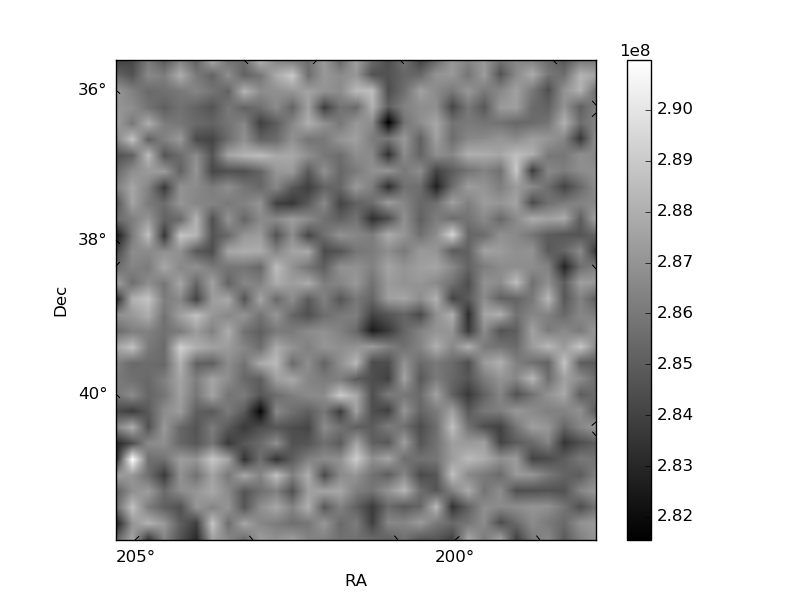
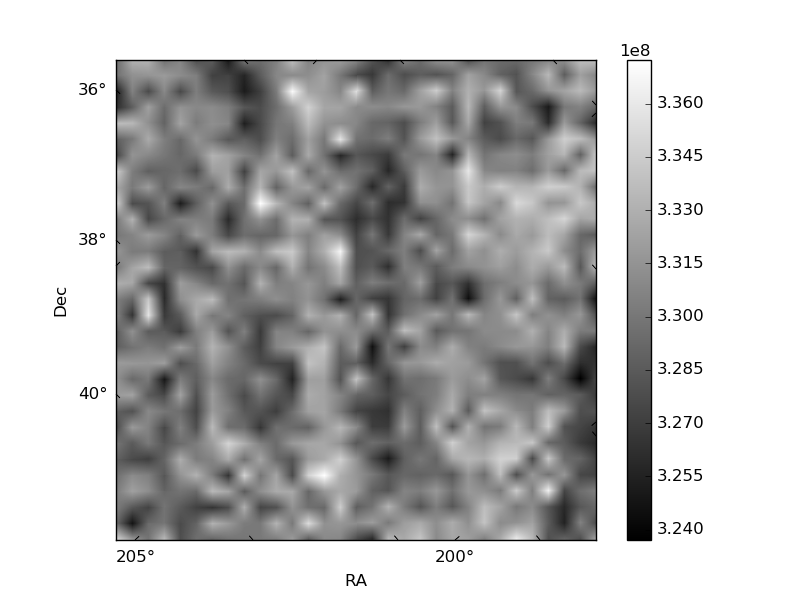
Histogram calculated using DETX and DETY for each event in the final _common_clean file
| Quadrant A | 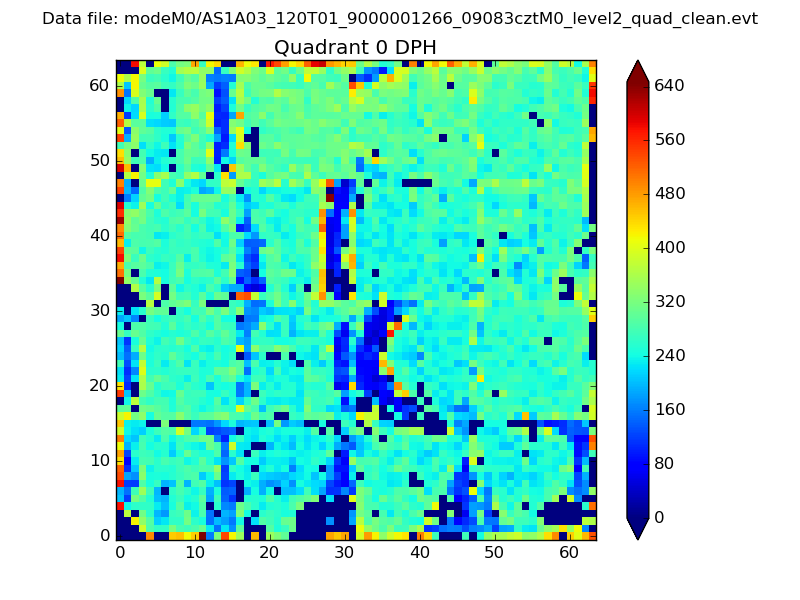 |
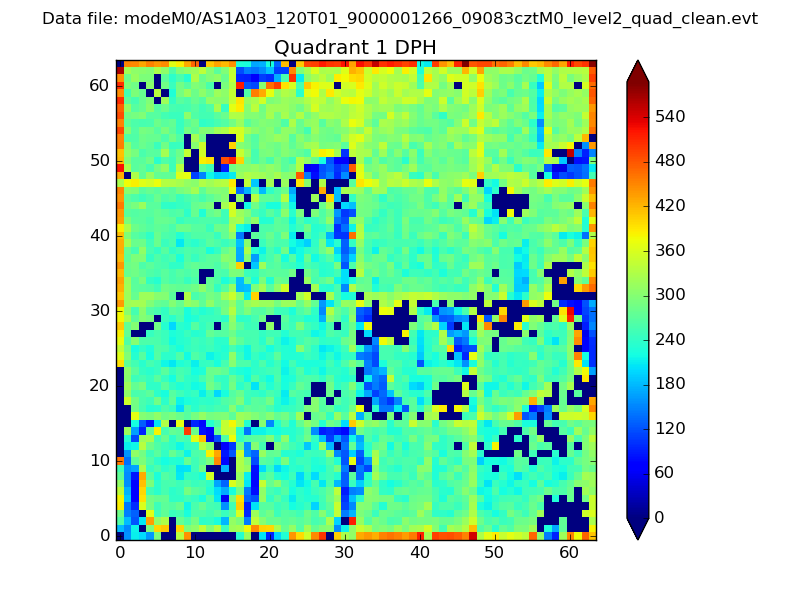 |
Quadrant B |
|---|---|---|---|
| Quadrant D | 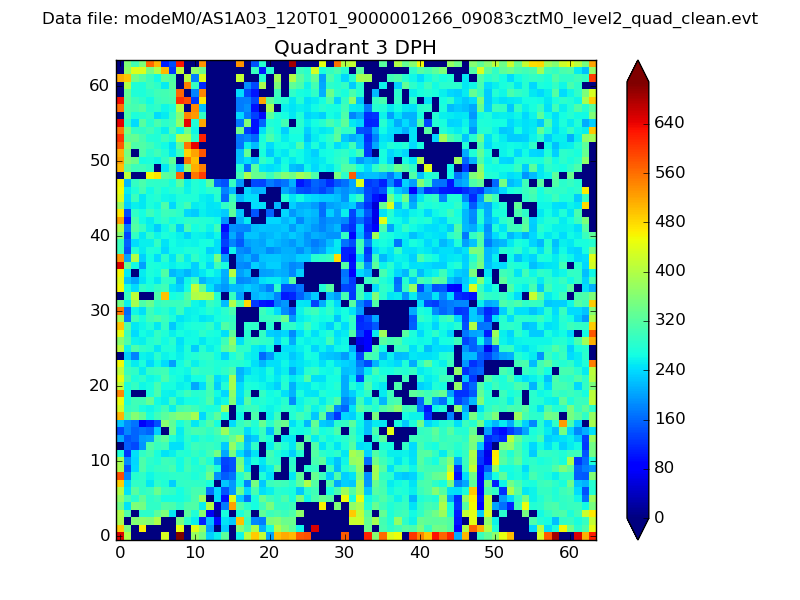 |
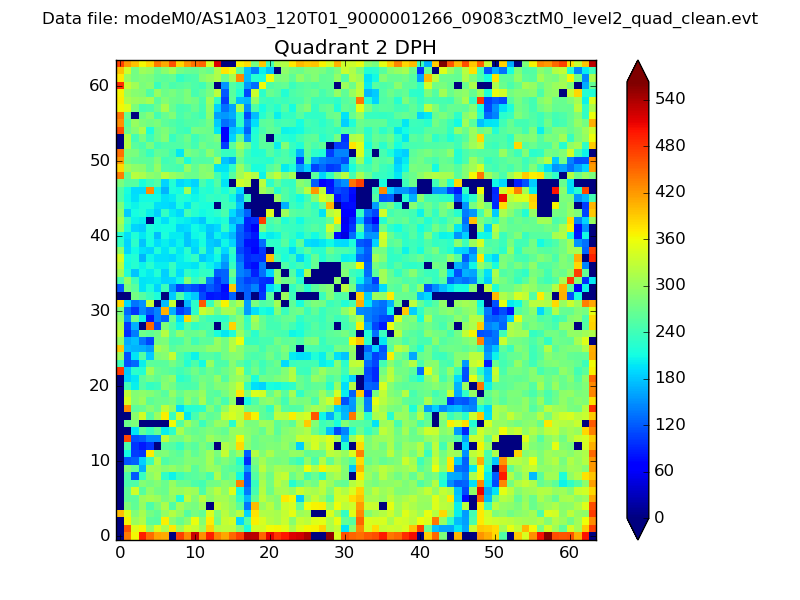 |
Quadrant C |
| Plot type | Count rate plots | Images |
|---|---|---|
| Comparison with Poisson distribution Blue bars denote a histogram of data divided into 1 sec bins. Red curve is a Poisson curve with rate = median count rate of data. |
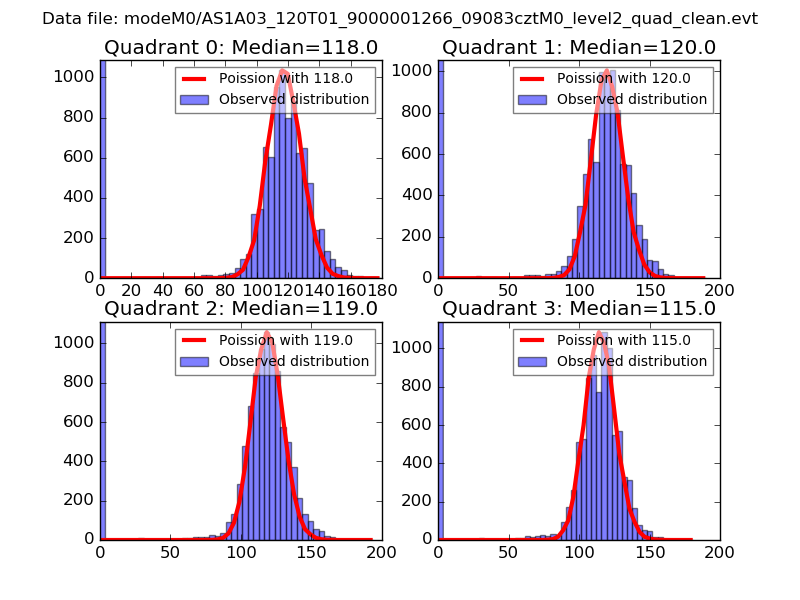 |
 |
| Quadrant-wise count rates Data is divided into 100 sec bins |
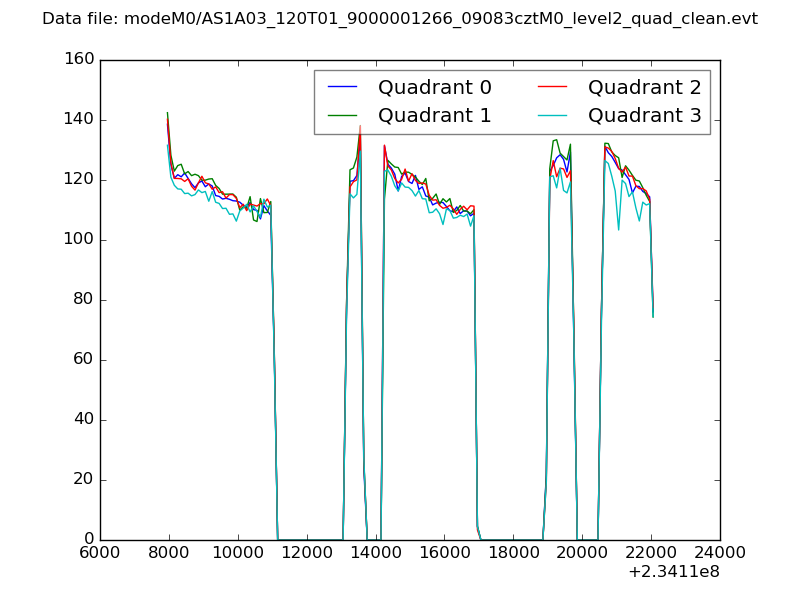 |
|
| Module-wise count rates for Quadrant A Data is divided into 100 sec bins |
 |
 |
| Module-wise count rates for Quadrant B Data is divided into 100 sec bins |
 |
 |
| Module-wise count rates for Quadrant C Data is divided into 100 sec bins |
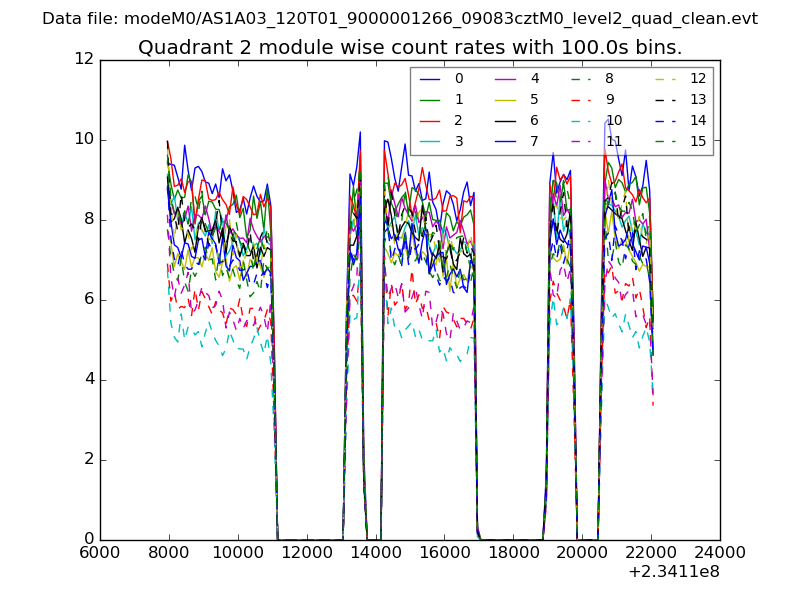 |
 |
| Module-wise count rates for Quadrant D Data is divided into 100 sec bins |
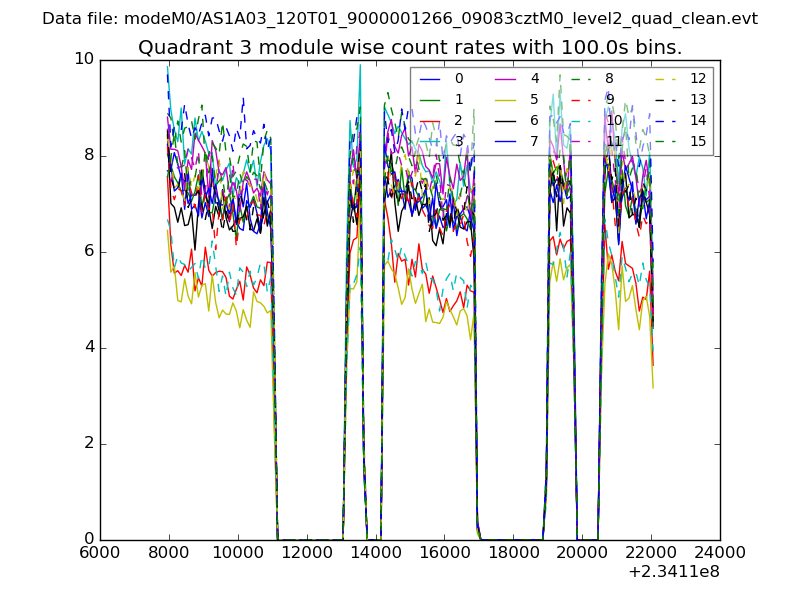 |
 |
| Parameter | Plot |
|---|---|
| CZT HV Monitor | 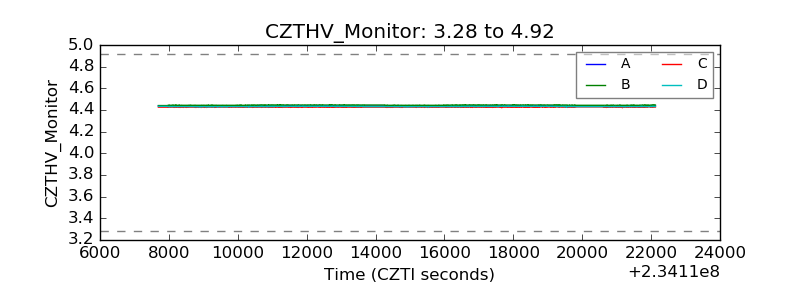 |
| D_VDD | 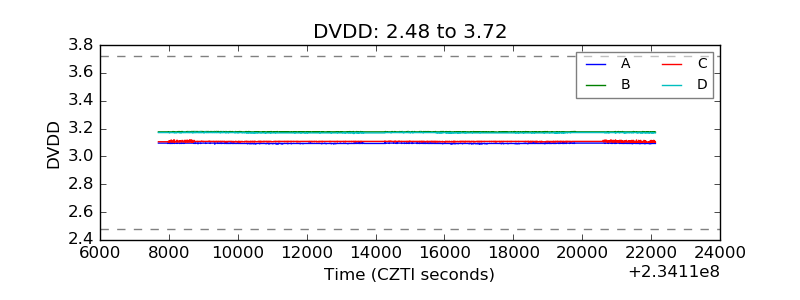 |
| Temperature 1 | 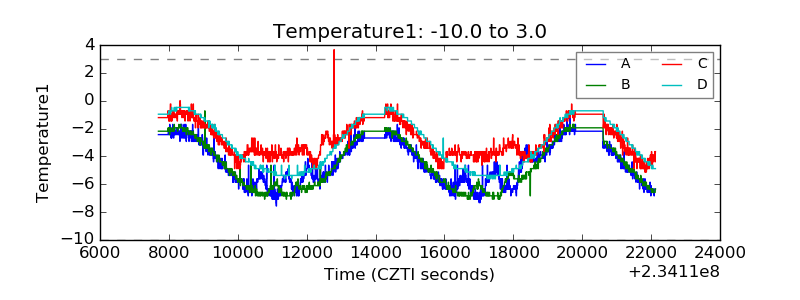 |
| Veto HV Monitor | 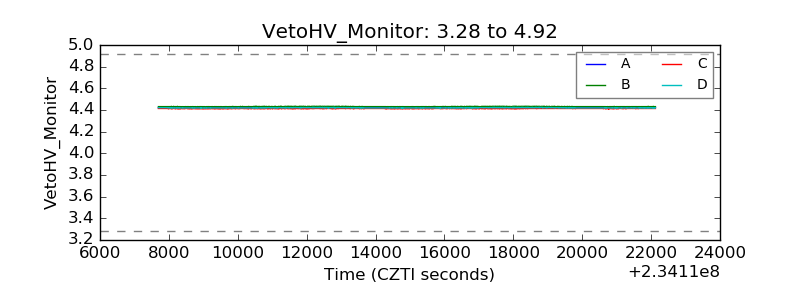 |
| Veto LLD | 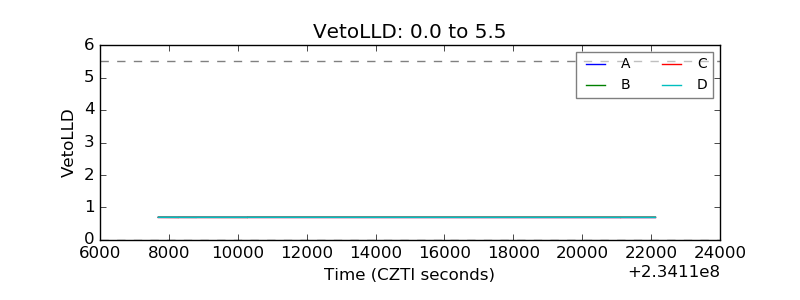 |
| Alpha Counter | 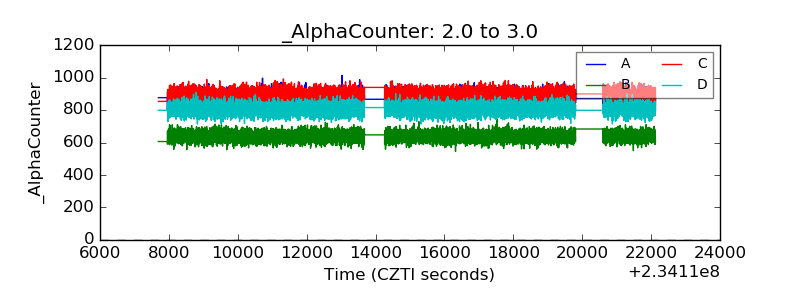 |
| _CPM_Rate | 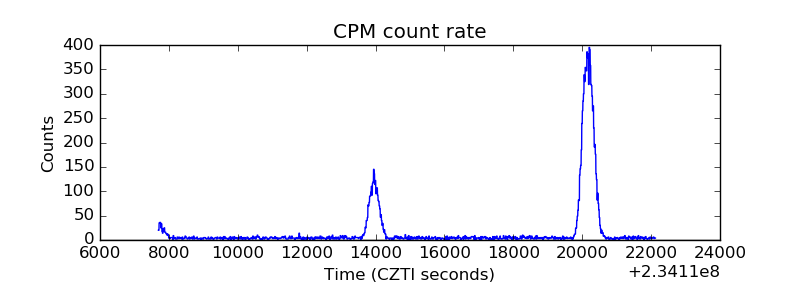 |
| CZT Counter | 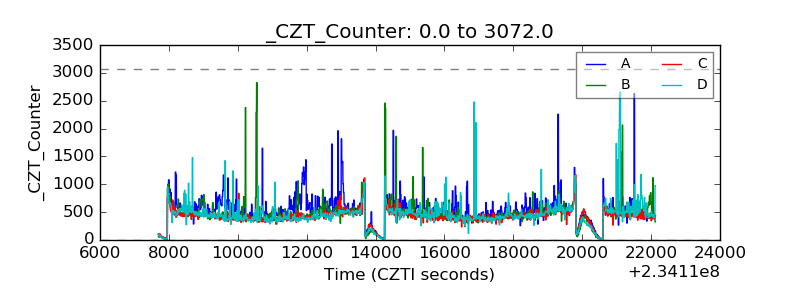 |
| +2.5 Volts monitor |  |
| +5 Volts monitor |  |
| _ROLL_ROT | 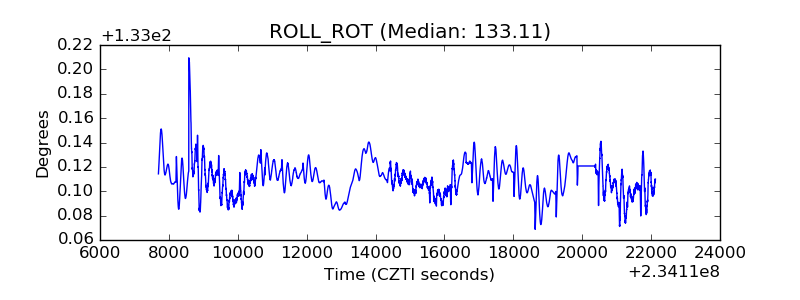 |
| _Roll_DEC | 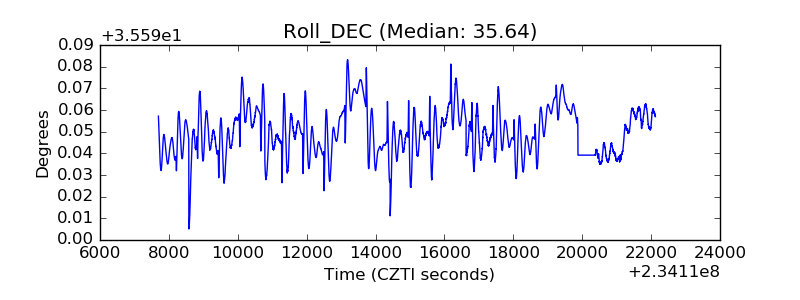 |
| _Roll_RA | 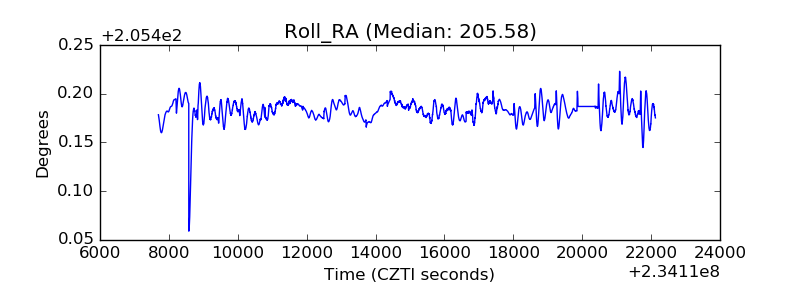 |
| Veto Counter | 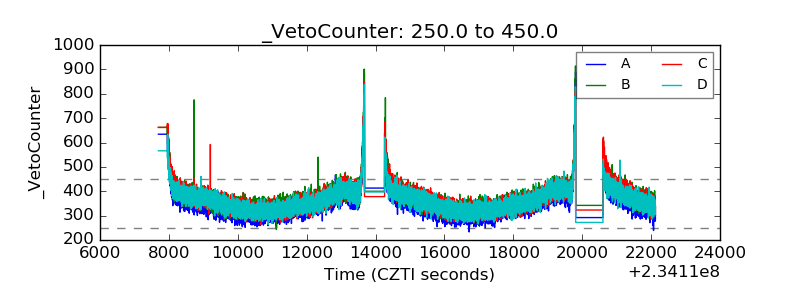 |