| Param | Original file | Final file |
|---|---|---|
| Filename | modeM0/AS1A03_120T01_9000001266_09084cztM0_level2.evt | modeM0/AS1A03_120T01_9000001266_09084cztM0_level2_quad_clean.evt |
| Size (bytes) | 453,934,080 | 89,746,560 |
| Size | 432.9 MB | 85.6 MB |
| Events in quadrant A | 3,647,700 | 563,952 |
| Events in quadrant B | 3,263,442 | 575,579 |
| Events in quadrant C | 2,948,077 | 569,142 |
| Events in quadrant D | 3,434,312 | 543,544 |
| Mode M9 | |||
|---|---|---|---|
| Quadrant | BADHDUFLAG | Total packets | Discarded packets |
| A | 0 | 13 | 0 |
| B | 0 | 13 | 0 |
| C | 0 | 13 | 0 |
| D | 0 | 14 | 0 |
| Mode M0 | |||
|---|---|---|---|
| Quadrant | BADHDUFLAG | Total packets | Discarded packets |
| A | 0 | 15254 | 14 |
| B | 0 | 14202 | 4 |
| C | 0 | 13498 | 6 |
| D | 0 | 14807 | 17 |
| Mode SS | |||
|---|---|---|---|
| Quadrant | BADHDUFLAG | Total packets | Discarded packets |
| A | 0 | 136 | 0 |
| B | 0 | 136 | 0 |
| C | 0 | 136 | 0 |
| D | 0 | 136 | 0 |
| Quadrant | Total seconds | Saturated seconds | Saturation percentage |
|---|---|---|---|
| A | 6676 | 42 | 0.629119% |
| B | 6679 | 35 | 0.524031% |
| C | 6678 | 11 | 0.164720% |
| D | 6676 | 88 | 1.318155% |
Noise dominated data is calculated using 1-second bins in cleaned event files. If a bin has >2000 counts, and if more than 50% of those come from <1% of pixels, then it is considered to be noise-dominated and hence unusable.
| Quadrant | # 1 sec bins | Bins with >0 counts | Bins with >2000 counts | High rate bins dominated by noise | Noise dominated (total time) | Noise dominated (detector-on time) | Marked lightcurve |
|---|---|---|---|---|---|---|---|
| A | 7630 | 6681 | 17 | 17 | 0.22% | 0.25% | 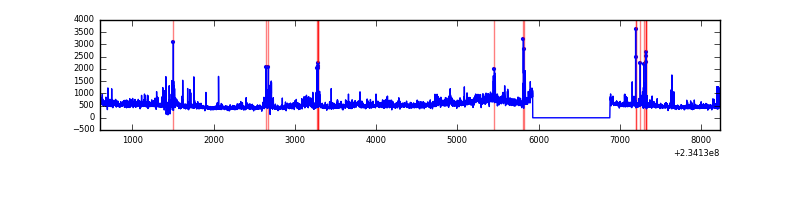 |
| B | 7630 | 6680 | 7 | 7 | 0.09% | 0.10% | 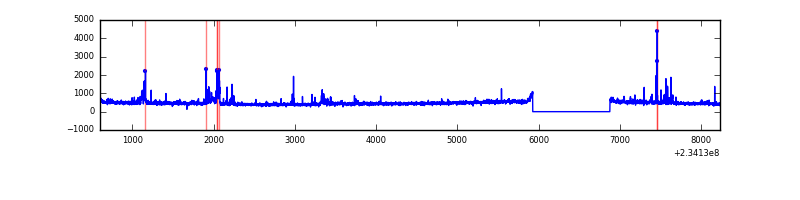 |
| C | 7630 | 6680 | 0 | 0 | 0.00% | 0.00% | 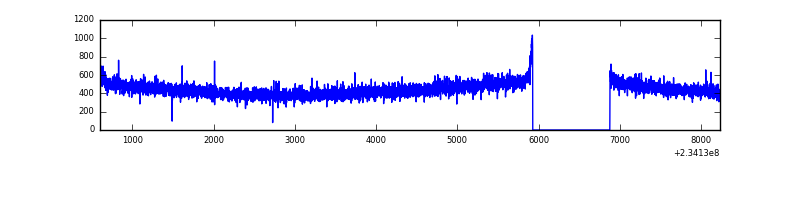 |
| D | 7630 | 6681 | 73 | 73 | 0.96% | 1.09% | 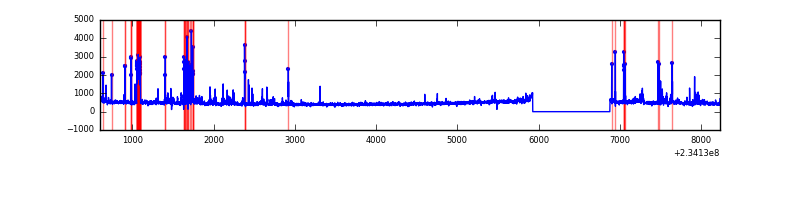 |
Top three noisy pixels from each quadrant. If the there are fewer than three noisy pixels in the level2.evt file, extra rows are filled as -1
| Pixel properties | Quadrant properties | ||||||
|---|---|---|---|---|---|---|---|
| Quadrant | DetID | PixID | Counts | Sigma | Mean | Median | Sigma |
| A | 8 | 5 | 506139 | 3267.44 | 760 | 744 | 154.7 |
| A | 5 | 16 | 91618 | 587.51 | 760 | 744 | 154.7 |
| A | 1 | 162 | 63629 | 406.56 | 760 | 744 | 154.7 |
| B | 4 | 48 | 161725 | 1100.52 | 768 | 750 | 146.3 |
| B | 0 | 230 | 46141 | 310.32 | 768 | 750 | 146.3 |
| B | 0 | 219 | 42356 | 284.44 | 768 | 750 | 146.3 |
| C | 8 | 128 | 12581 | 68.06 | 749 | 753 | 173.8 |
| C | 8 | 112 | 6325 | 32.06 | 749 | 753 | 173.8 |
| C | 13 | 61 | 5776 | 28.9 | 749 | 753 | 173.8 |
| D | 13 | 104 | 215076 | 1075.33 | 736 | 720 | 199.3 |
| D | 8 | 195 | 131442 | 655.77 | 736 | 720 | 199.3 |
| D | 7 | 71 | 65509 | 325.02 | 736 | 720 | 199.3 |
Histogram calculated using DETX and DETY for each event in the final _common_clean file
| Quadrant A | 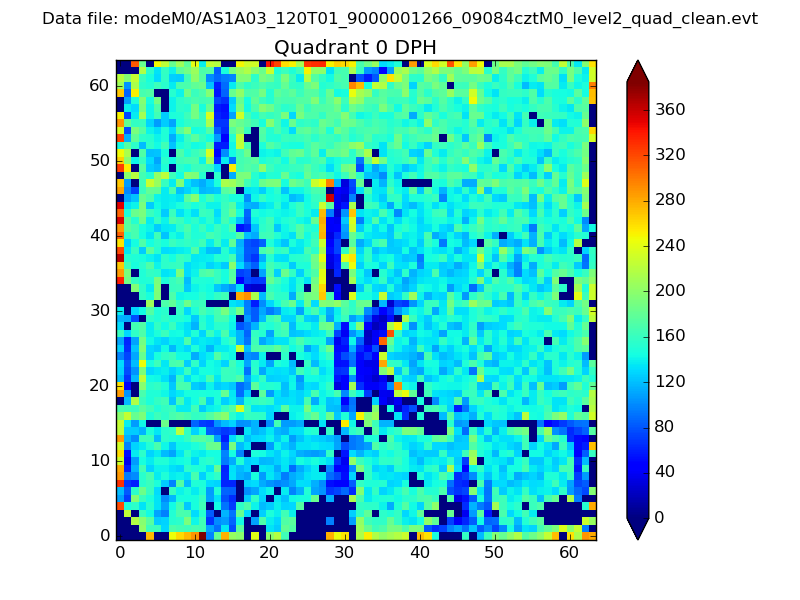 |
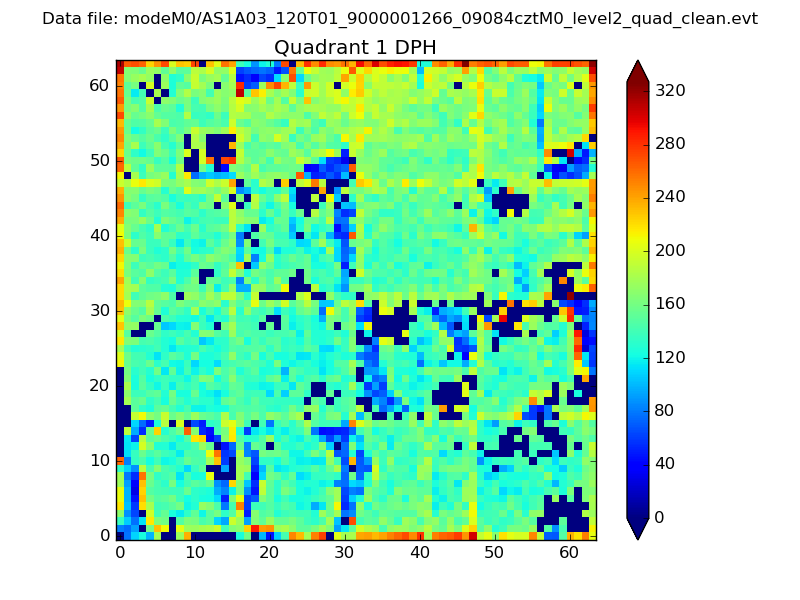 |
Quadrant B |
|---|---|---|---|
| Quadrant D | 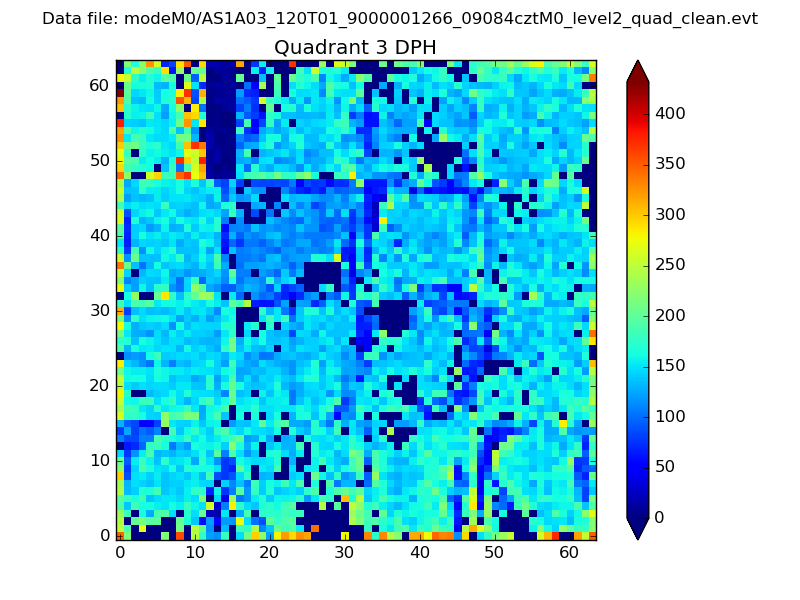 |
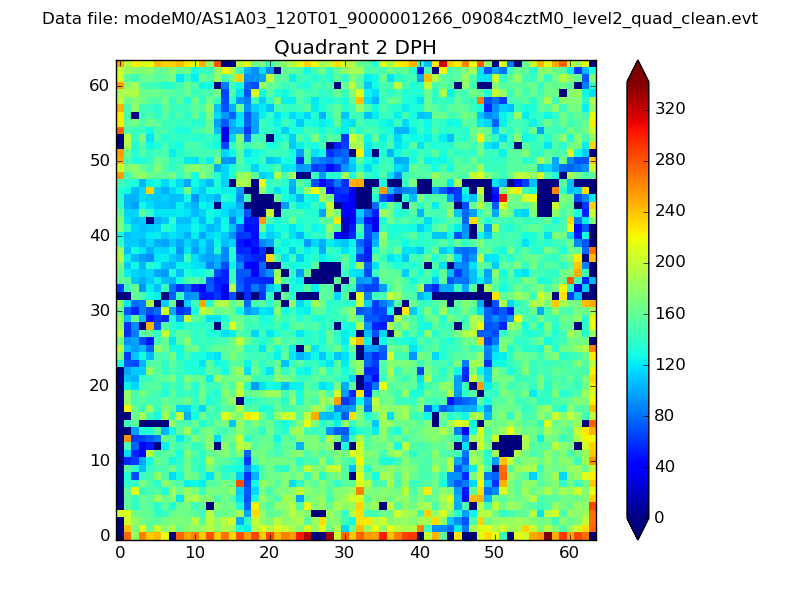 |
Quadrant C |
| Plot type | Count rate plots | Images |
|---|---|---|
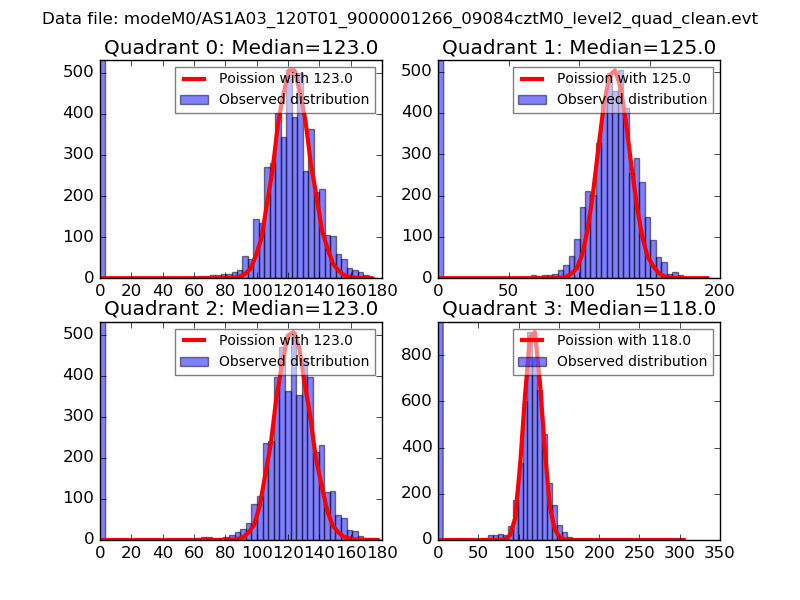
| Comparison with Poisson distribution Blue bars denote a histogram of data divided into 1 sec bins. Red curve is a Poisson curve with rate = median count rate of data. |
 |
 |
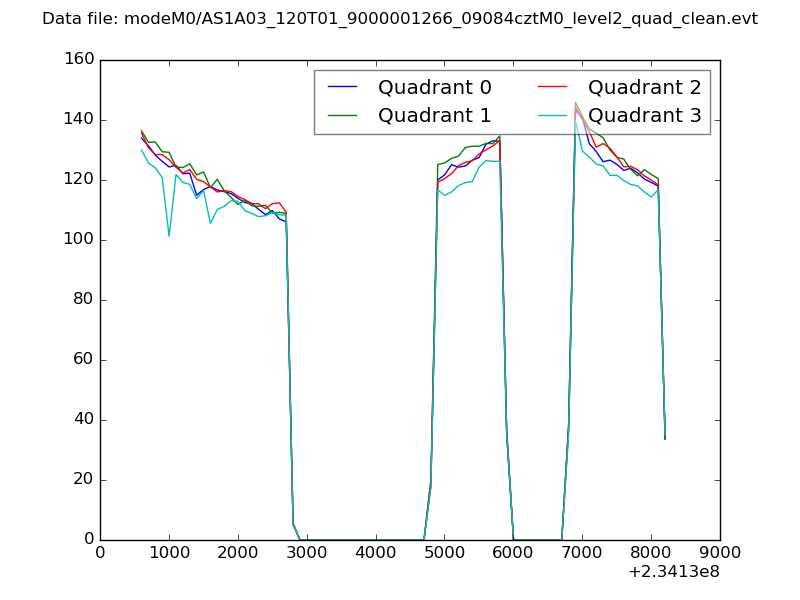
| Quadrant-wise count rates Data is divided into 100 sec bins |
 |
|
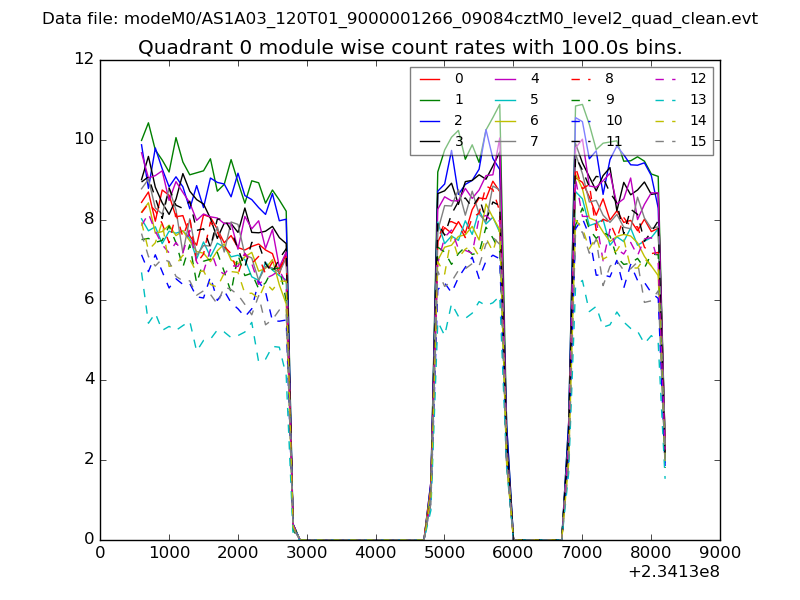
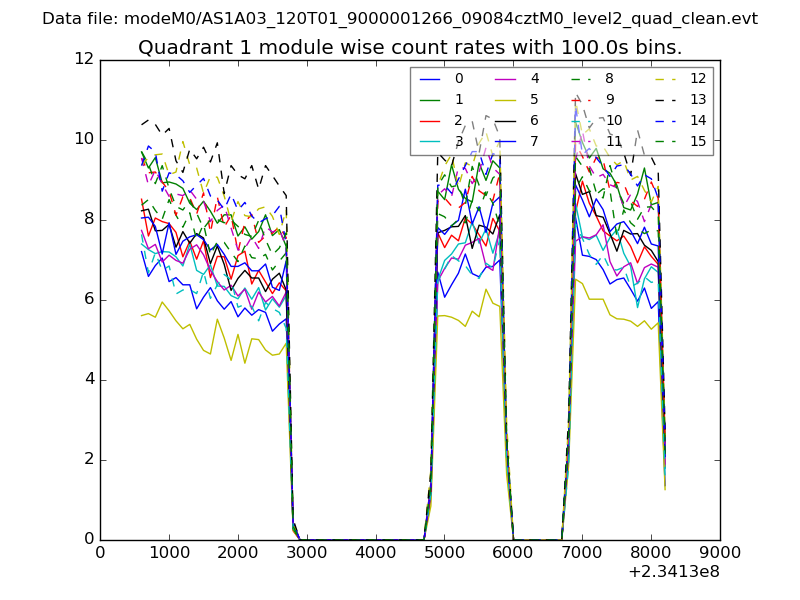
| Module-wise count rates for Quadrant A Data is divided into 100 sec bins |
 |
 |
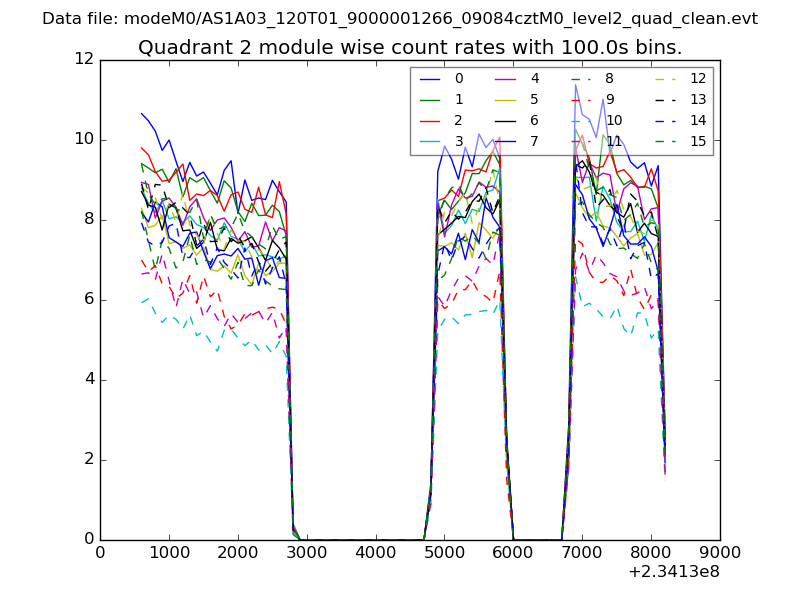
| Module-wise count rates for Quadrant B Data is divided into 100 sec bins |
 |
 |
| Module-wise count rates for Quadrant C Data is divided into 100 sec bins |
 |
 |
| Module-wise count rates for Quadrant D Data is divided into 100 sec bins |
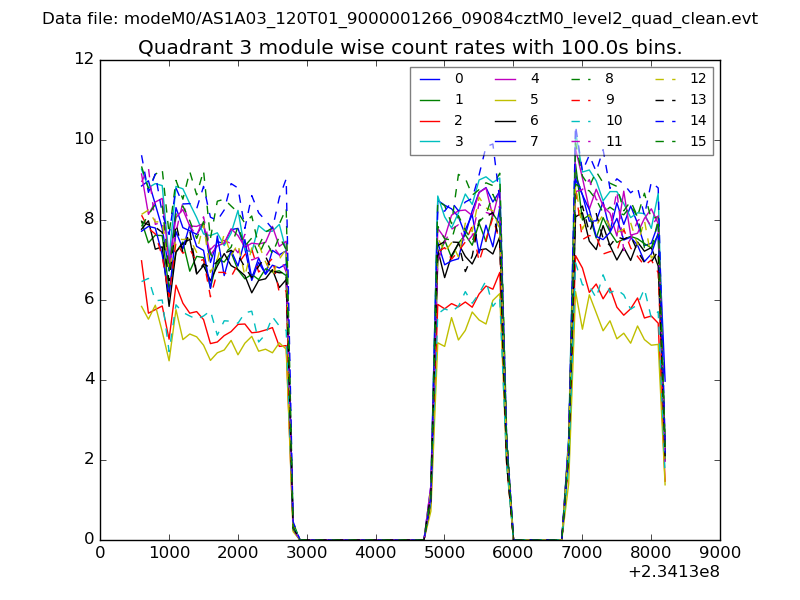 |
 |
| Parameter | Plot |
|---|---|
| CZT HV Monitor | 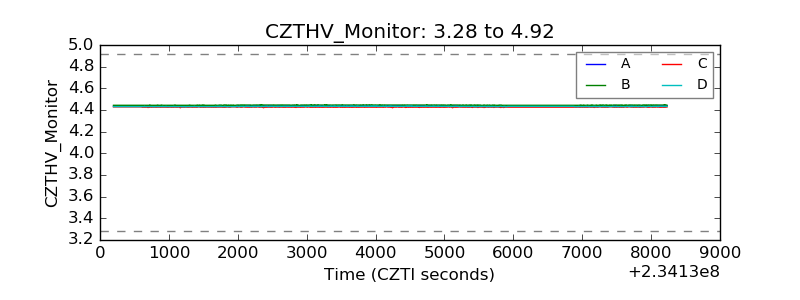 |
| D_VDD | 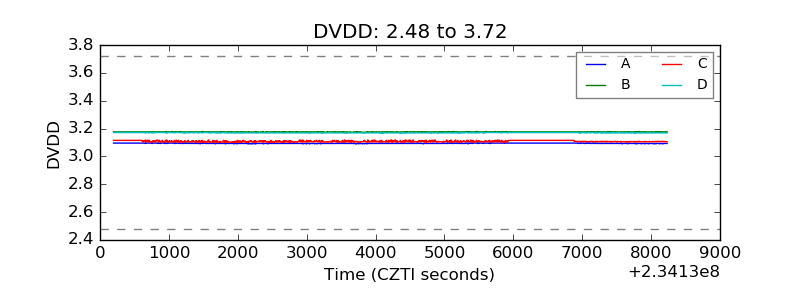 |
| Temperature 1 | 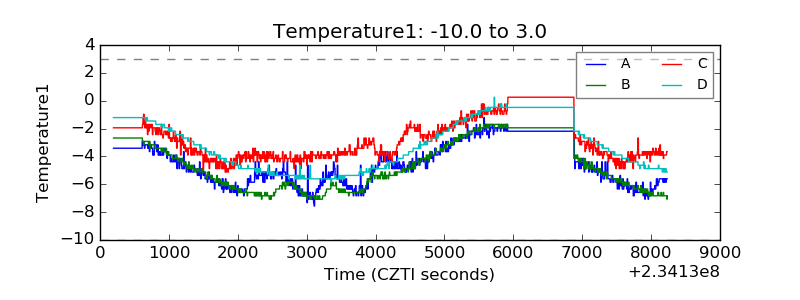 |
| Veto HV Monitor | 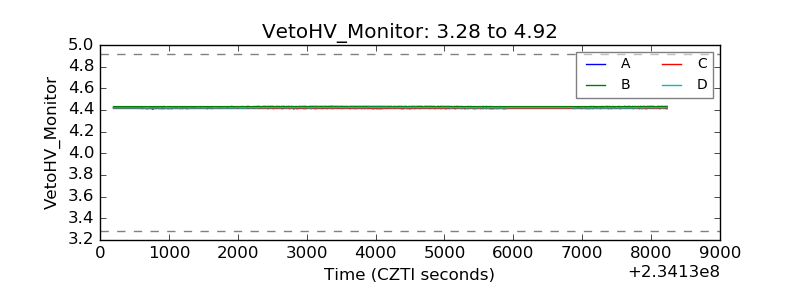 |
| Veto LLD | 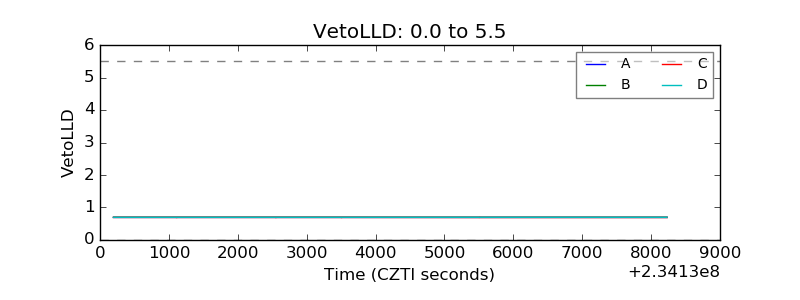 |
| Alpha Counter | 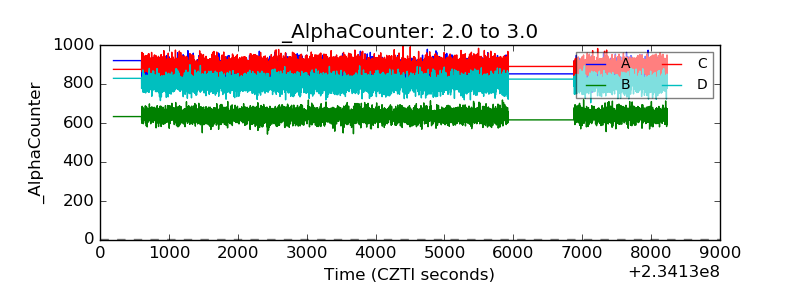 |
| _CPM_Rate | 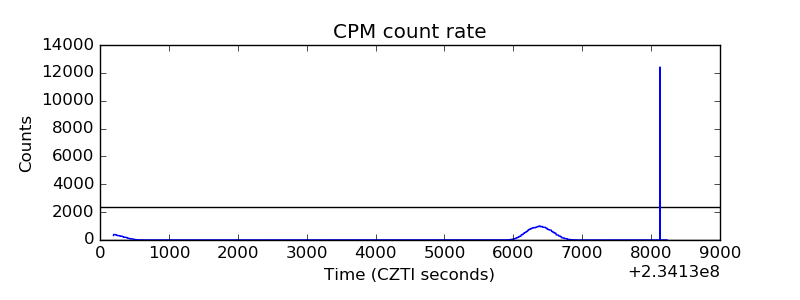 |
| CZT Counter | 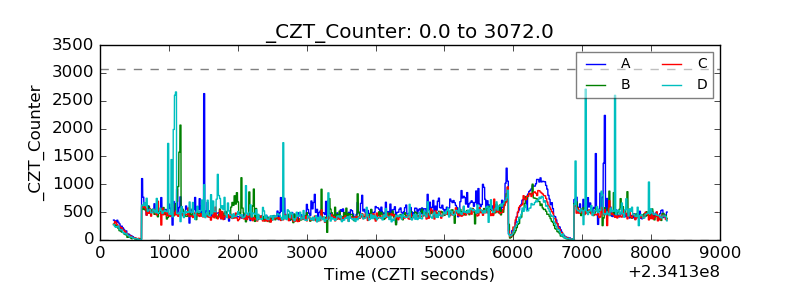 |
| +2.5 Volts monitor |  |
| +5 Volts monitor |  |
| _ROLL_ROT | 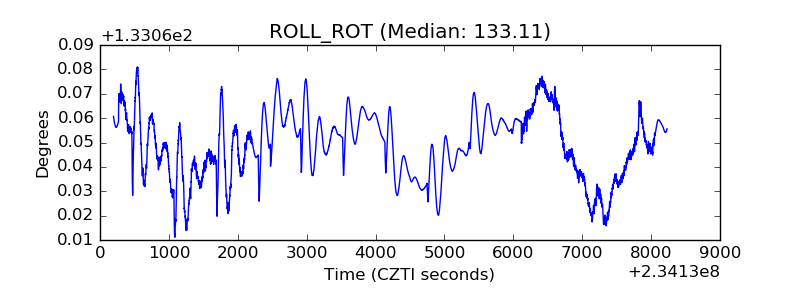 |
| _Roll_DEC | 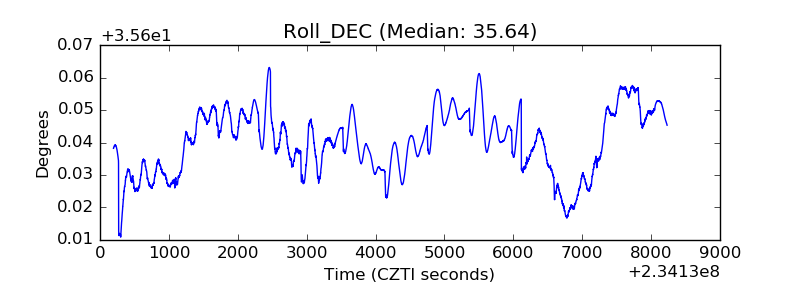 |
| _Roll_RA | 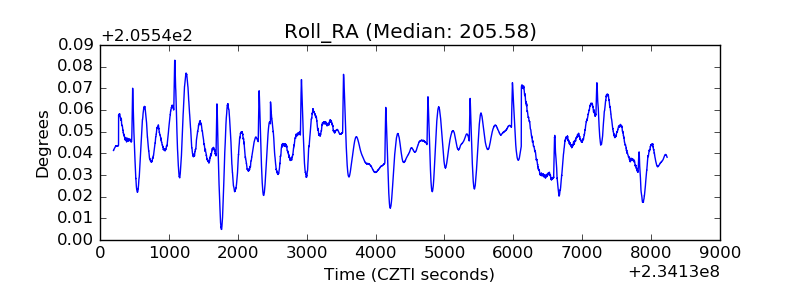 |
| Veto Counter | 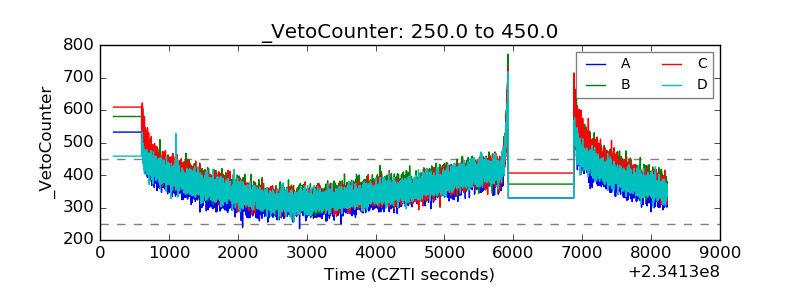 |