| Param | Original file | Final file |
|---|---|---|
| Filename | modeM0/AS1A03_120T01_9000001266_09085cztM0_level2.evt | modeM0/AS1A03_120T01_9000001266_09085cztM0_level2_quad_clean.evt |
| Size (bytes) | 418,083,840 | 87,563,520 |
| Size | 398.7 MB | 83.5 MB |
| Events in quadrant A | 3,331,603 | 547,471 |
| Events in quadrant B | 3,000,700 | 568,732 |
| Events in quadrant C | 2,833,948 | 561,663 |
| Events in quadrant D | 3,064,082 | 532,001 |
| Mode M9 | |||
|---|---|---|---|
| Quadrant | BADHDUFLAG | Total packets | Discarded packets |
| A | 0 | 20 | 0 |
| B | 0 | 20 | 0 |
| C | 0 | 20 | 1 |
| D | 0 | 20 | 0 |
| Mode M0 | |||
|---|---|---|---|
| Quadrant | BADHDUFLAG | Total packets | Discarded packets |
| A | 0 | 15265 | 1329 |
| B | 0 | 14158 | 1018 |
| C | 0 | 13871 | 947 |
| D | 0 | 14840 | 1186 |
| Mode SS | |||
|---|---|---|---|
| Quadrant | BADHDUFLAG | Total packets | Discarded packets |
| A | 0 | 142 | 12 |
| B | 0 | 142 | 8 |
| C | 0 | 142 | 8 |
| D | 0 | 142 | 6 |
| Quadrant | Total seconds | Saturated seconds | Saturation percentage |
|---|---|---|---|
| A | 6269 | 63 | 1.004945% |
| B | 6330 | 35 | 0.552923% |
| C | 6352 | 18 | 0.283375% |
| D | 6308 | 36 | 0.570704% |
Noise dominated data is calculated using 1-second bins in cleaned event files. If a bin has >2000 counts, and if more than 50% of those come from <1% of pixels, then it is considered to be noise-dominated and hence unusable.
| Quadrant | # 1 sec bins | Bins with >0 counts | Bins with >2000 counts | High rate bins dominated by noise | Noise dominated (total time) | Noise dominated (detector-on time) | Marked lightcurve |
|---|---|---|---|---|---|---|---|
| A | 8869 | 6705 | 23 | 23 | 0.26% | 0.34% | 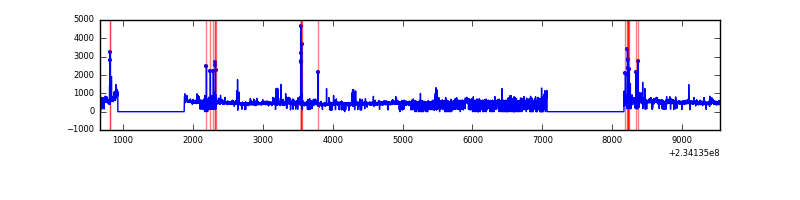 |
| B | 8869 | 6717 | 2 | 2 | 0.02% | 0.03% | 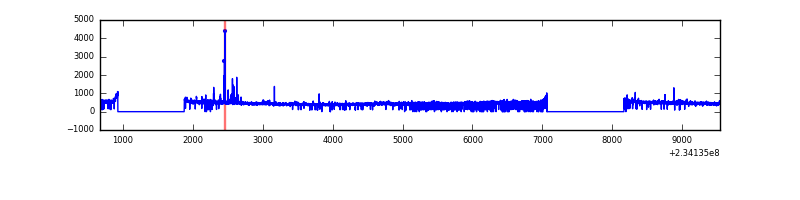 |
| C | 8869 | 6726 | 0 | 0 | 0.00% | 0.00% | 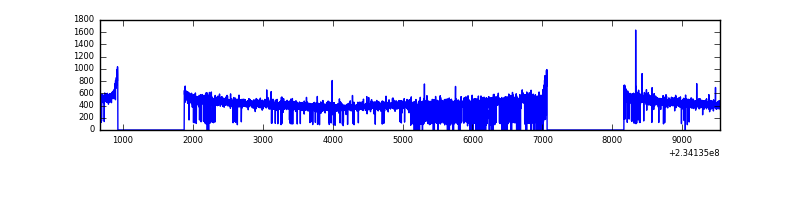 |
| D | 8869 | 6715 | 22 | 22 | 0.25% | 0.33% | 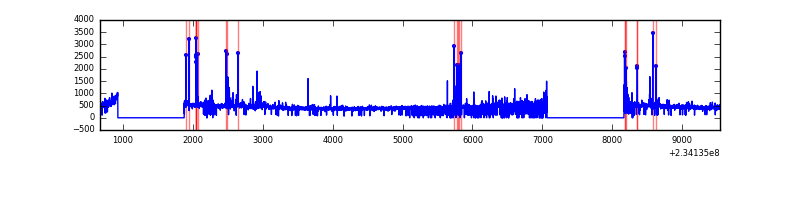 |
Top three noisy pixels from each quadrant. If the there are fewer than three noisy pixels in the level2.evt file, extra rows are filled as -1
| Pixel properties | Quadrant properties | ||||||
|---|---|---|---|---|---|---|---|
| Quadrant | DetID | PixID | Counts | Sigma | Mean | Median | Sigma |
| A | 8 | 5 | 280821 | 1895.53 | 726 | 712 | 147.8 |
| A | 4 | 2 | 75231 | 504.28 | 726 | 712 | 147.8 |
| A | 1 | 162 | 71991 | 482.35 | 726 | 712 | 147.8 |
| B | 0 | 219 | 30973 | 214.42 | 743 | 725 | 141.1 |
| B | 4 | 48 | 26625 | 183.6 | 743 | 725 | 141.1 |
| B | 0 | 230 | 19397 | 132.36 | 743 | 725 | 141.1 |
| C | 13 | 61 | 5584 | 28.61 | 725 | 730 | 169.6 |
| C | 12 | 4 | 3658 | 17.26 | 725 | 730 | 169.6 |
| C | 3 | 202 | 1874 | 6.74 | 725 | 730 | 169.6 |
| D | 8 | 195 | 92398 | 482.56 | 707 | 691 | 190.0 |
| D | 7 | 71 | 90194 | 470.97 | 707 | 691 | 190.0 |
| D | 12 | 233 | 46389 | 240.46 | 707 | 691 | 190.0 |
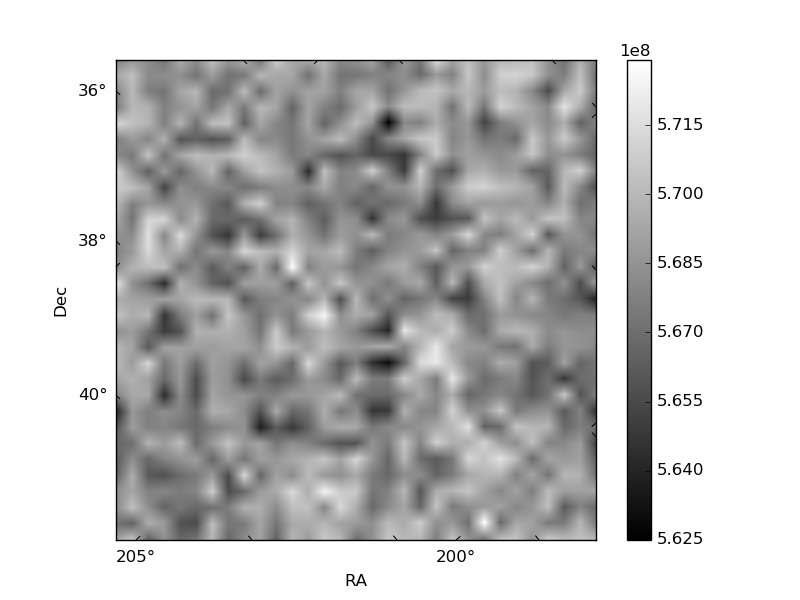
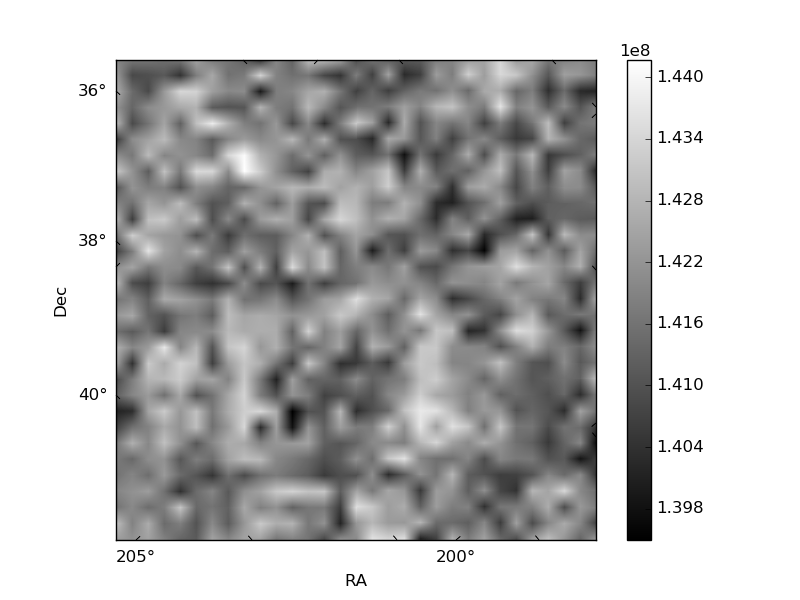
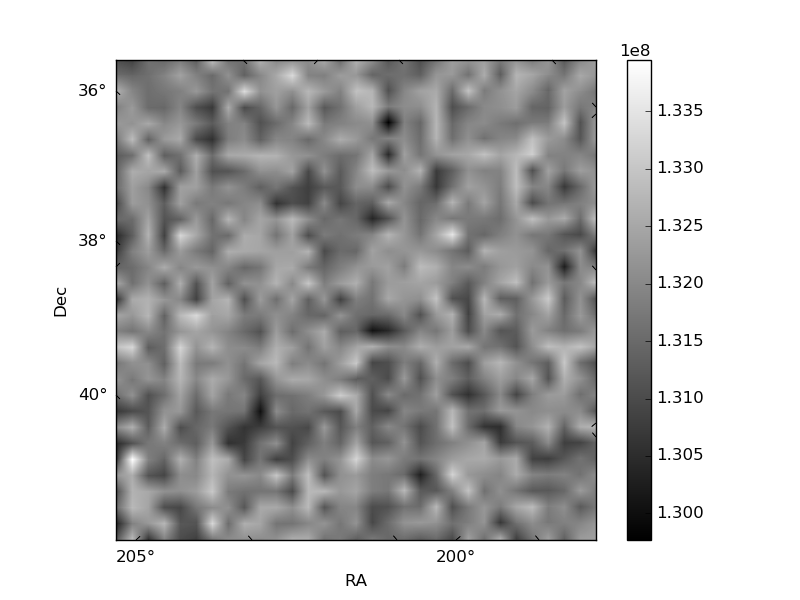
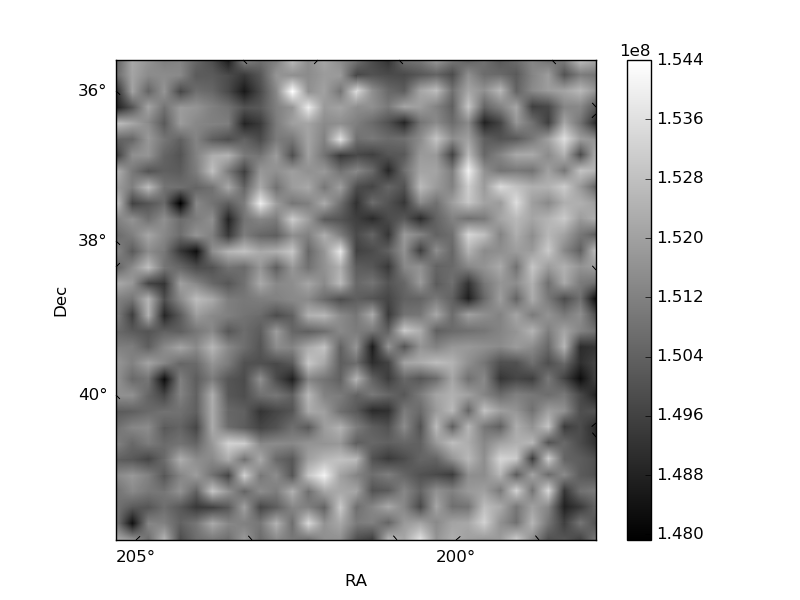
Histogram calculated using DETX and DETY for each event in the final _common_clean file
| Quadrant A | 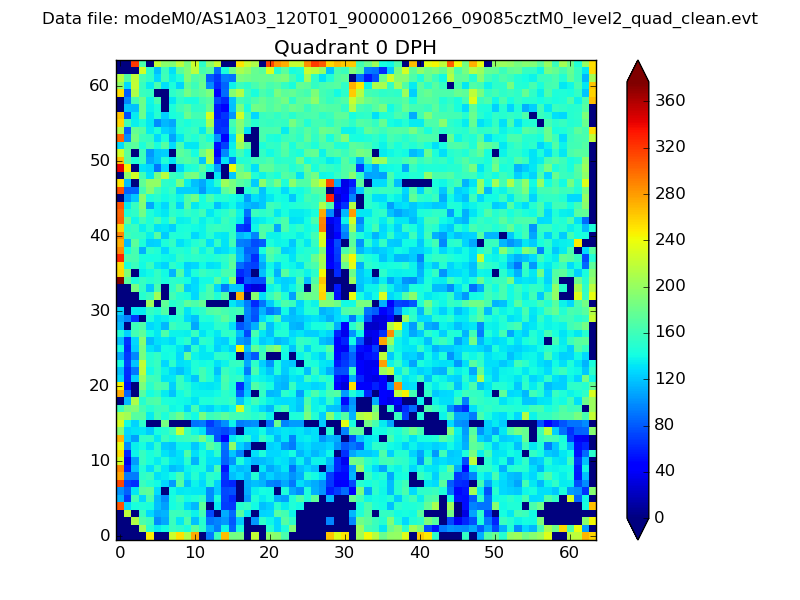 |
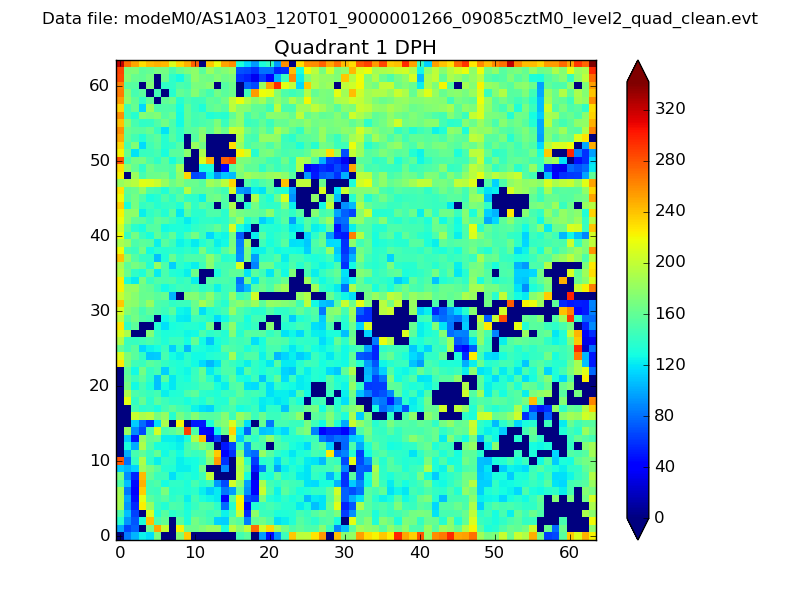 |
Quadrant B |
|---|---|---|---|
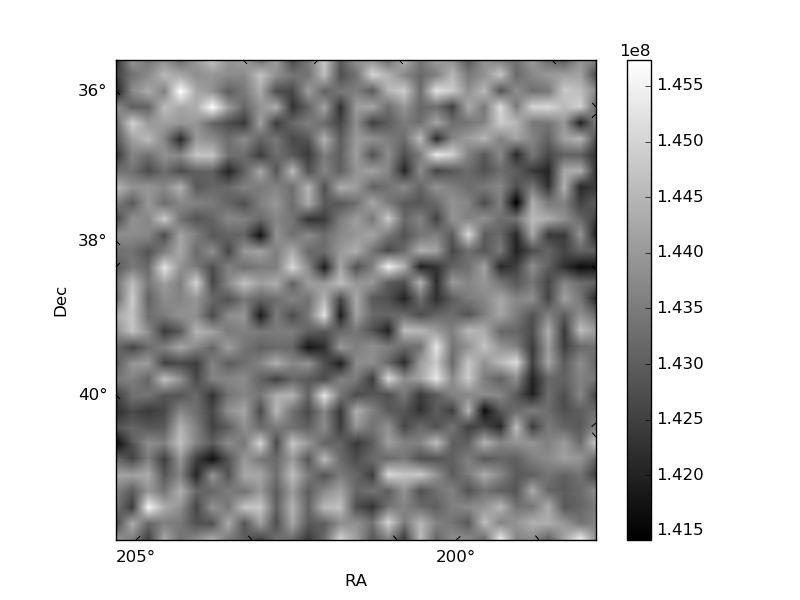
| Quadrant D |  |
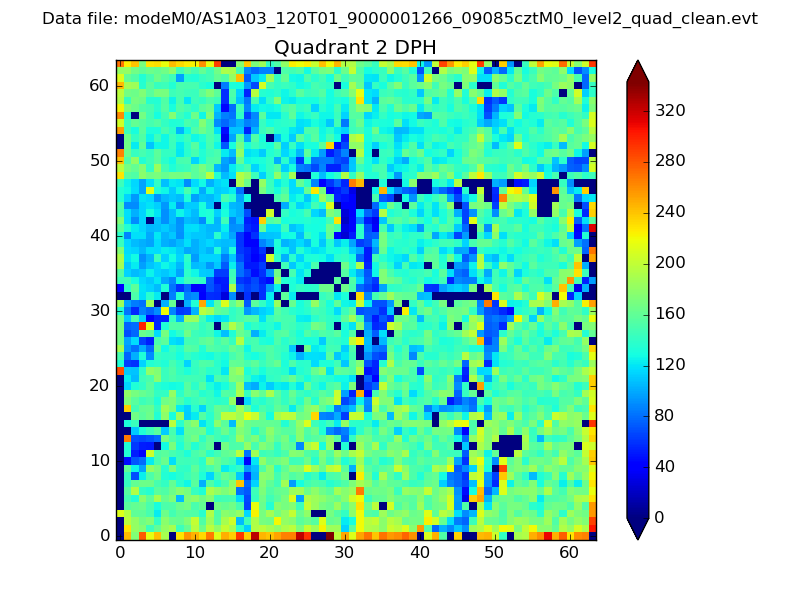 |
Quadrant C |
| Plot type | Count rate plots | Images |
|---|---|---|
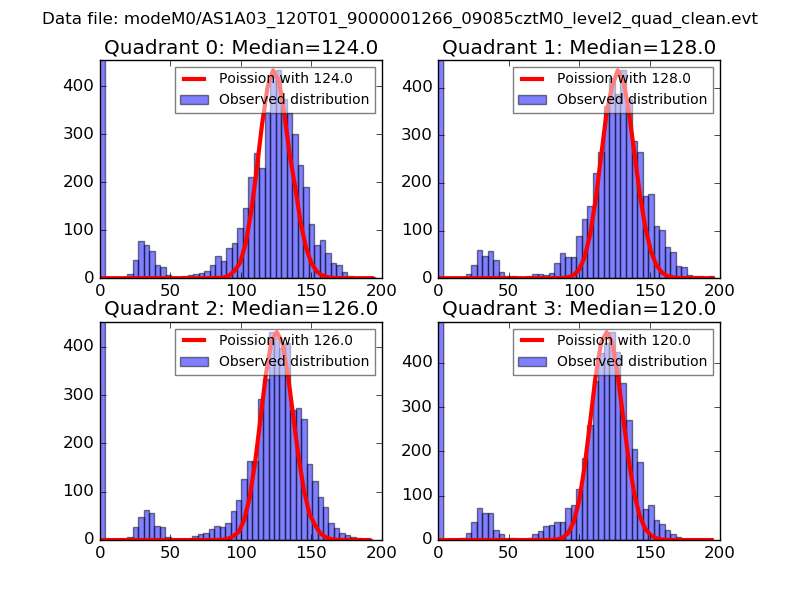
| Comparison with Poisson distribution Blue bars denote a histogram of data divided into 1 sec bins. Red curve is a Poisson curve with rate = median count rate of data. |
 |
 |
| Quadrant-wise count rates Data is divided into 100 sec bins |
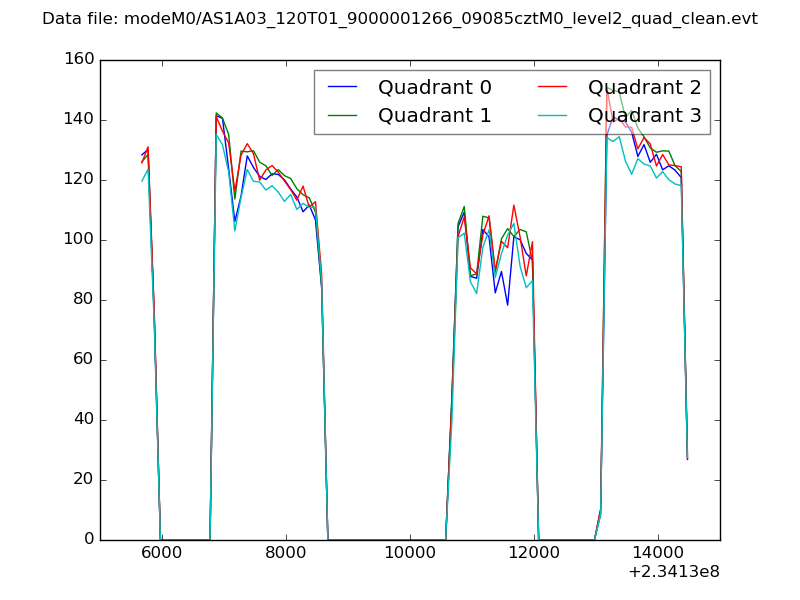 |
|
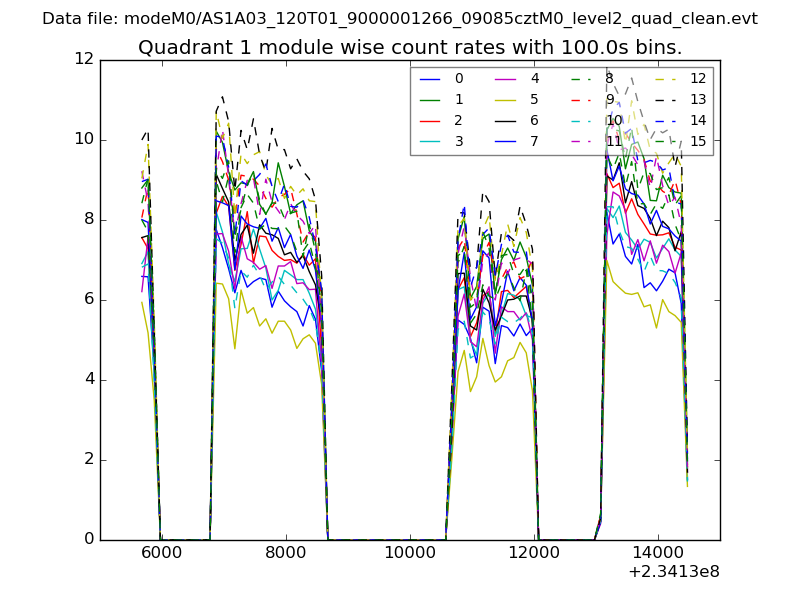
| Module-wise count rates for Quadrant A Data is divided into 100 sec bins |
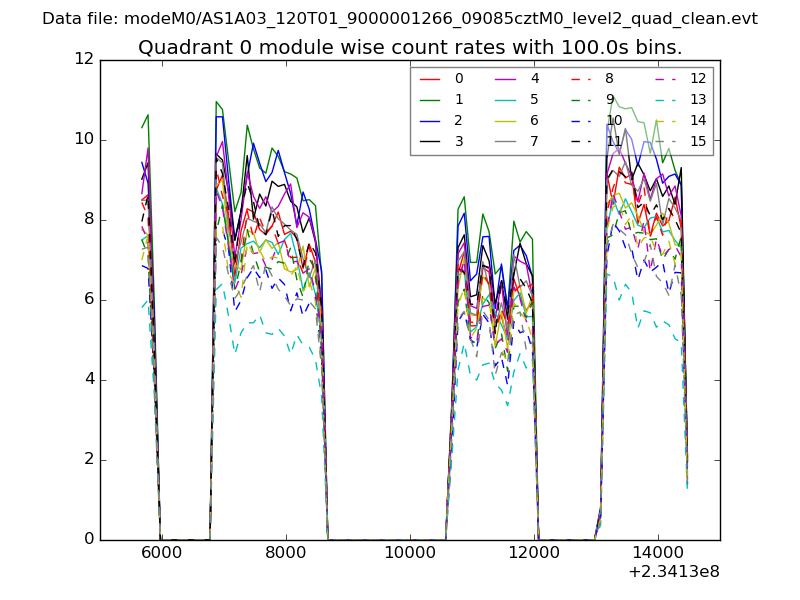 |
 |
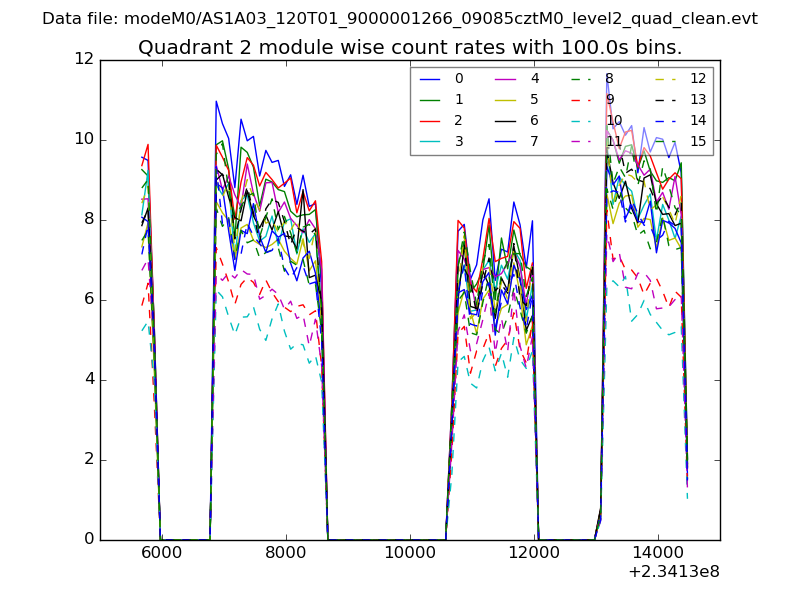
| Module-wise count rates for Quadrant B Data is divided into 100 sec bins |
 |
 |
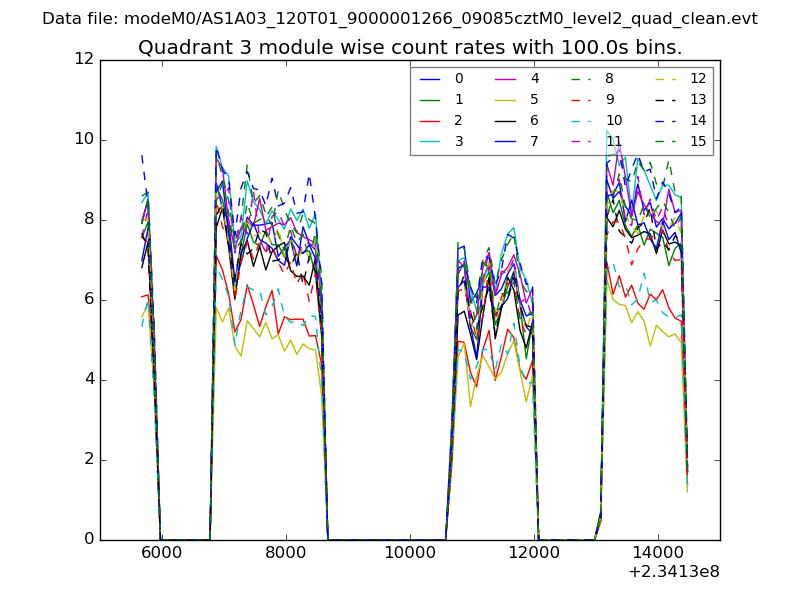
| Module-wise count rates for Quadrant C Data is divided into 100 sec bins |
 |
 |
| Module-wise count rates for Quadrant D Data is divided into 100 sec bins |
 |
 |
| Parameter | Plot |
|---|---|
| CZT HV Monitor | 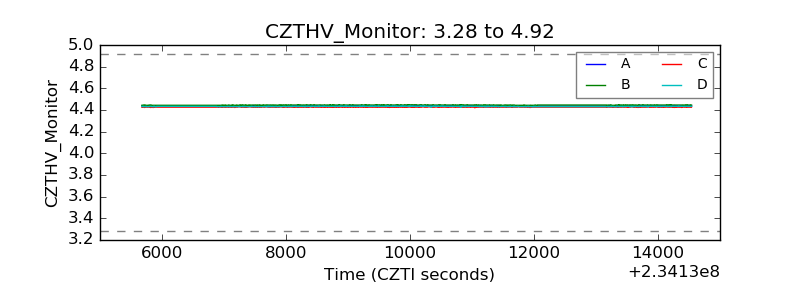 |
| D_VDD | 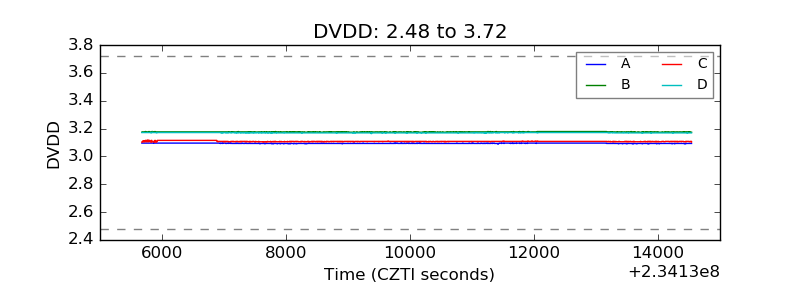 |
| Temperature 1 | 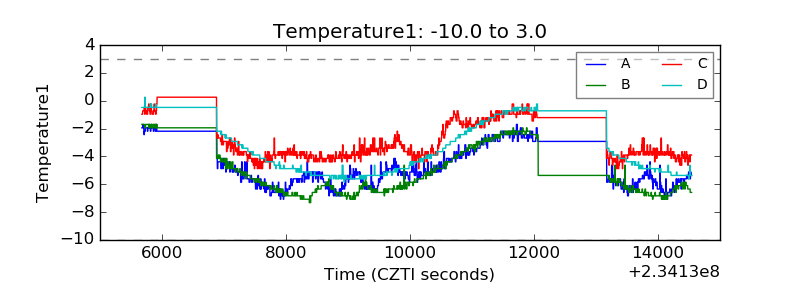 |
| Veto HV Monitor | 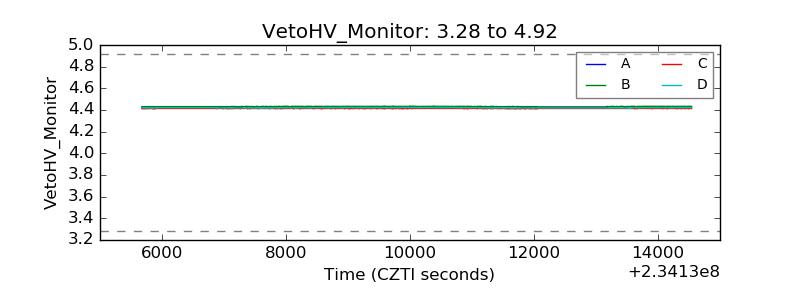 |
| Veto LLD | 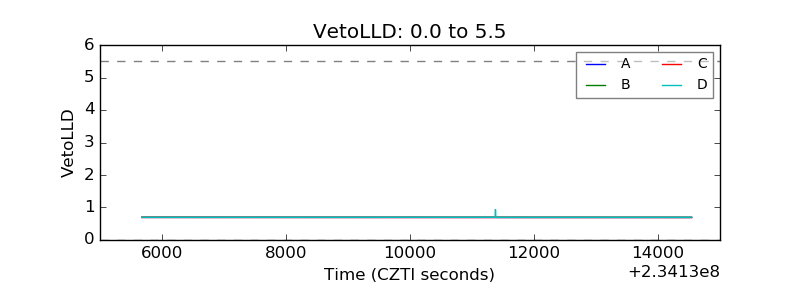 |
| Alpha Counter | 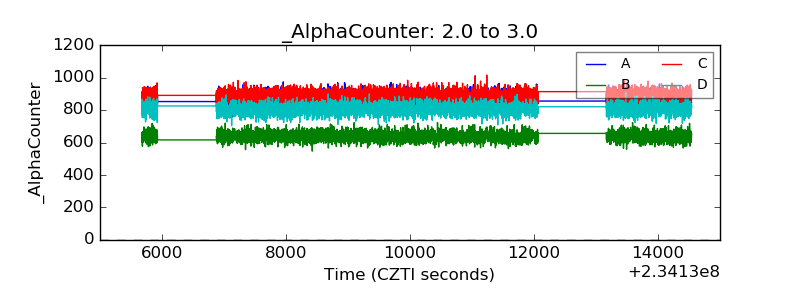 |
| _CPM_Rate | 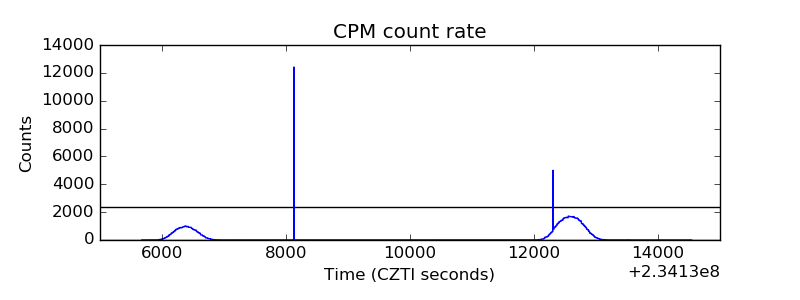 |
| CZT Counter | 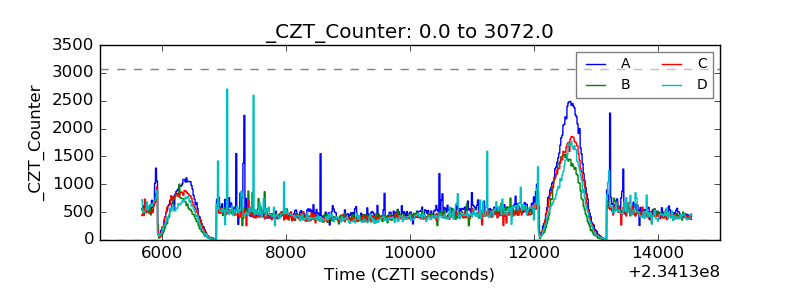 |
| +2.5 Volts monitor |  |
| +5 Volts monitor |  |
| _ROLL_ROT |  |
| _Roll_DEC |  |
| _Roll_RA | 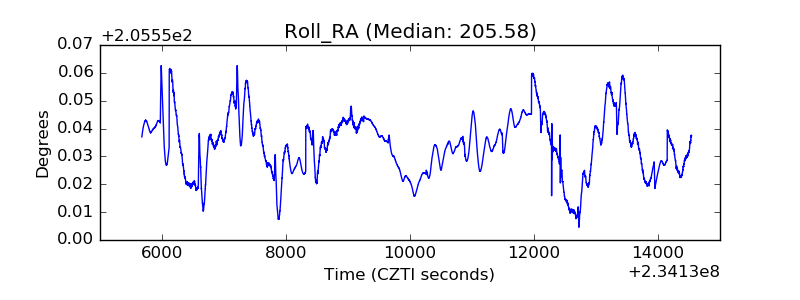 |
| Veto Counter | 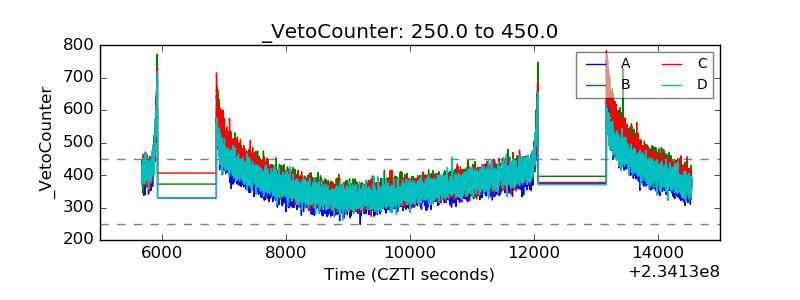 |