| Param | Original file | Final file |
|---|---|---|
| Filename | modeM0/AS1A03_120T01_9000001266_09087cztM0_level2.evt | modeM0/AS1A03_120T01_9000001266_09087cztM0_level2_quad_clean.evt |
| Size (bytes) | 420,459,840 | 83,105,280 |
| Size | 401.0 MB | 79.3 MB |
| Events in quadrant A | 3,351,376 | 519,132 |
| Events in quadrant B | 3,061,816 | 539,320 |
| Events in quadrant C | 2,847,523 | 523,114 |
| Events in quadrant D | 3,049,530 | 500,882 |
| Mode M9 | |||
|---|---|---|---|
| Quadrant | BADHDUFLAG | Total packets | Discarded packets |
| A | 0 | 23 | 1 |
| B | 0 | 23 | 0 |
| C | 0 | 23 | 1 |
| D | 0 | 23 | 0 |
| Mode M0 | |||
|---|---|---|---|
| Quadrant | BADHDUFLAG | Total packets | Discarded packets |
| A | 0 | 14579 | 678 |
| B | 0 | 13636 | 538 |
| C | 0 | 13223 | 500 |
| D | 0 | 13948 | 617 |
| Mode SS | |||
|---|---|---|---|
| Quadrant | BADHDUFLAG | Total packets | Discarded packets |
| A | 0 | 134 | 2 |
| B | 0 | 134 | 4 |
| C | 0 | 133 | 3 |
| D | 0 | 134 | 6 |
| Quadrant | Total seconds | Saturated seconds | Saturation percentage |
|---|---|---|---|
| A | 6189 | 57 | 0.920989% |
| B | 6218 | 50 | 0.804117% |
| C | 6231 | 21 | 0.337025% |
| D | 6195 | 36 | 0.581114% |
Noise dominated data is calculated using 1-second bins in cleaned event files. If a bin has >2000 counts, and if more than 50% of those come from <1% of pixels, then it is considered to be noise-dominated and hence unusable.
| Quadrant | # 1 sec bins | Bins with >0 counts | Bins with >2000 counts | High rate bins dominated by noise | Noise dominated (total time) | Noise dominated (detector-on time) | Marked lightcurve |
|---|---|---|---|---|---|---|---|
| A | 8770 | 6439 | 12 | 12 | 0.14% | 0.19% | 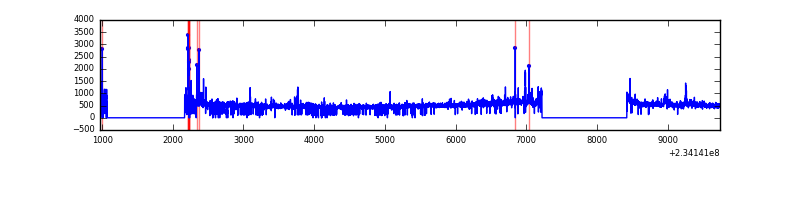 |
| B | 8770 | 6451 | 7 | 7 | 0.08% | 0.11% | 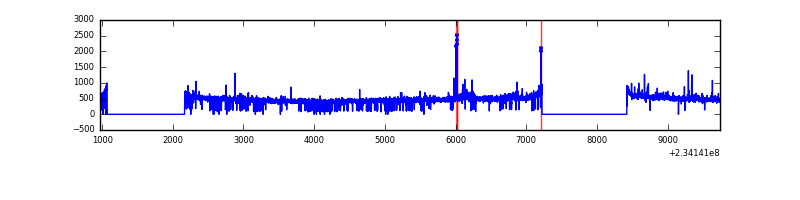 |
| C | 8770 | 6451 | 0 | 0 | 0.00% | 0.00% | 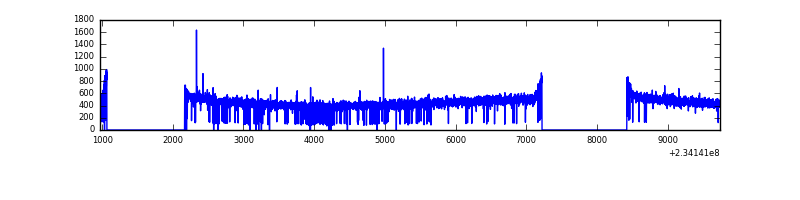 |
| D | 8770 | 6443 | 23 | 23 | 0.26% | 0.36% | 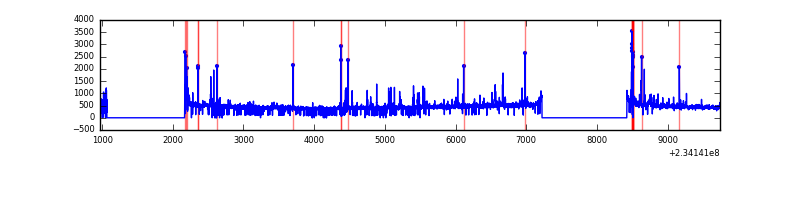 |
Top three noisy pixels from each quadrant. If the there are fewer than three noisy pixels in the level2.evt file, extra rows are filled as -1
| Pixel properties | Quadrant properties | ||||||
|---|---|---|---|---|---|---|---|
| Quadrant | DetID | PixID | Counts | Sigma | Mean | Median | Sigma |
| A | 8 | 5 | 261168 | 1739.28 | 743 | 727 | 149.7 |
| A | 1 | 162 | 88833 | 588.39 | 743 | 727 | 149.7 |
| A | 4 | 2 | 42019 | 275.76 | 743 | 727 | 149.7 |
| B | 0 | 214 | 70766 | 490.57 | 755 | 738 | 142.7 |
| B | 0 | 219 | 19155 | 129.02 | 755 | 738 | 142.7 |
| B | 12 | 111 | 15508 | 103.47 | 755 | 738 | 142.7 |
| C | 13 | 61 | 5606 | 28.92 | 729 | 732 | 168.6 |
| C | 12 | 4 | 4793 | 24.09 | 729 | 732 | 168.6 |
| C | 8 | 222 | 2128 | 8.28 | 729 | 732 | 168.6 |
| D | 13 | 104 | 63192 | 329.64 | 712 | 696 | 189.6 |
| D | 8 | 195 | 59204 | 308.61 | 712 | 696 | 189.6 |
| D | 2 | 14 | 48661 | 253.0 | 712 | 696 | 189.6 |
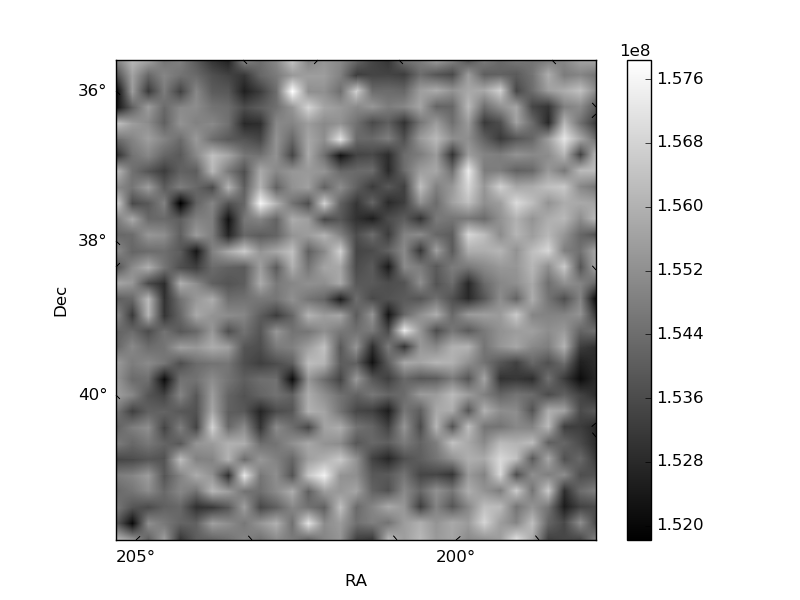
Histogram calculated using DETX and DETY for each event in the final _common_clean file
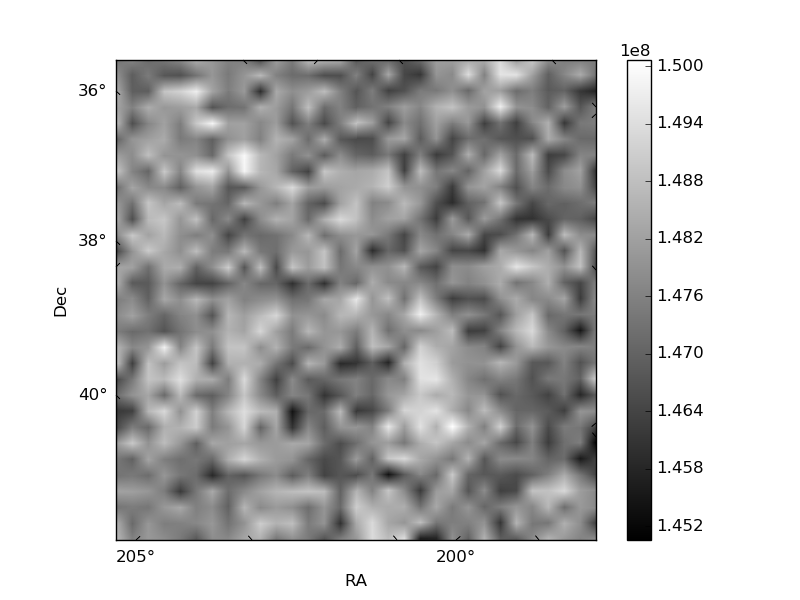
| Quadrant A | 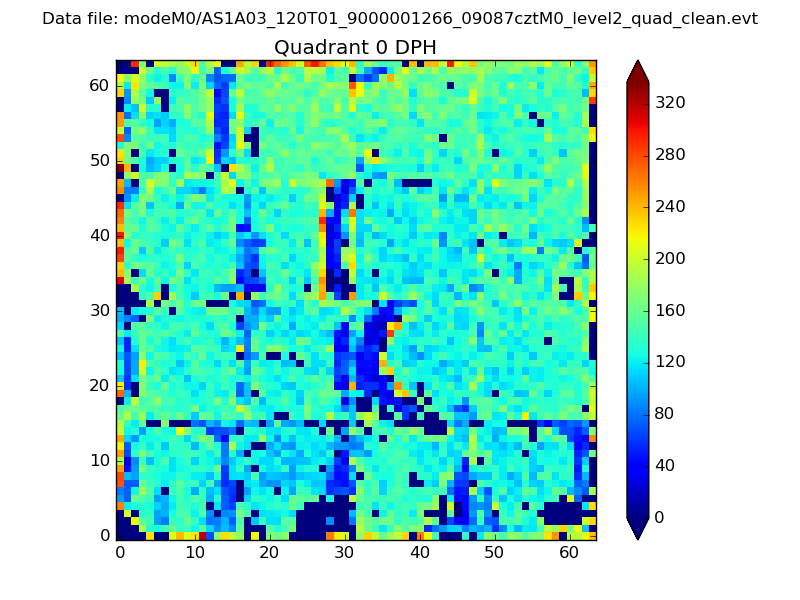 |
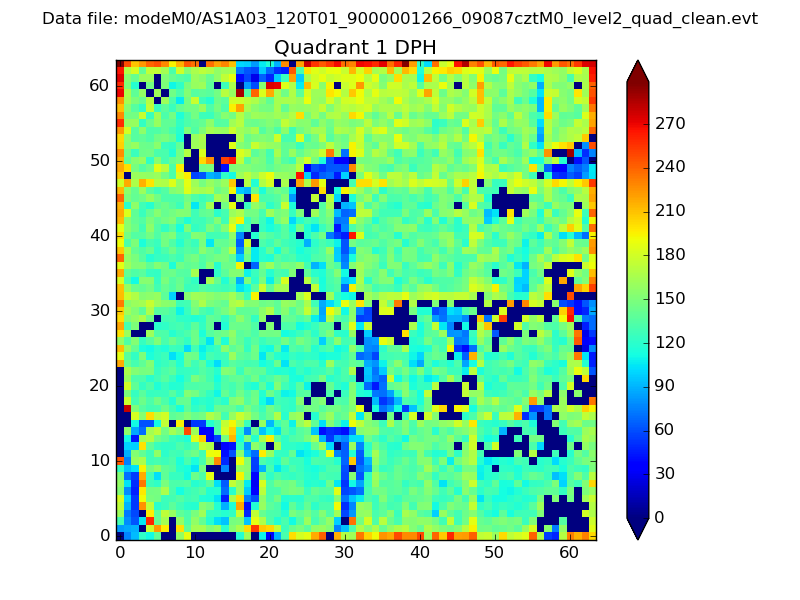 |
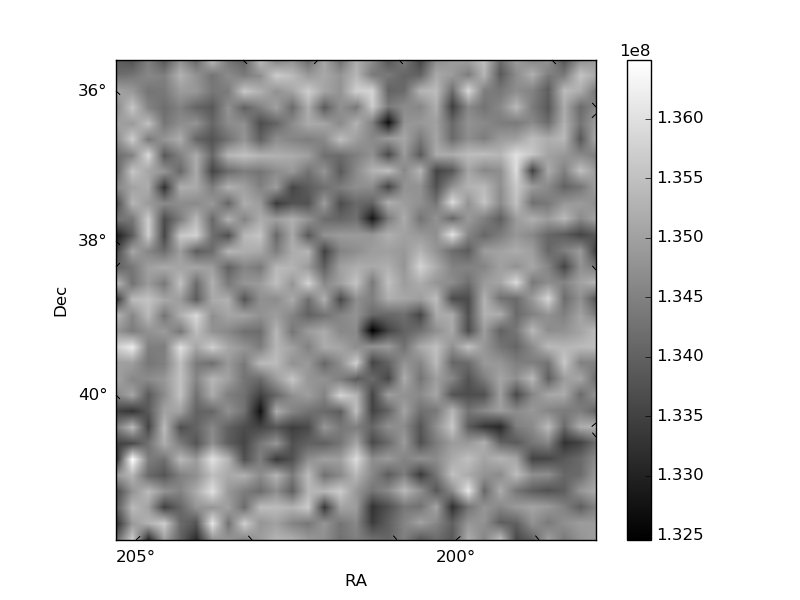
Quadrant B |
|---|---|---|---|
| Quadrant D | 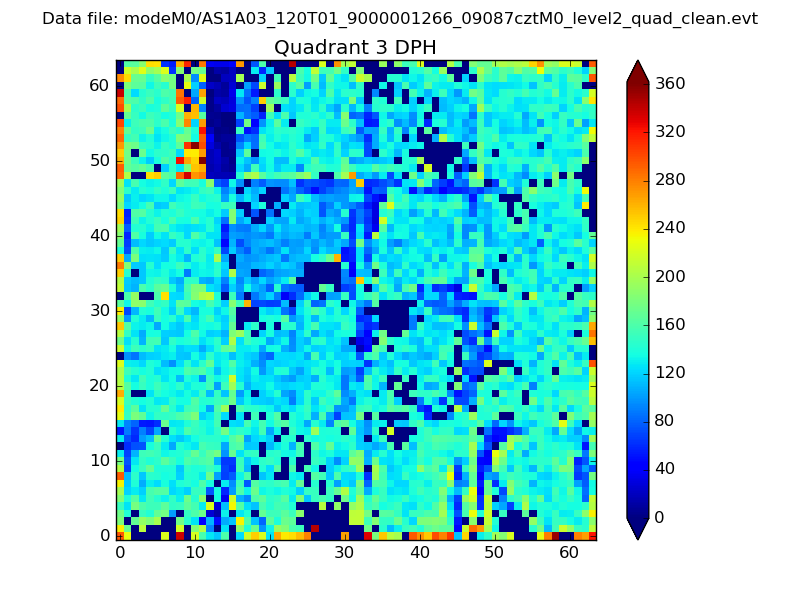 |
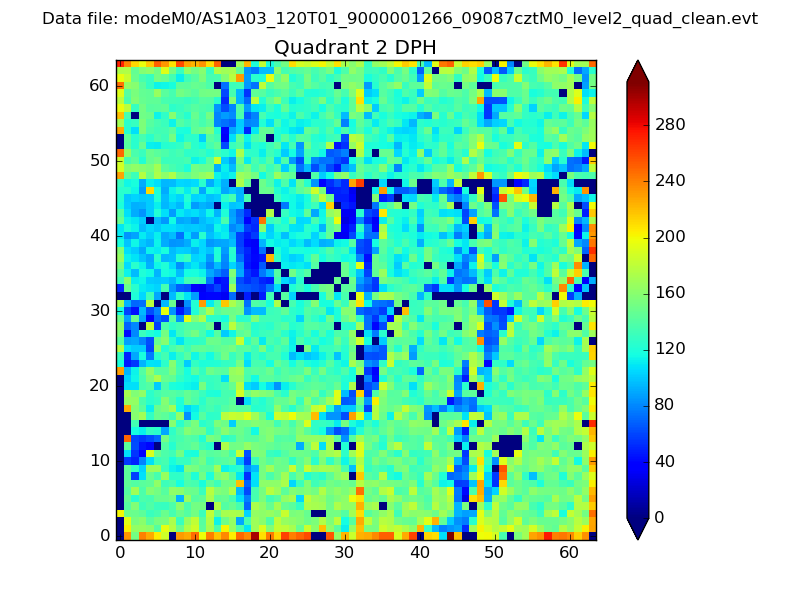 |
Quadrant C |
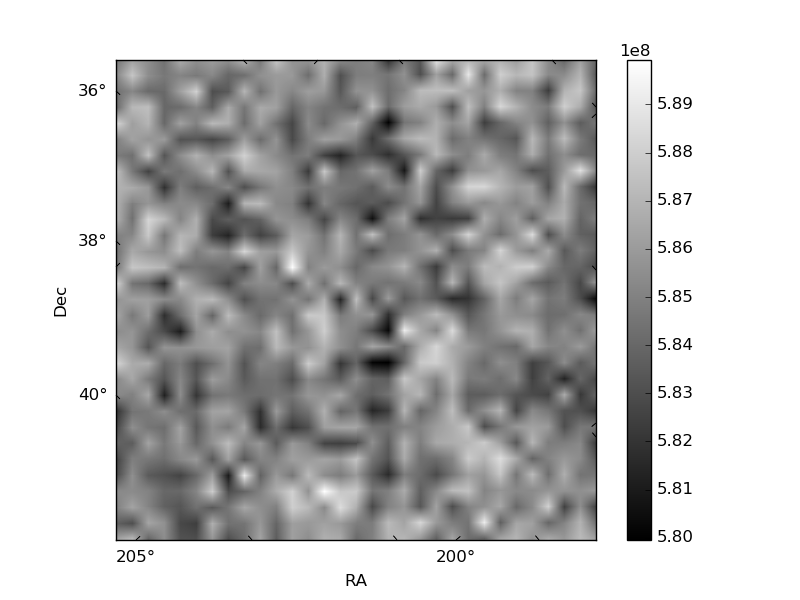
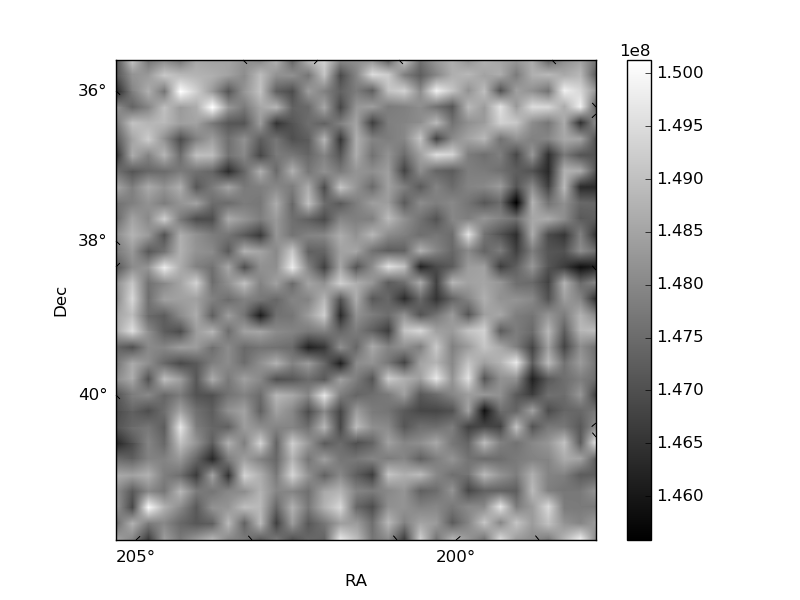
| Plot type | Count rate plots | Images |
|---|---|---|
| Comparison with Poisson distribution Blue bars denote a histogram of data divided into 1 sec bins. Red curve is a Poisson curve with rate = median count rate of data. |
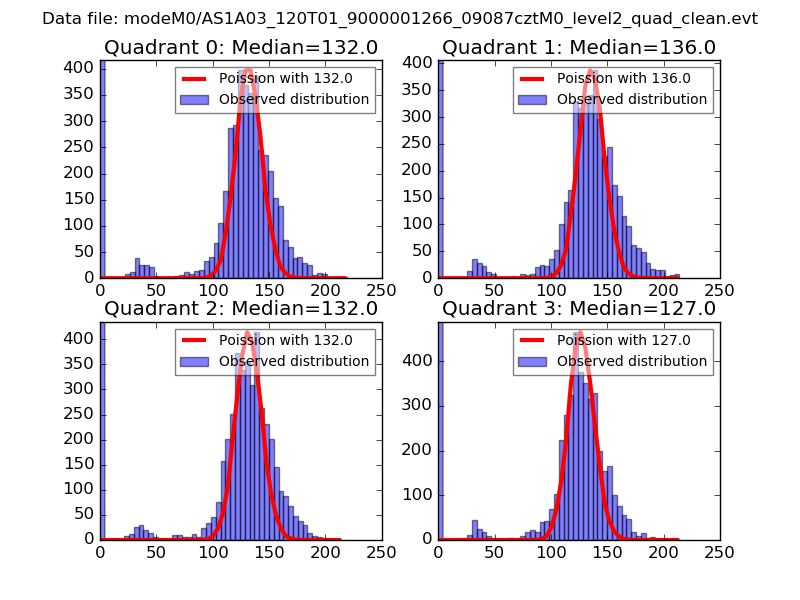 |
 |
| Quadrant-wise count rates Data is divided into 100 sec bins |
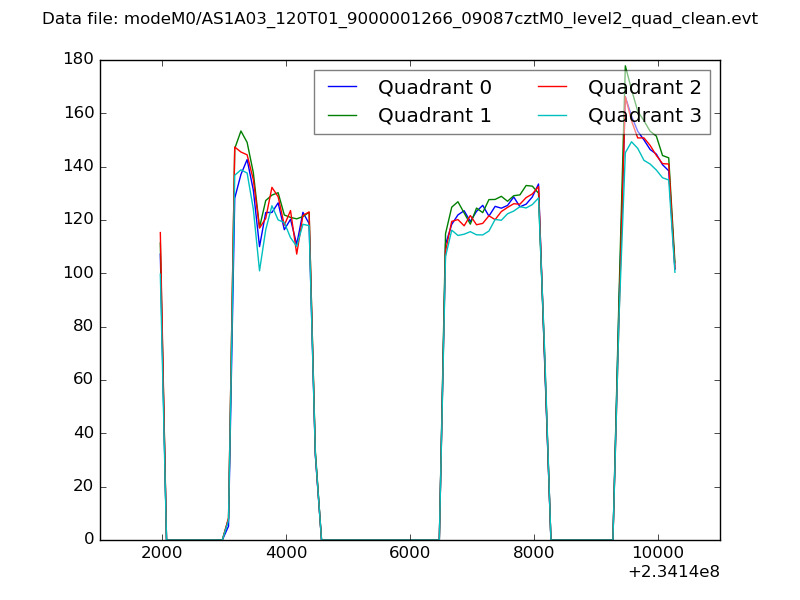 |
|
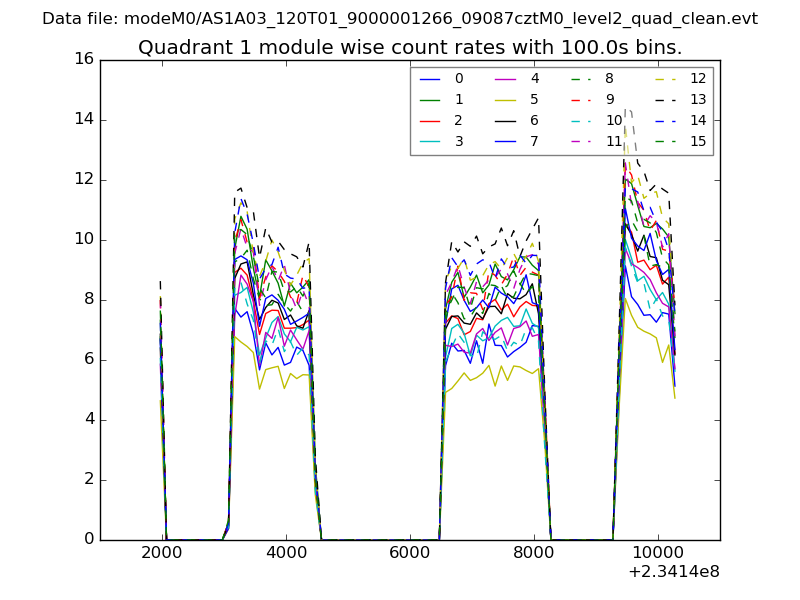
| Module-wise count rates for Quadrant A Data is divided into 100 sec bins |
 |
 |
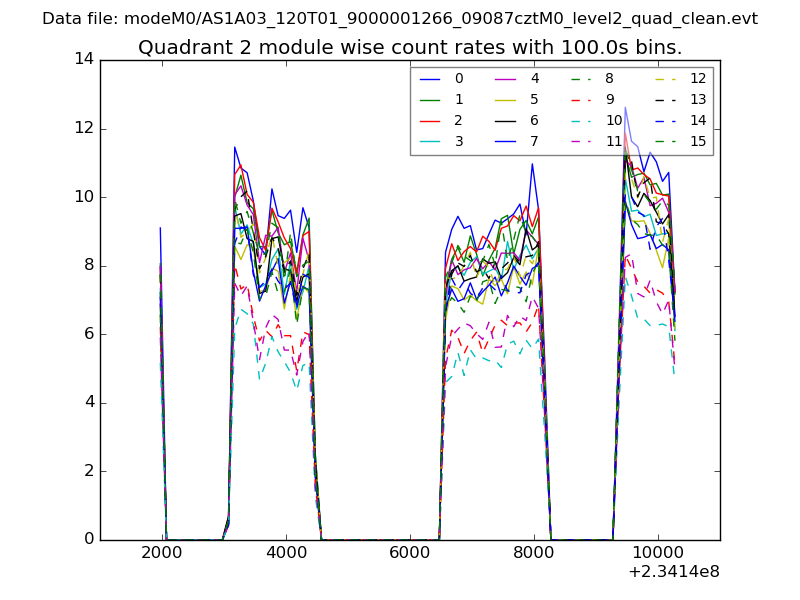
| Module-wise count rates for Quadrant B Data is divided into 100 sec bins |
 |
 |
| Module-wise count rates for Quadrant C Data is divided into 100 sec bins |
 |
 |
| Module-wise count rates for Quadrant D Data is divided into 100 sec bins |
 |
 |
| Parameter | Plot |
|---|---|
| CZT HV Monitor | 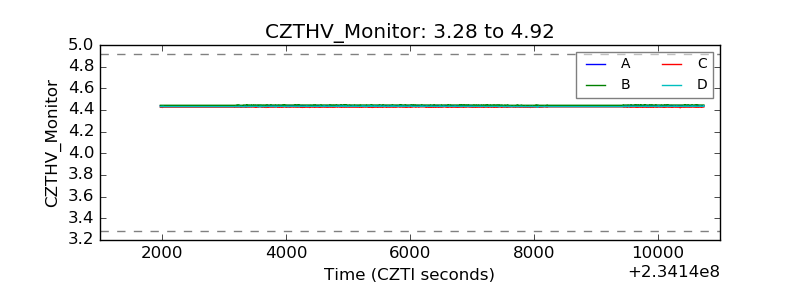 |
| D_VDD | 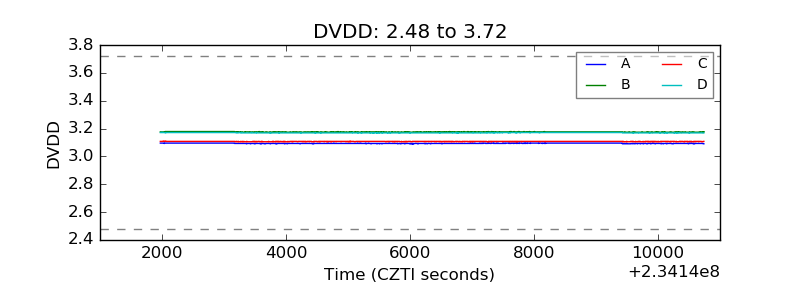 |
| Temperature 1 | 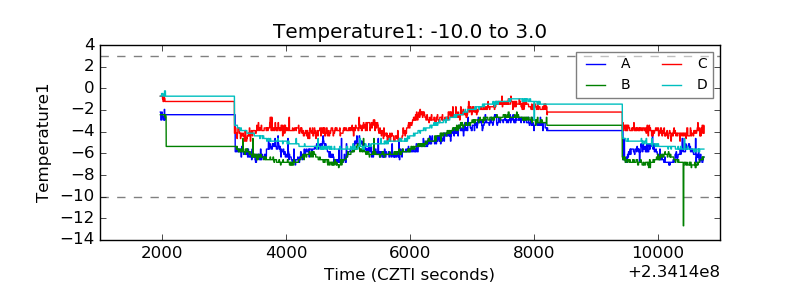 |
| Veto HV Monitor | 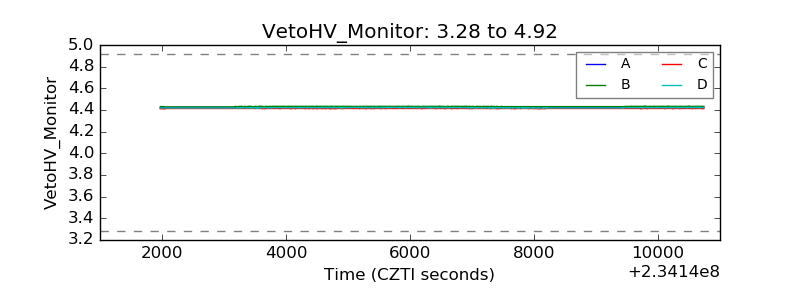 |
| Veto LLD | 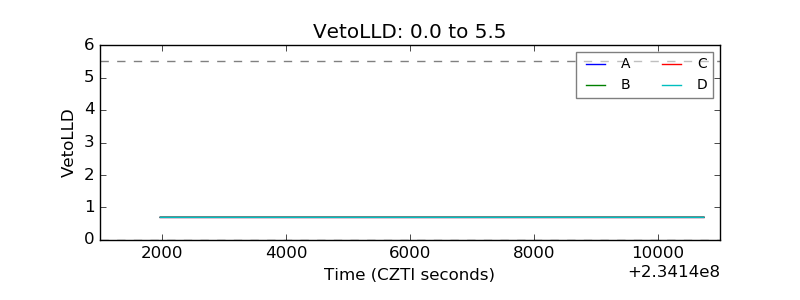 |
| Alpha Counter | 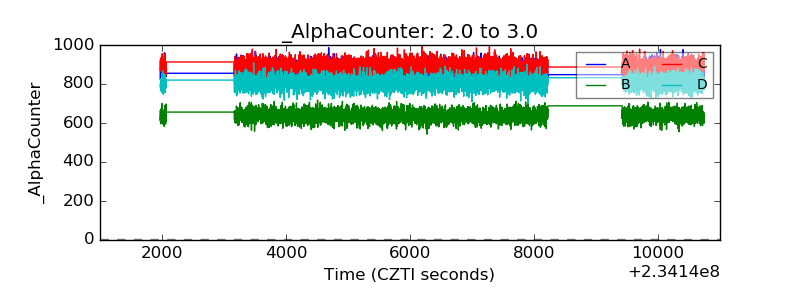 |
| _CPM_Rate | 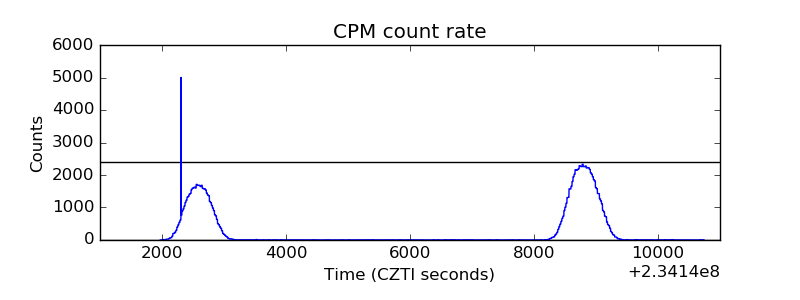 |
| CZT Counter | 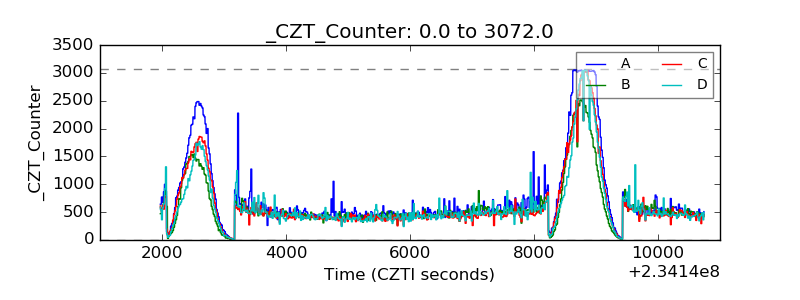 |
| +2.5 Volts monitor | 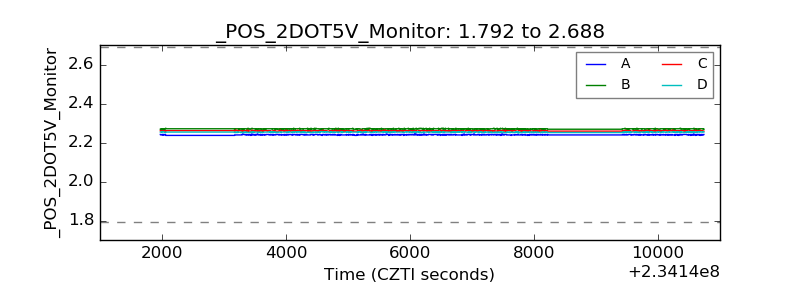 |
| +5 Volts monitor |  |
| _ROLL_ROT |  |
| _Roll_DEC | 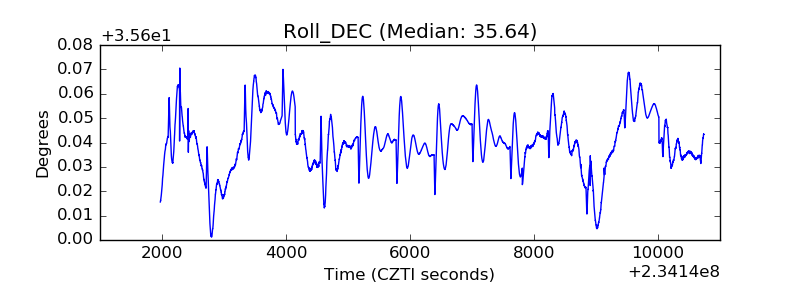 |
| _Roll_RA | 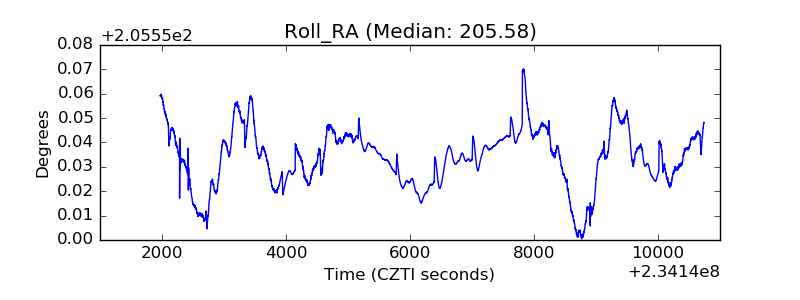 |
| Veto Counter | 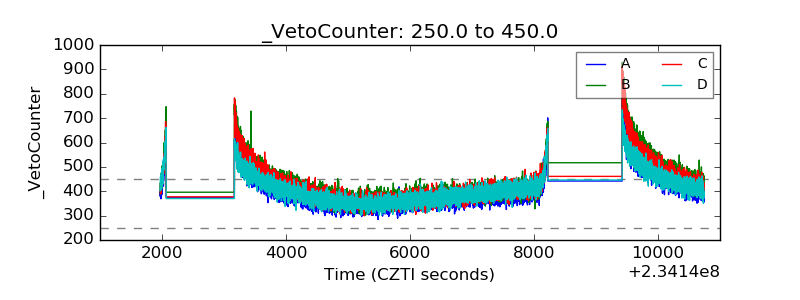 |