| Param | Original file | Final file |
|---|---|---|
| Filename | modeM0/AS1A03_120T01_9000001266_09088cztM0_level2.evt | modeM0/AS1A03_120T01_9000001266_09088cztM0_level2_quad_clean.evt |
| Size (bytes) | 454,541,760 | 76,478,400 |
| Size | 433.5 MB | 72.9 MB |
| Events in quadrant A | 3,288,430 | 478,063 |
| Events in quadrant B | 3,100,642 | 496,722 |
| Events in quadrant C | 2,892,999 | 476,138 |
| Events in quadrant D | 4,068,136 | 437,774 |
| Mode M9 | |||
|---|---|---|---|
| Quadrant | BADHDUFLAG | Total packets | Discarded packets |
| A | 0 | 22 | 0 |
| B | 0 | 22 | 0 |
| C | 0 | 22 | 0 |
| D | 0 | 23 | 0 |
| Mode M0 | |||
|---|---|---|---|
| Quadrant | BADHDUFLAG | Total packets | Discarded packets |
| A | 0 | 13522 | 119 |
| B | 0 | 13080 | 91 |
| C | 0 | 12656 | 76 |
| D | 0 | 16399 | 178 |
| Mode SS | |||
|---|---|---|---|
| Quadrant | BADHDUFLAG | Total packets | Discarded packets |
| A | 0 | 124 | 0 |
| B | 0 | 124 | 0 |
| C | 0 | 124 | 0 |
| D | 0 | 124 | 4 |
| Quadrant | Total seconds | Saturated seconds | Saturation percentage |
|---|---|---|---|
| A | 6119 | 33 | 0.539304% |
| B | 6126 | 29 | 0.473392% |
| C | 6133 | 8 | 0.130442% |
| D | 6107 | 341 | 5.583756% |
Noise dominated data is calculated using 1-second bins in cleaned event files. If a bin has >2000 counts, and if more than 50% of those come from <1% of pixels, then it is considered to be noise-dominated and hence unusable.
| Quadrant | # 1 sec bins | Bins with >0 counts | Bins with >2000 counts | High rate bins dominated by noise | Noise dominated (total time) | Noise dominated (detector-on time) | Marked lightcurve |
|---|---|---|---|---|---|---|---|
| A | 7470 | 6169 | 4 | 4 | 0.05% | 0.06% | 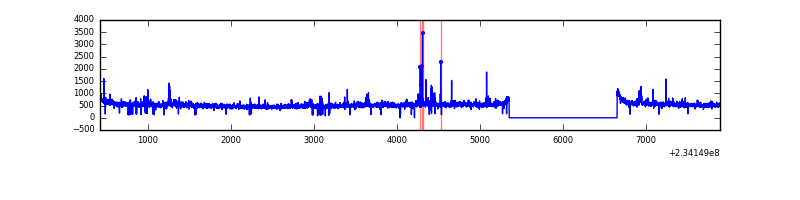 |
| B | 7470 | 6171 | 0 | 0 | 0.00% | 0.00% | 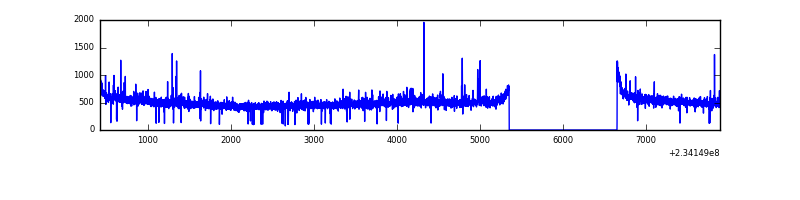 |
| C | 7470 | 6170 | 0 | 0 | 0.00% | 0.00% | 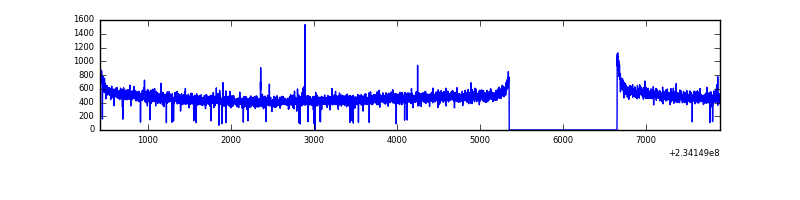 |
| D | 7470 | 6166 | 313 | 313 | 4.19% | 5.08% | 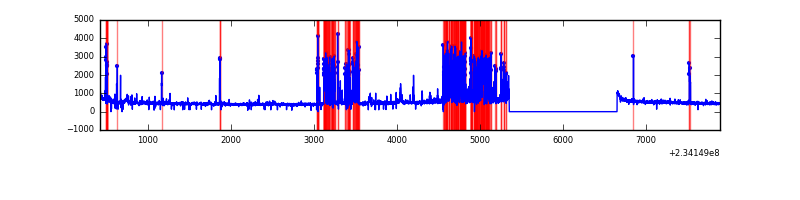 |
Top three noisy pixels from each quadrant. If the there are fewer than three noisy pixels in the level2.evt file, extra rows are filled as -1
| Pixel properties | Quadrant properties | ||||||
|---|---|---|---|---|---|---|---|
| Quadrant | DetID | PixID | Counts | Sigma | Mean | Median | Sigma |
| A | 8 | 5 | 193711 | 1257.95 | 763 | 749 | 153.4 |
| A | 1 | 162 | 69031 | 445.14 | 763 | 749 | 153.4 |
| A | 5 | 16 | 33984 | 216.66 | 763 | 749 | 153.4 |
| B | 0 | 214 | 47248 | 321.96 | 772 | 757 | 144.4 |
| B | 12 | 111 | 15592 | 102.73 | 772 | 757 | 144.4 |
| B | 4 | 48 | 15531 | 102.31 | 772 | 757 | 144.4 |
| C | 14 | 234 | 6489 | 33.57 | 740 | 746 | 171.1 |
| C | 13 | 61 | 5608 | 28.42 | 740 | 746 | 171.1 |
| C | 3 | 202 | 1833 | 6.35 | 740 | 746 | 171.1 |
| D | 1 | 52 | 1115618 | 5974.16 | 712 | 694 | 186.6 |
| D | 8 | 195 | 56675 | 299.97 | 712 | 694 | 186.6 |
| D | 2 | 14 | 50524 | 267.01 | 712 | 694 | 186.6 |
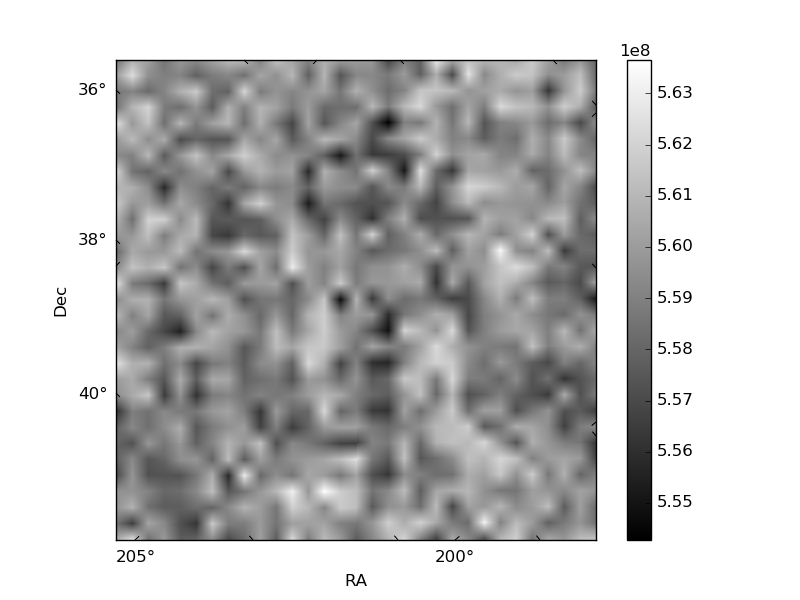
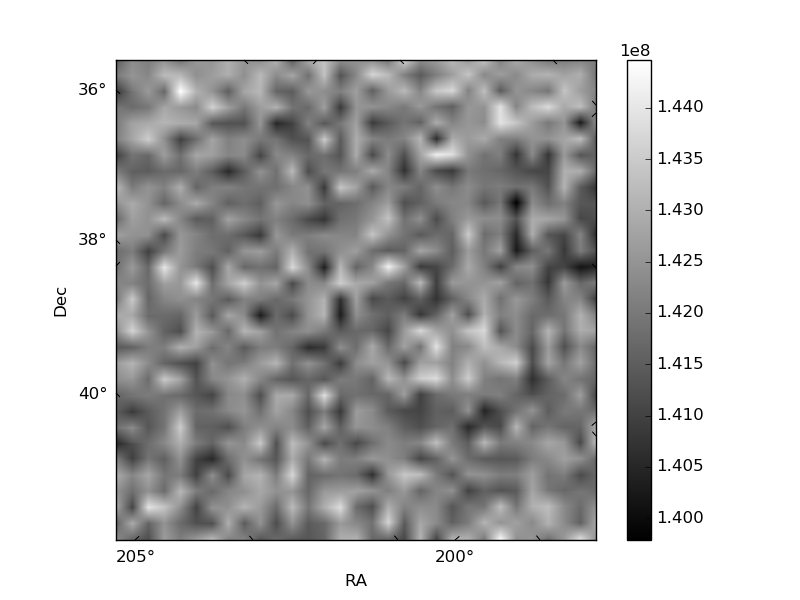
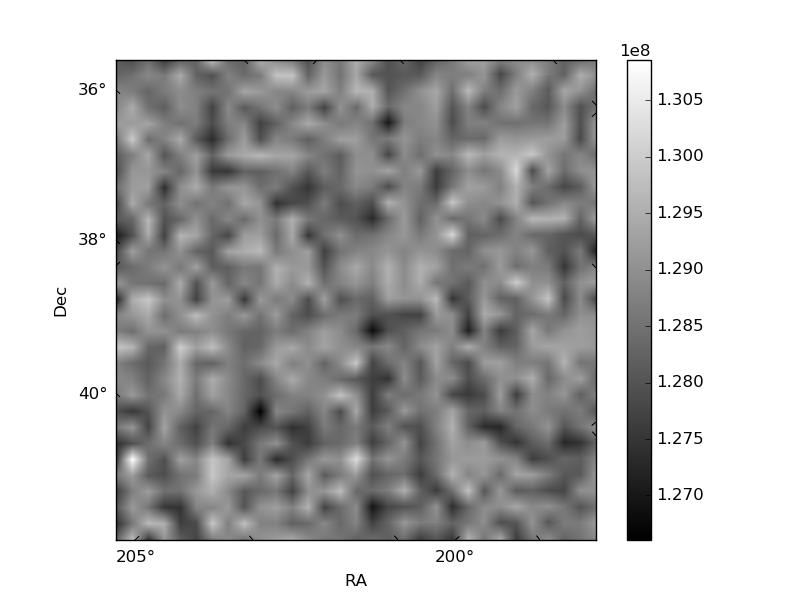
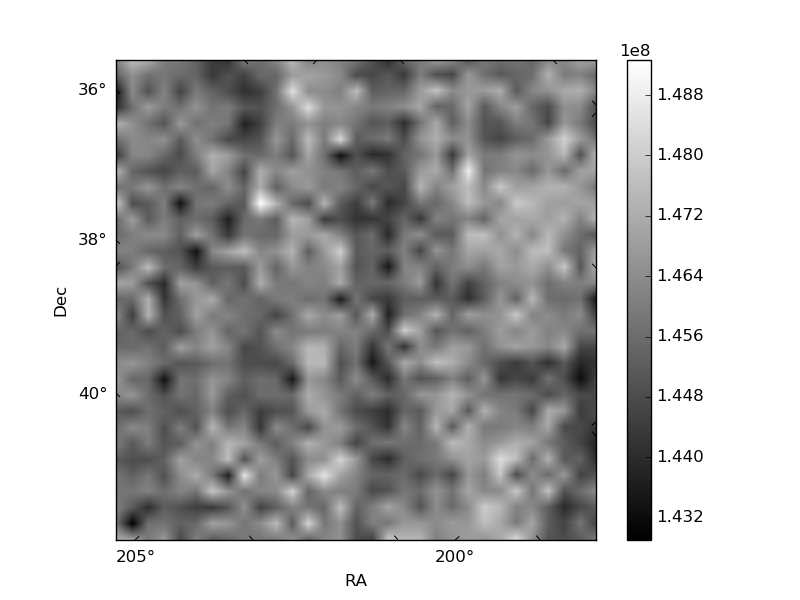
Histogram calculated using DETX and DETY for each event in the final _common_clean file
| Quadrant A | 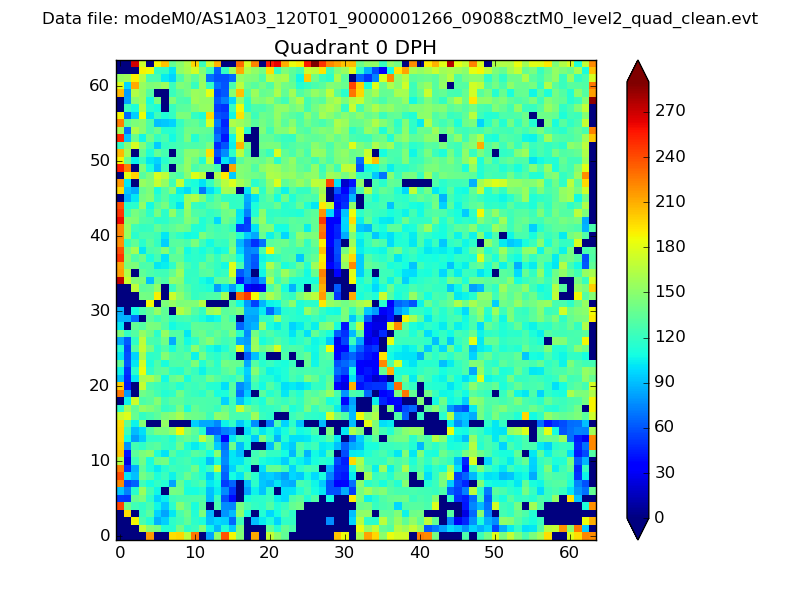 |
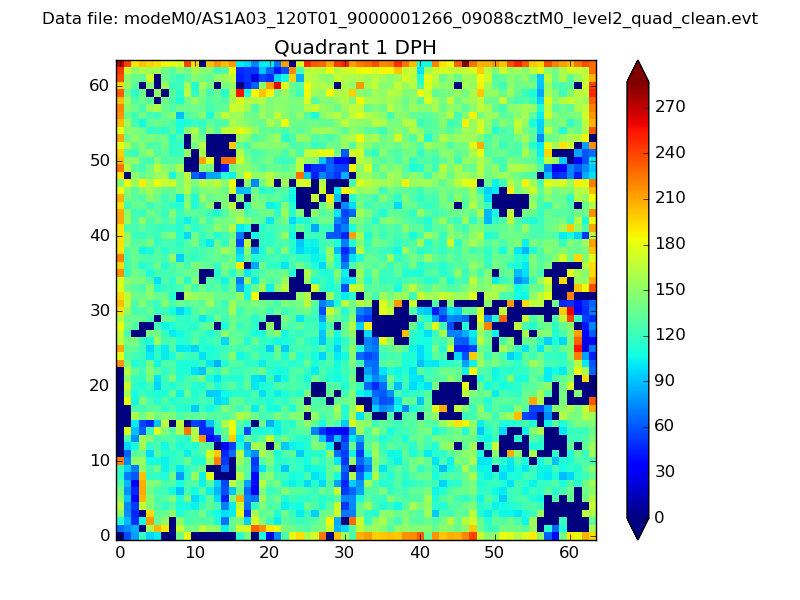 |
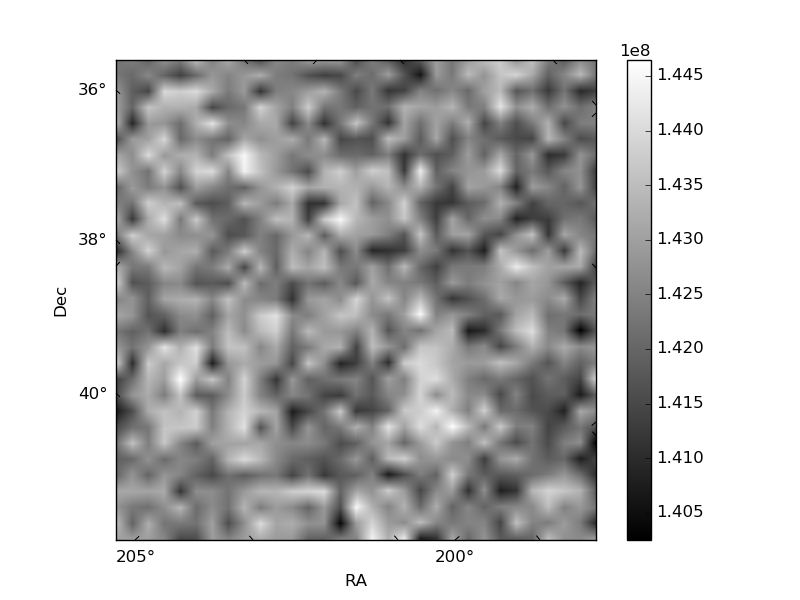
Quadrant B |
|---|---|---|---|
| Quadrant D | 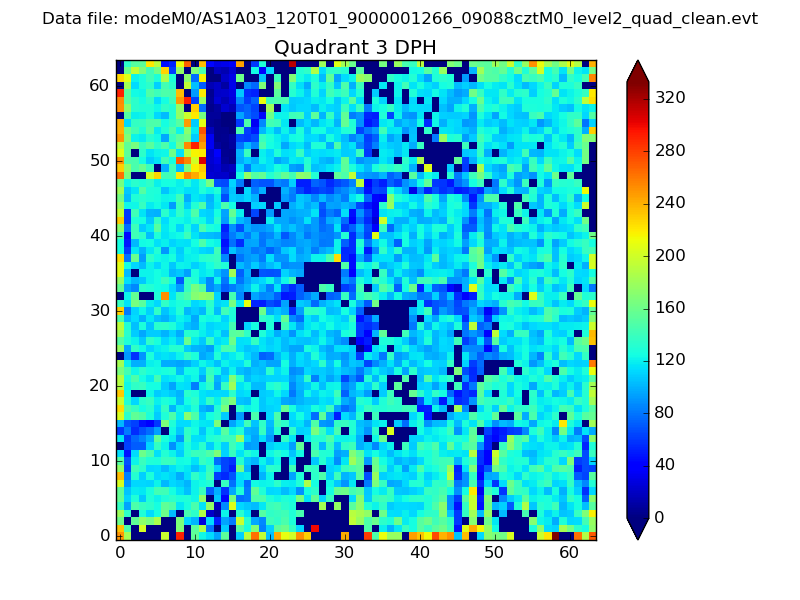 |
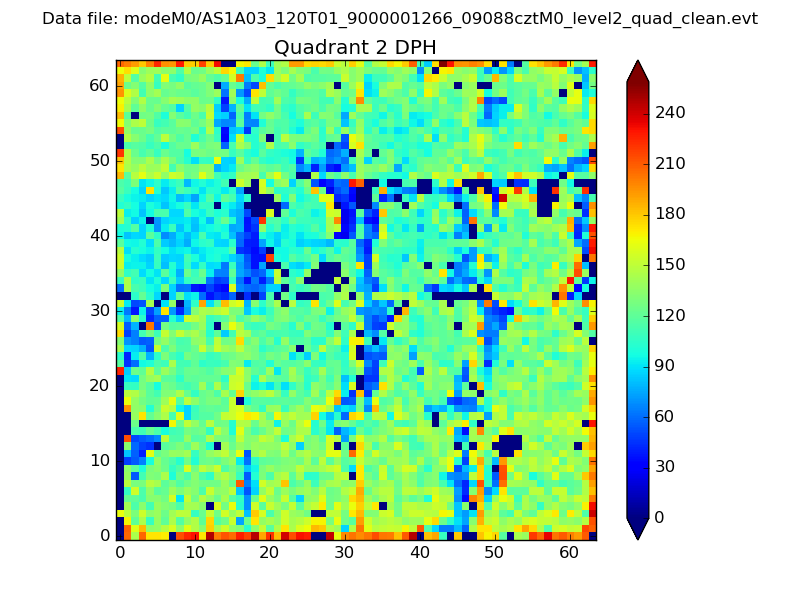 |
Quadrant C |
| Plot type | Count rate plots | Images |
|---|---|---|
| Comparison with Poisson distribution Blue bars denote a histogram of data divided into 1 sec bins. Red curve is a Poisson curve with rate = median count rate of data. |
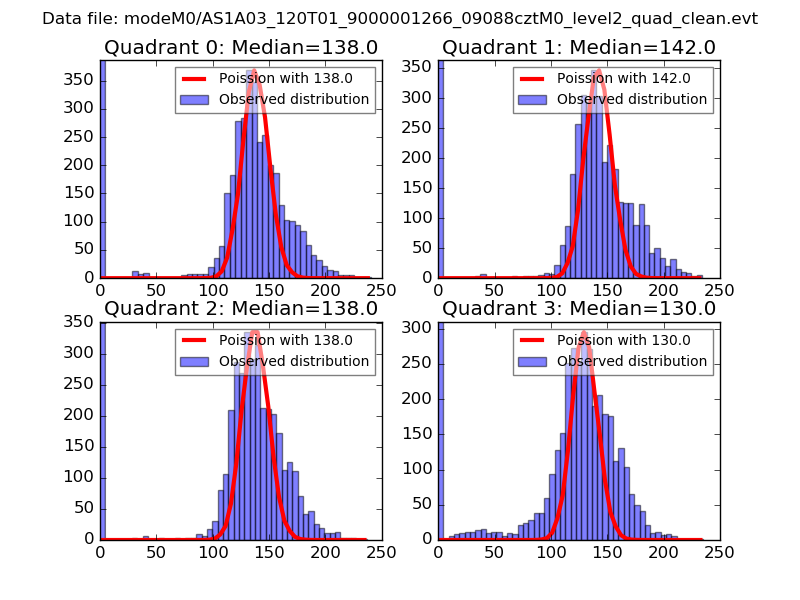 |
 |
| Quadrant-wise count rates Data is divided into 100 sec bins |
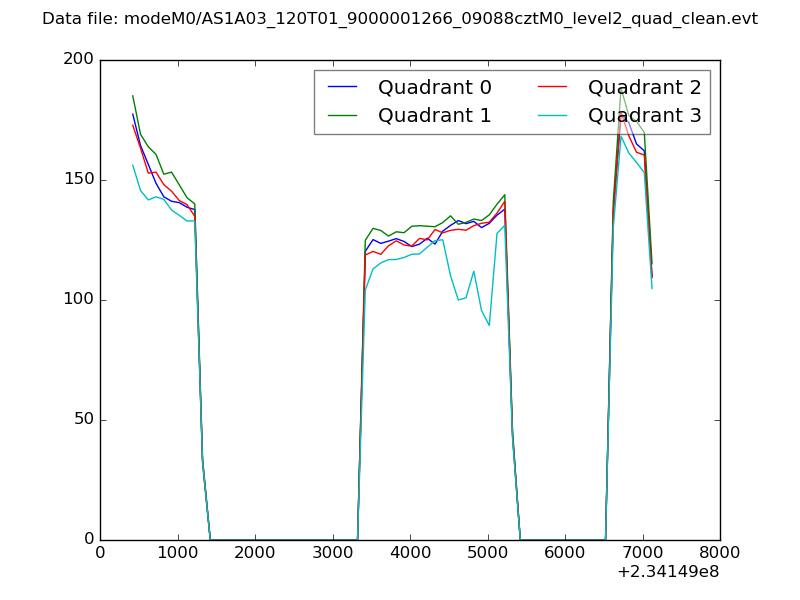 |
|
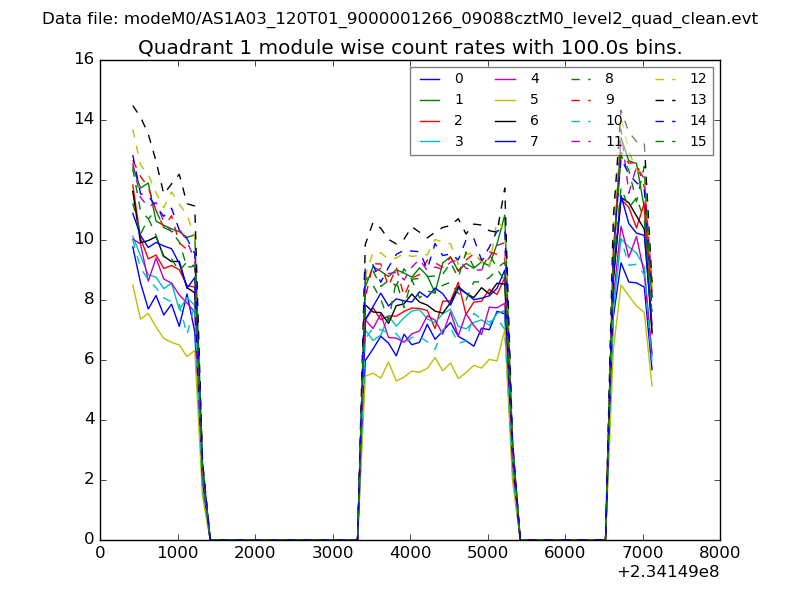
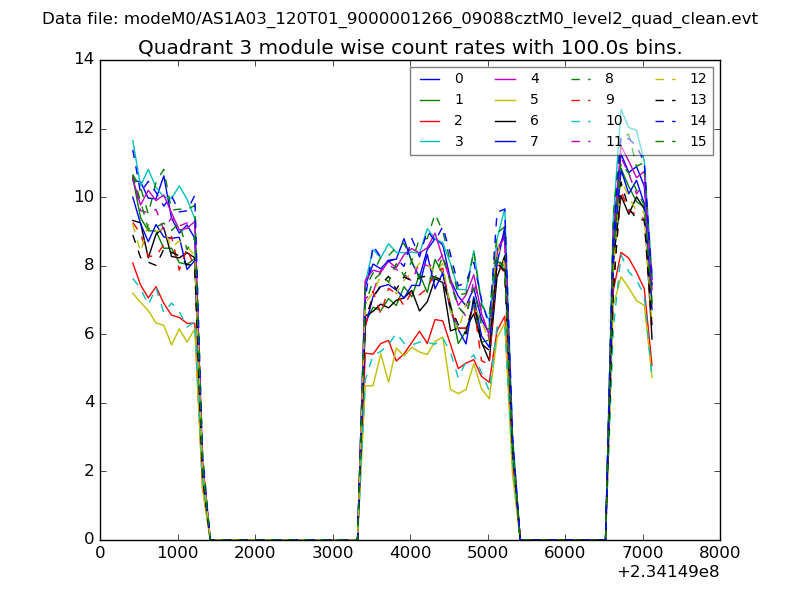
| Module-wise count rates for Quadrant A Data is divided into 100 sec bins |
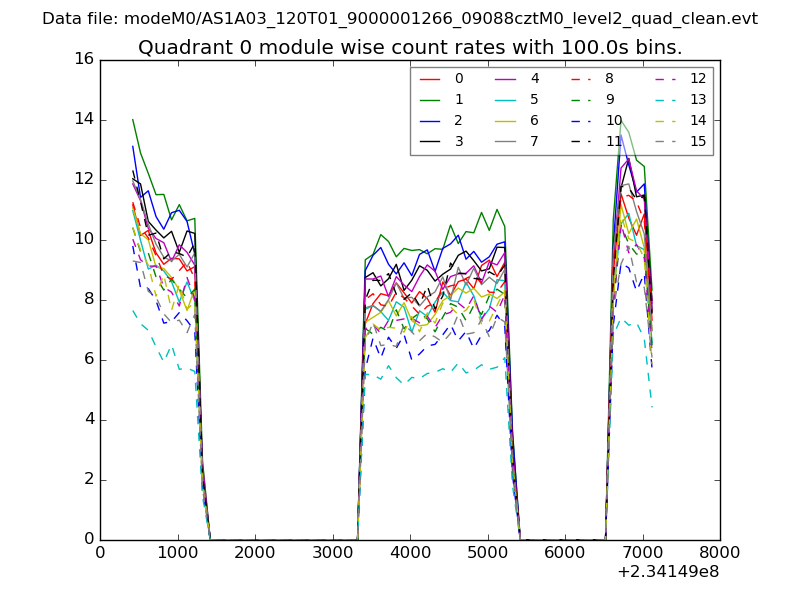 |
 |
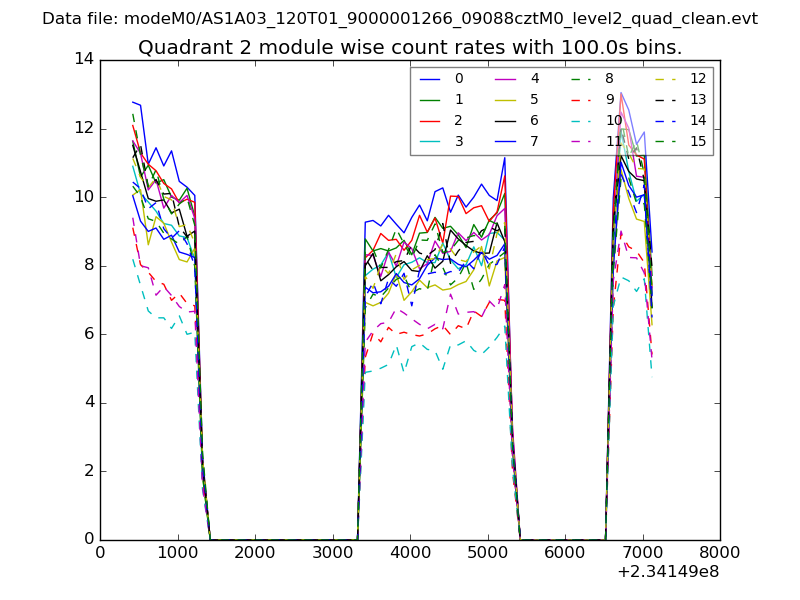
| Module-wise count rates for Quadrant B Data is divided into 100 sec bins |
 |
 |
| Module-wise count rates for Quadrant C Data is divided into 100 sec bins |
 |
 |
| Module-wise count rates for Quadrant D Data is divided into 100 sec bins |
 |
 |
| Parameter | Plot |
|---|---|
| CZT HV Monitor | 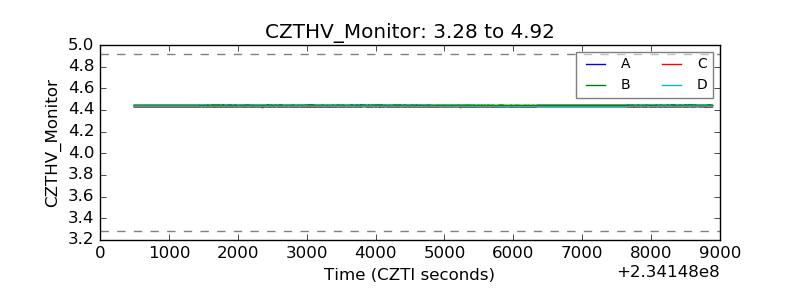 |
| D_VDD | 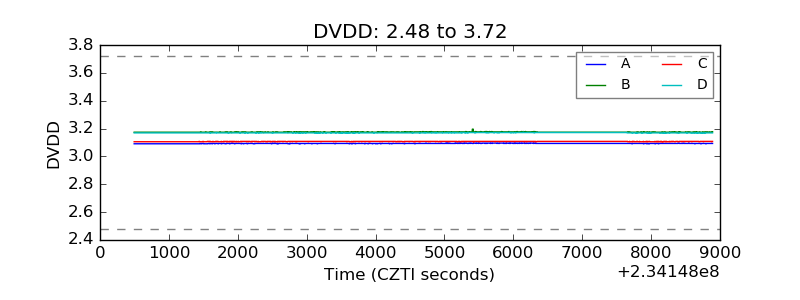 |
| Temperature 1 | 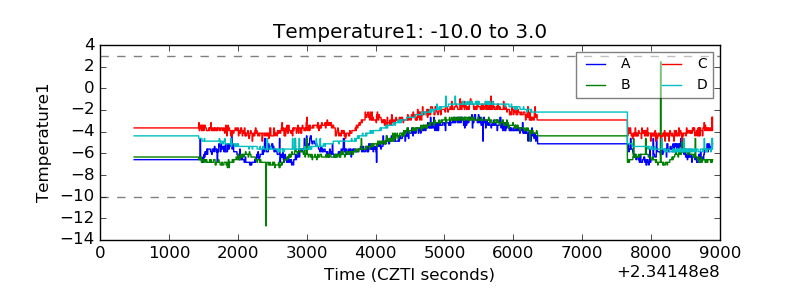 |
| Veto HV Monitor | 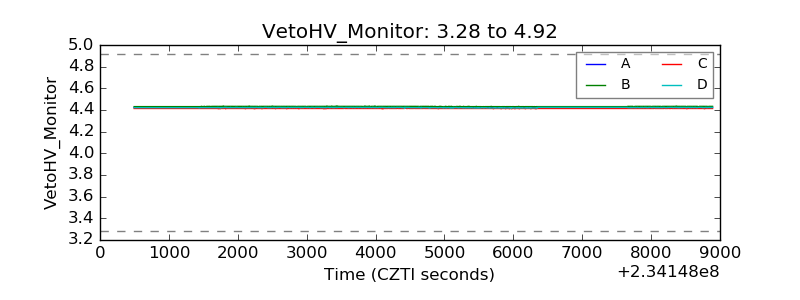 |
| Veto LLD | 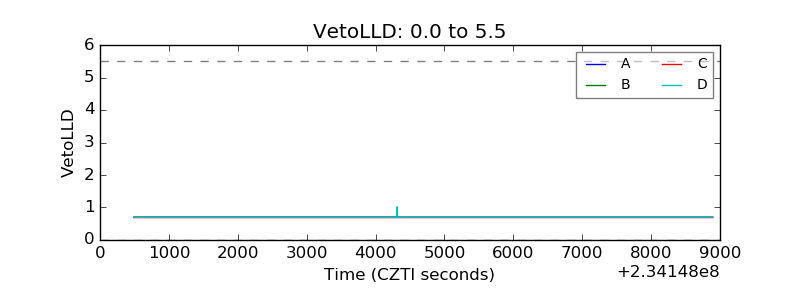 |
| Alpha Counter | 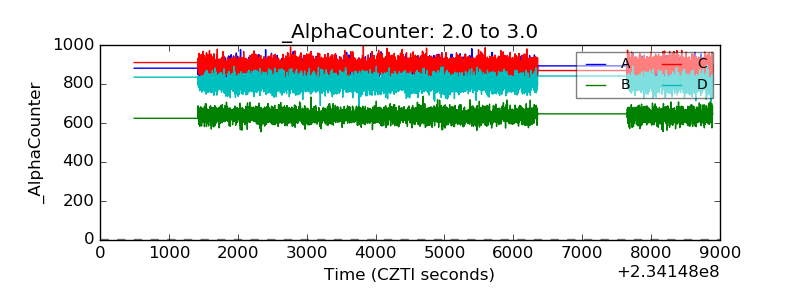 |
| _CPM_Rate | 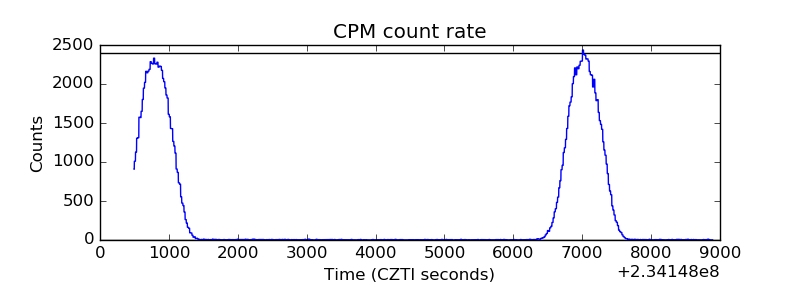 |
| CZT Counter | 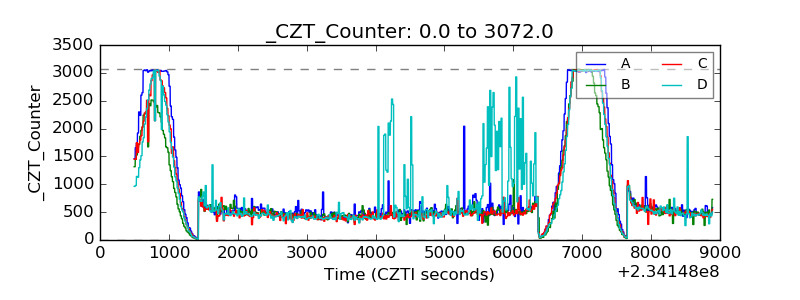 |
| +2.5 Volts monitor |  |
| +5 Volts monitor |  |
| _ROLL_ROT | 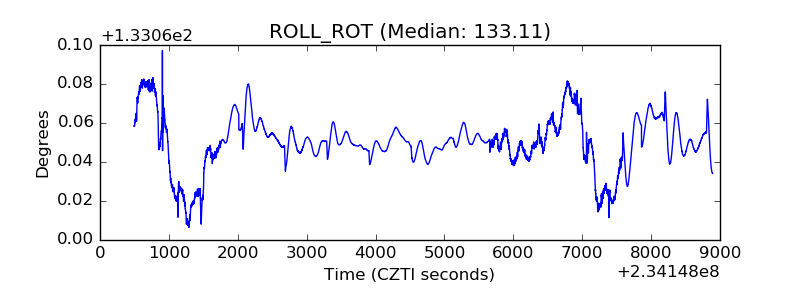 |
| _Roll_DEC | 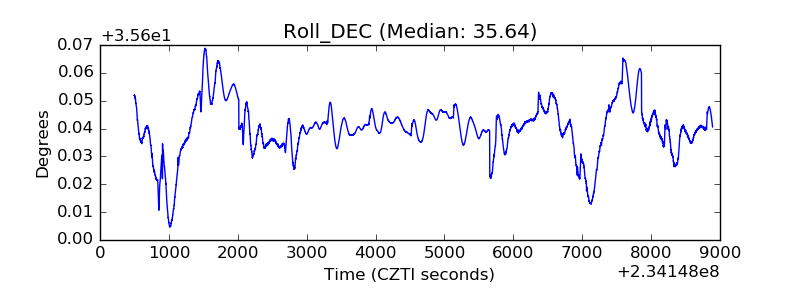 |
| _Roll_RA | 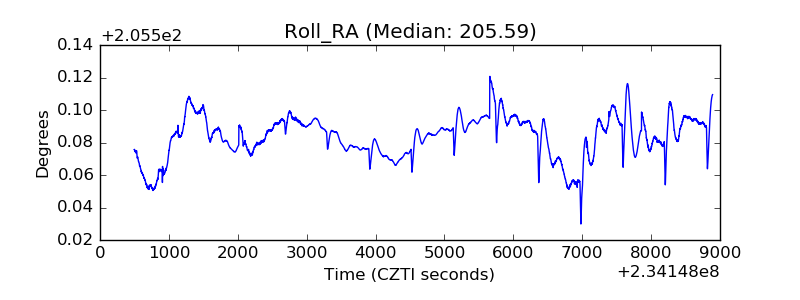 |
| Veto Counter | 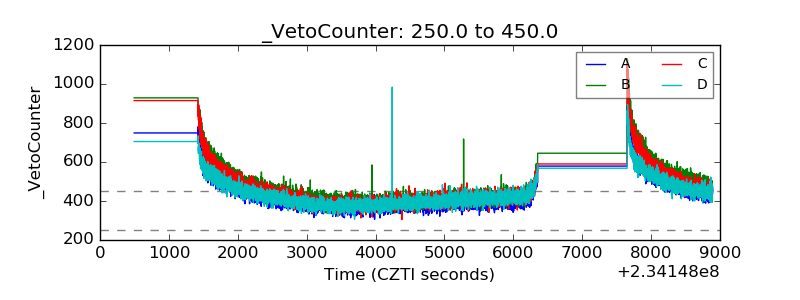 |