| Param | Original file | Final file |
|---|---|---|
| Filename | modeM0/AS1A03_120T01_9000001266_09089cztM0_level2.evt | modeM0/AS1A03_120T01_9000001266_09089cztM0_level2_quad_clean.evt |
| Size (bytes) | 453,395,520 | 69,744,960 |
| Size | 432.4 MB | 66.5 MB |
| Events in quadrant A | 3,545,138 | 421,717 |
| Events in quadrant B | 3,248,208 | 432,090 |
| Events in quadrant C | 3,077,528 | 414,942 |
| Events in quadrant D | 3,428,659 | 399,645 |
| Mode M9 | |||
|---|---|---|---|
| Quadrant | BADHDUFLAG | Total packets | Discarded packets |
| A | 0 | 21 | 0 |
| B | 0 | 21 | 0 |
| C | 0 | 21 | 0 |
| D | 0 | 22 | 0 |
| Mode M0 | |||
|---|---|---|---|
| Quadrant | BADHDUFLAG | Total packets | Discarded packets |
| A | 0 | 14298 | 3 |
| B | 0 | 13487 | 2 |
| C | 0 | 13117 | 2 |
| D | 0 | 14092 | 2 |
| Mode SS | |||
|---|---|---|---|
| Quadrant | BADHDUFLAG | Total packets | Discarded packets |
| A | 0 | 128 | 0 |
| B | 0 | 128 | 0 |
| C | 0 | 128 | 0 |
| D | 0 | 128 | 0 |
| Quadrant | Total seconds | Saturated seconds | Saturation percentage |
|---|---|---|---|
| A | 6355 | 51 | 0.802518% |
| B | 6355 | 55 | 0.865460% |
| C | 6355 | 13 | 0.204563% |
| D | 6355 | 62 | 0.975610% |
Noise dominated data is calculated using 1-second bins in cleaned event files. If a bin has >2000 counts, and if more than 50% of those come from <1% of pixels, then it is considered to be noise-dominated and hence unusable.
| Quadrant | # 1 sec bins | Bins with >0 counts | Bins with >2000 counts | High rate bins dominated by noise | Noise dominated (total time) | Noise dominated (detector-on time) | Marked lightcurve |
|---|---|---|---|---|---|---|---|
| A | 7715 | 6356 | 1 | 1 | 0.01% | 0.02% | 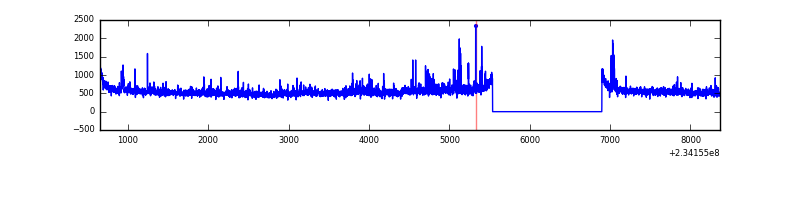 |
| B | 7715 | 6356 | 0 | 0 | 0.00% | 0.00% | 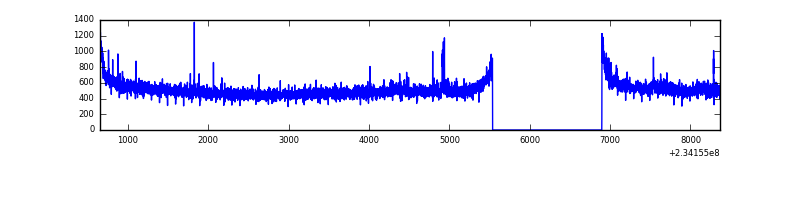 |
| C | 7715 | 6356 | 0 | 0 | 0.00% | 0.00% | 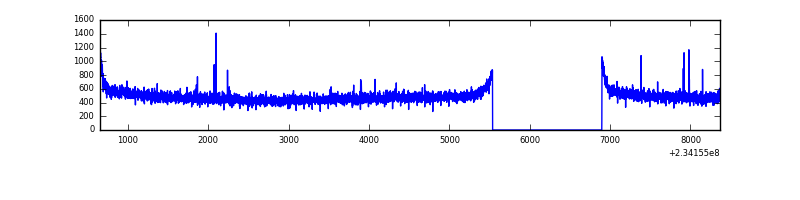 |
| D | 7715 | 6356 | 34 | 34 | 0.44% | 0.53% | 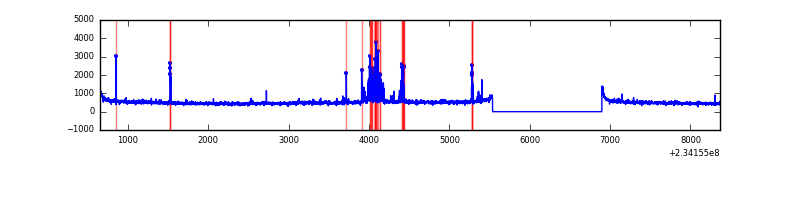 |
Top three noisy pixels from each quadrant. If the there are fewer than three noisy pixels in the level2.evt file, extra rows are filled as -1
| Pixel properties | Quadrant properties | ||||||
|---|---|---|---|---|---|---|---|
| Quadrant | DetID | PixID | Counts | Sigma | Mean | Median | Sigma |
| A | 8 | 5 | 246895 | 1509.07 | 816 | 803 | 163.1 |
| A | 1 | 162 | 79976 | 485.5 | 816 | 803 | 163.1 |
| A | 1 | 178 | 17082 | 99.82 | 816 | 803 | 163.1 |
| B | 0 | 219 | 29262 | 186.49 | 822 | 805 | 152.6 |
| B | 12 | 111 | 16443 | 102.48 | 822 | 805 | 152.6 |
| B | 0 | 214 | 15493 | 96.25 | 822 | 805 | 152.6 |
| C | 14 | 234 | 13625 | 71.83 | 785 | 790 | 178.7 |
| C | 13 | 61 | 5680 | 27.36 | 785 | 790 | 178.7 |
| C | 3 | 254 | 3357 | 14.37 | 785 | 790 | 178.7 |
| D | 1 | 52 | 181341 | 921.95 | 777 | 759 | 195.9 |
| D | 8 | 195 | 170903 | 868.65 | 777 | 759 | 195.9 |
| D | 7 | 71 | 49753 | 250.13 | 777 | 759 | 195.9 |
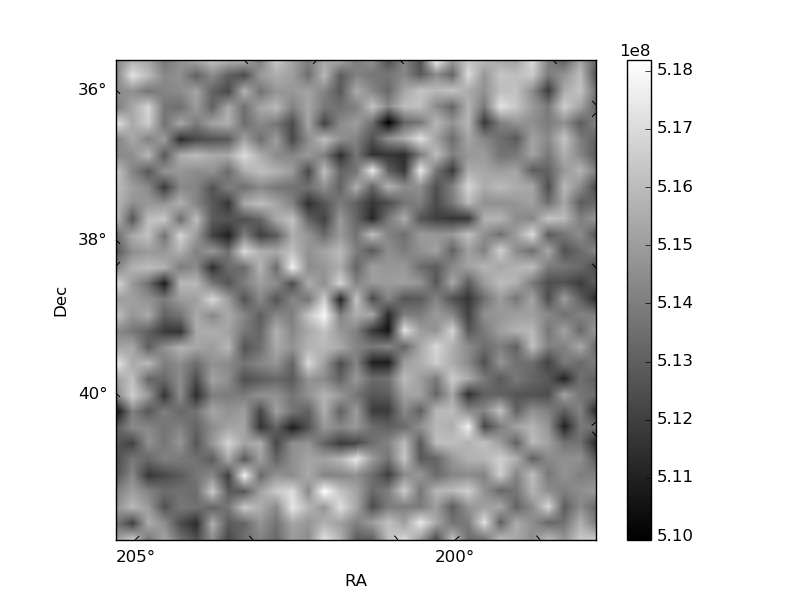
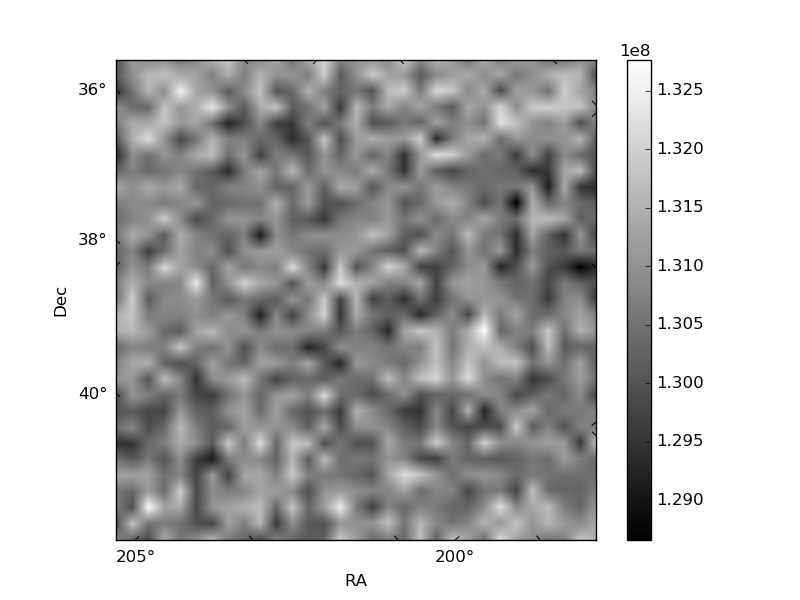
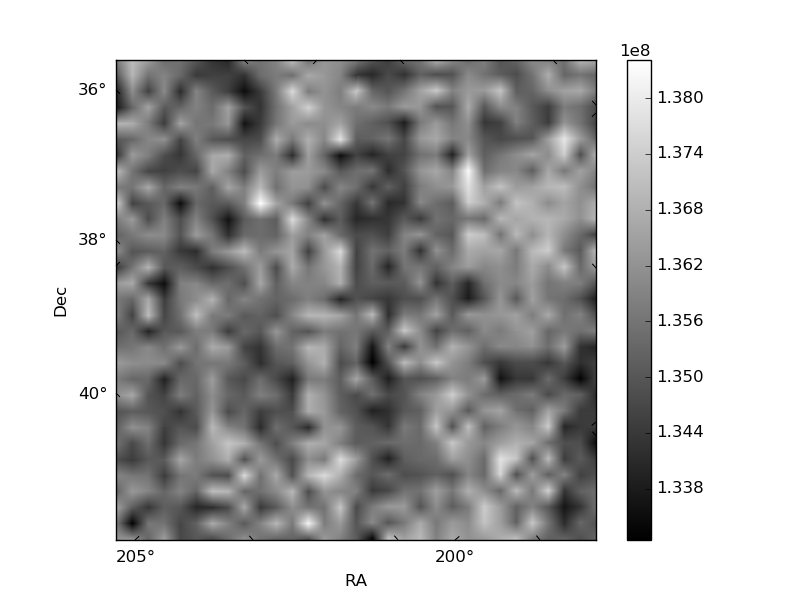
Histogram calculated using DETX and DETY for each event in the final _common_clean file
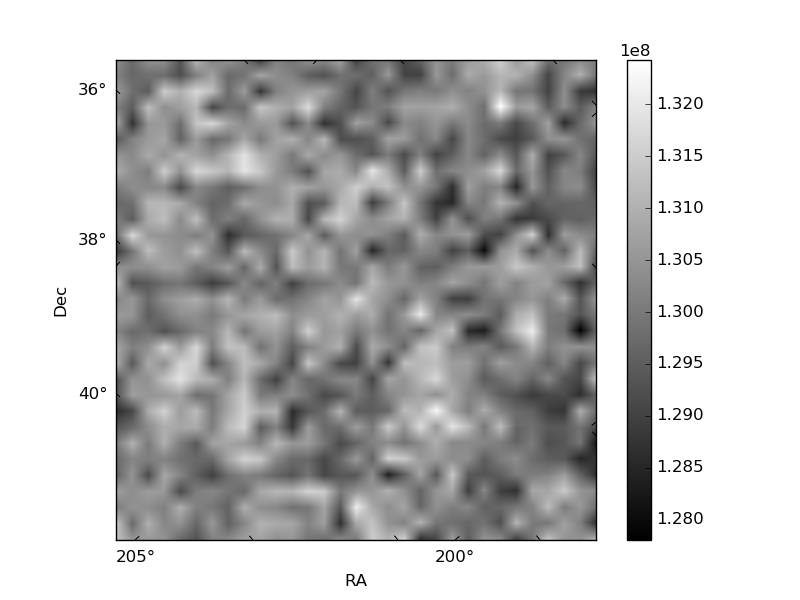
| Quadrant A | 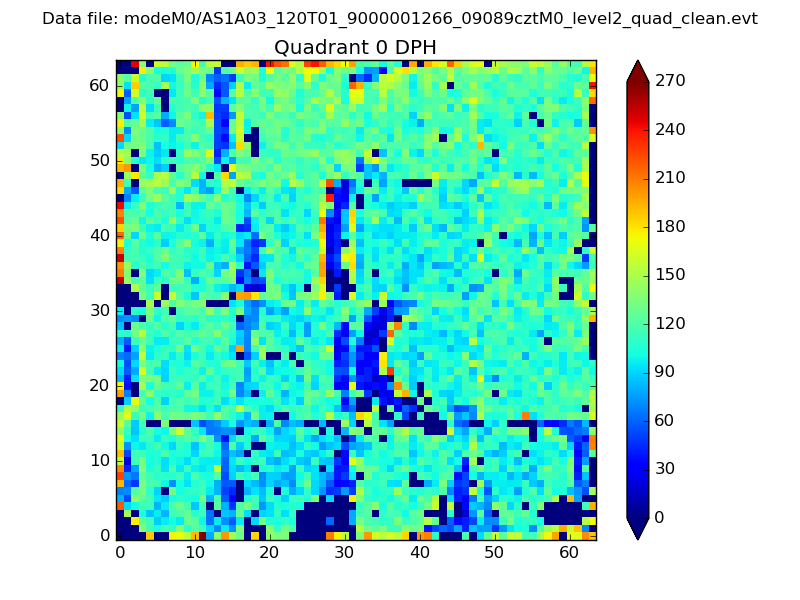 |
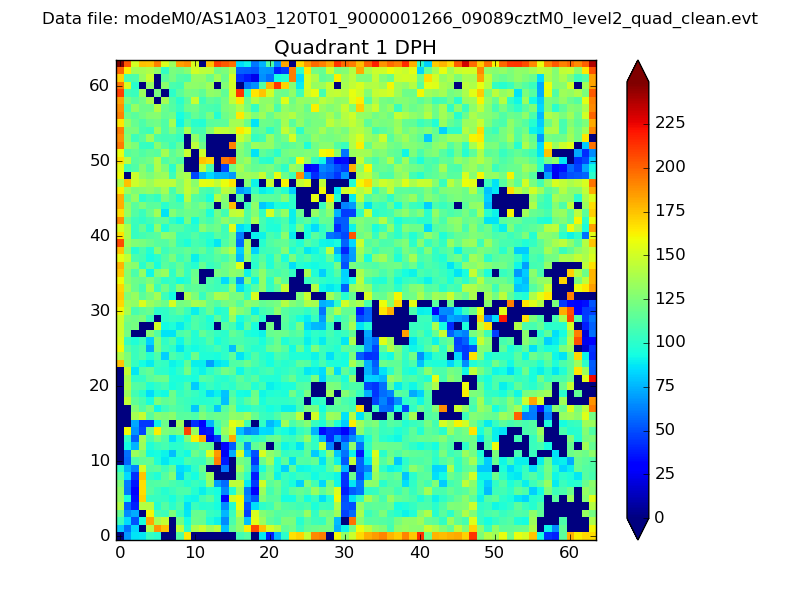 |
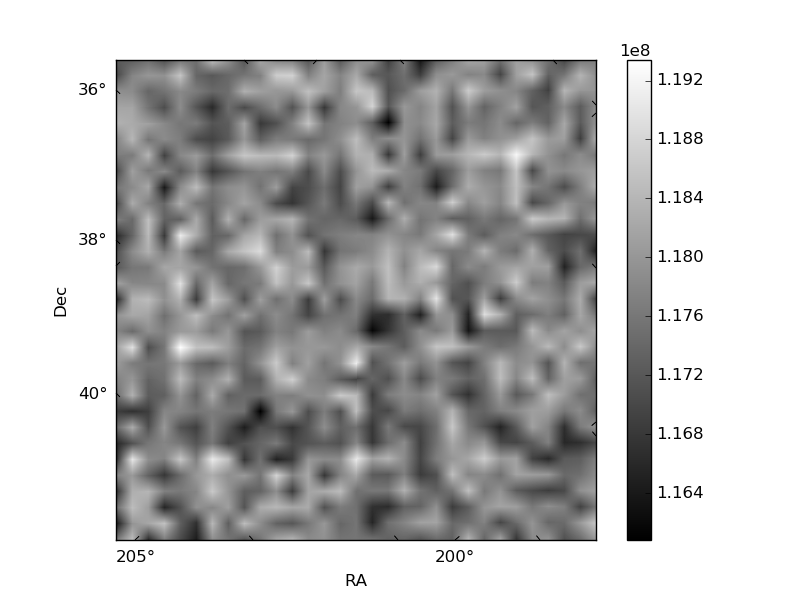
Quadrant B |
|---|---|---|---|
| Quadrant D | 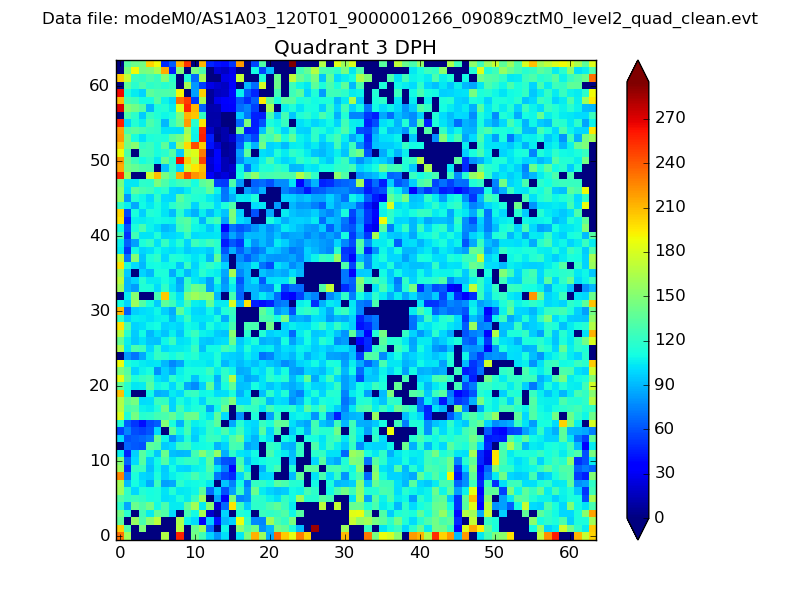 |
 |
Quadrant C |
| Plot type | Count rate plots | Images |
|---|---|---|
| Comparison with Poisson distribution Blue bars denote a histogram of data divided into 1 sec bins. Red curve is a Poisson curve with rate = median count rate of data. |
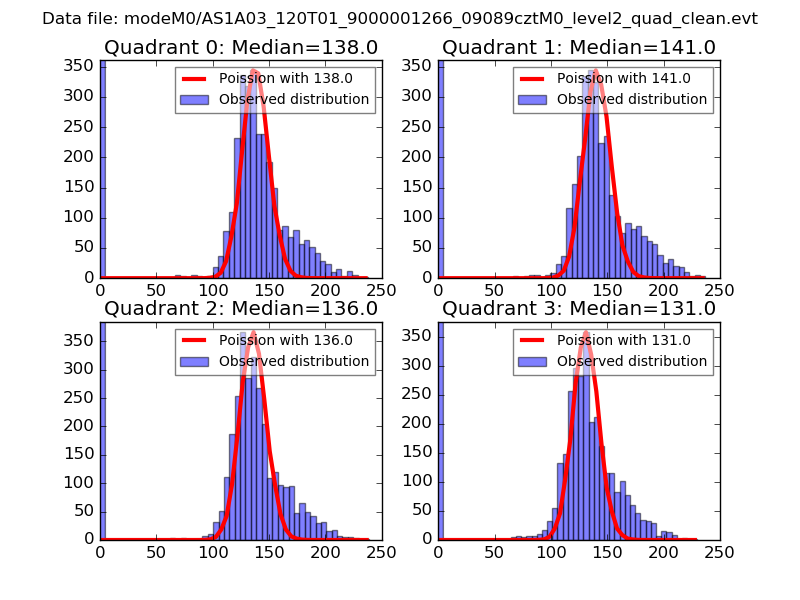 |
 |
| Quadrant-wise count rates Data is divided into 100 sec bins |
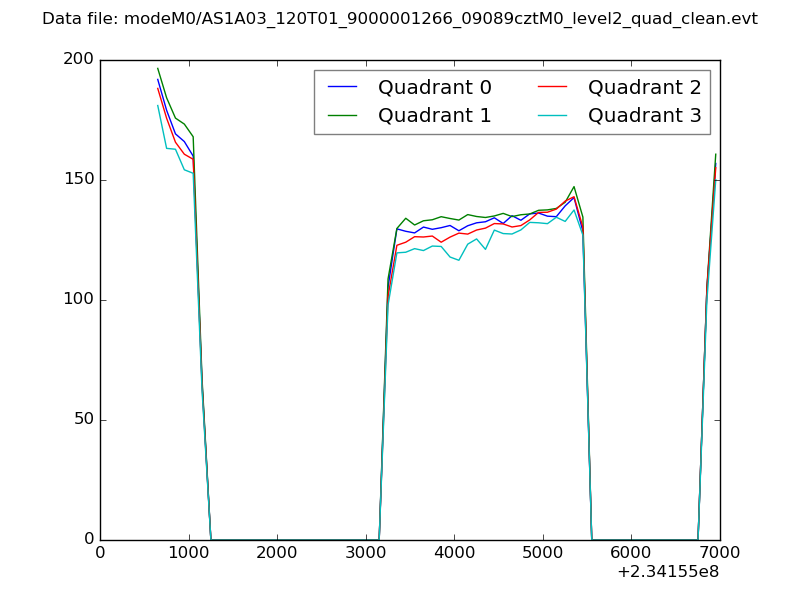 |
|
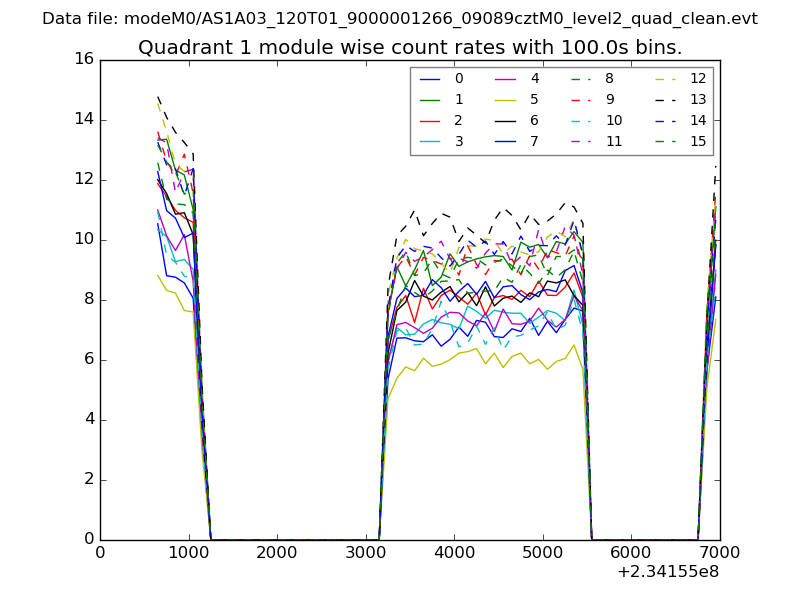
| Module-wise count rates for Quadrant A Data is divided into 100 sec bins |
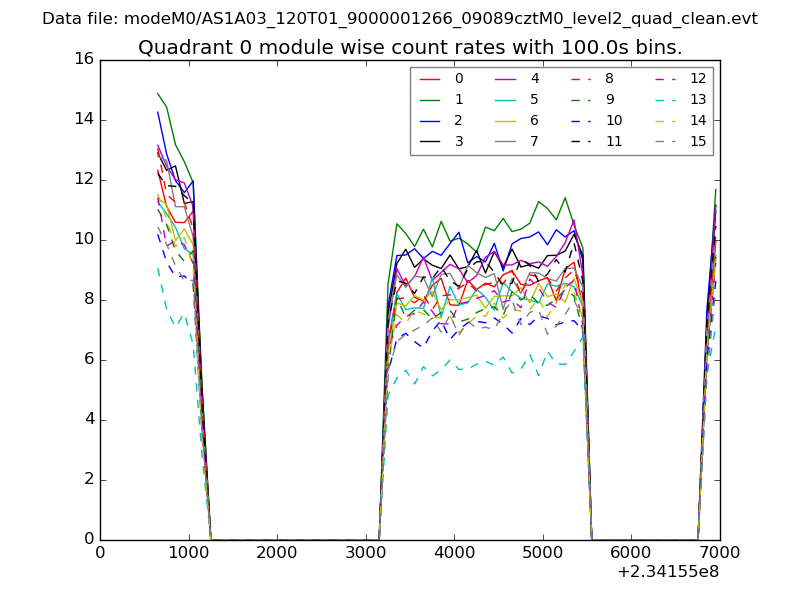 |
 |
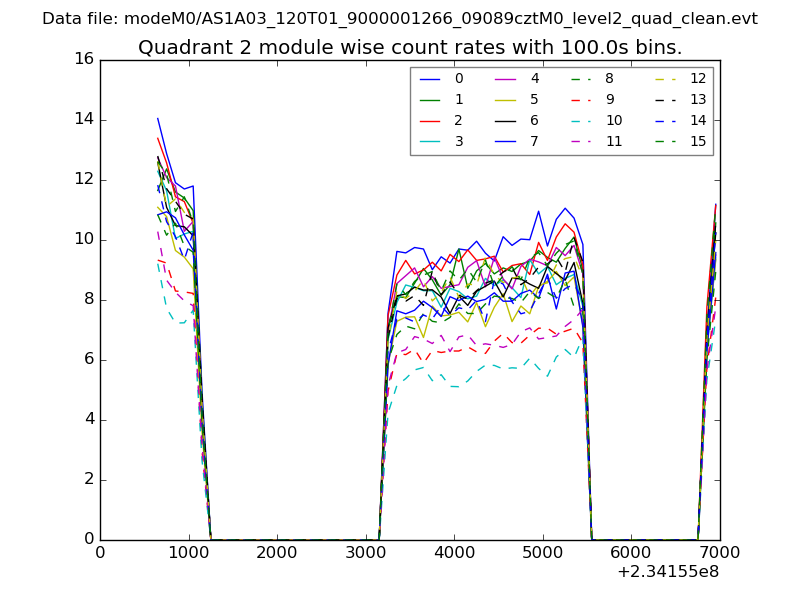
| Module-wise count rates for Quadrant B Data is divided into 100 sec bins |
 |
 |
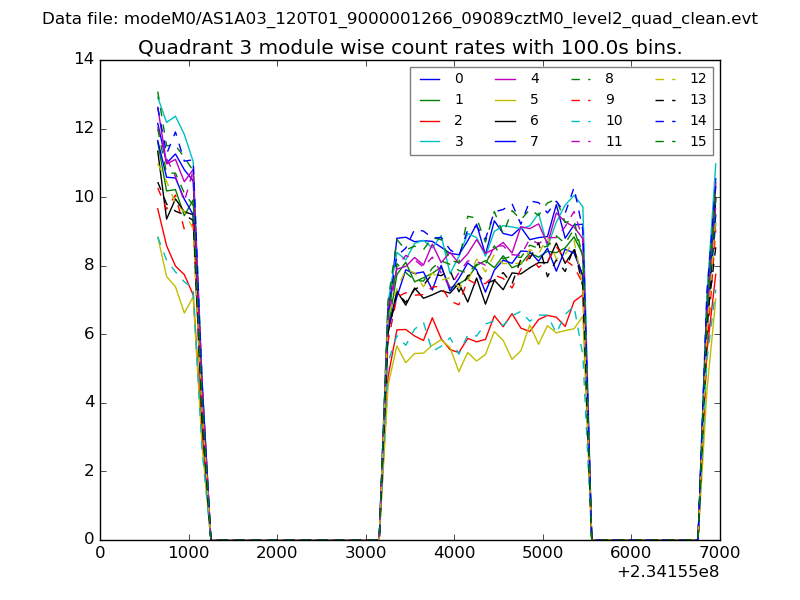
| Module-wise count rates for Quadrant C Data is divided into 100 sec bins |
 |
 |
| Module-wise count rates for Quadrant D Data is divided into 100 sec bins |
 |
 |
| Parameter | Plot |
|---|---|
| CZT HV Monitor | 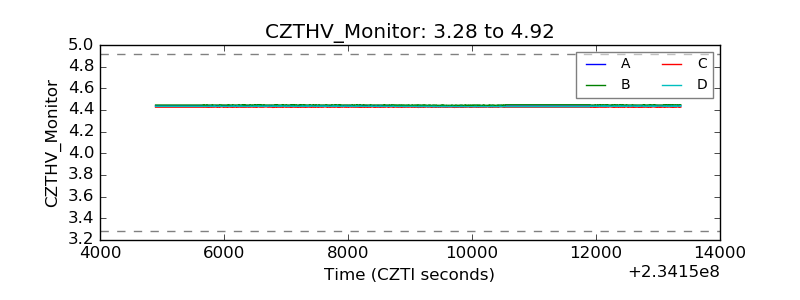 |
| D_VDD | 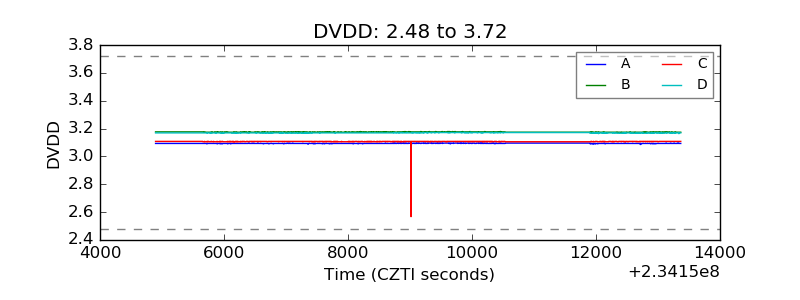 |
| Temperature 1 | 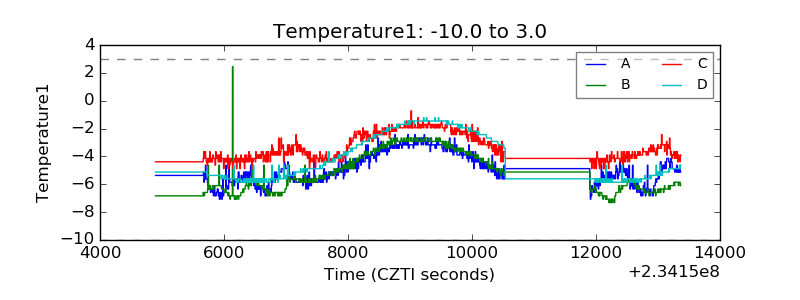 |
| Veto HV Monitor | 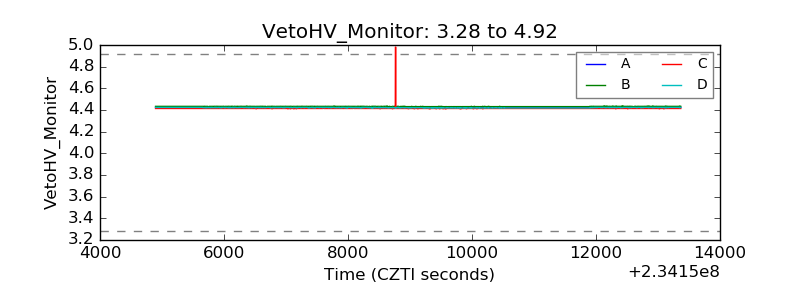 |
| Veto LLD | 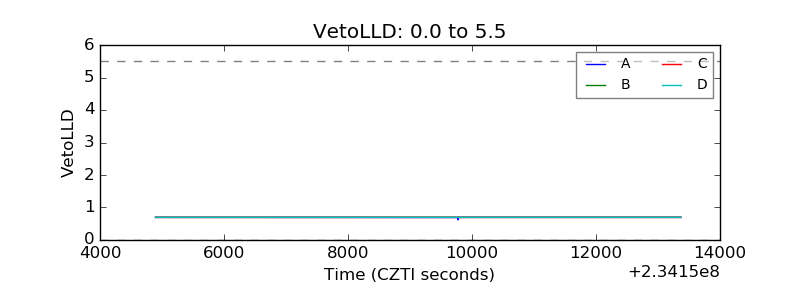 |
| Alpha Counter | 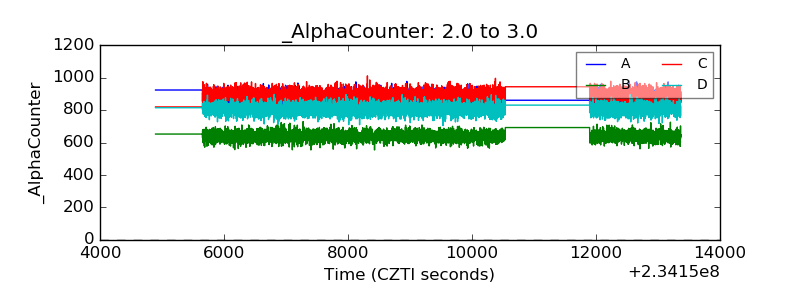 |
| _CPM_Rate | 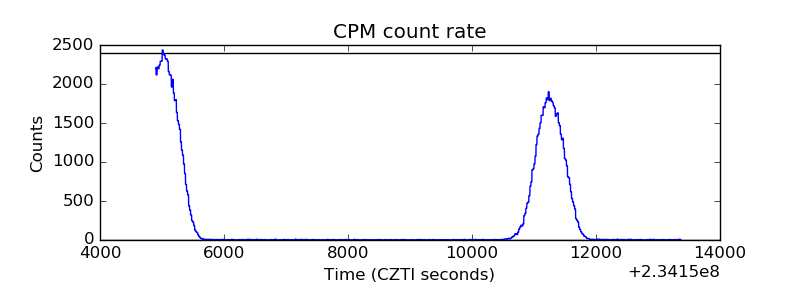 |
| CZT Counter | 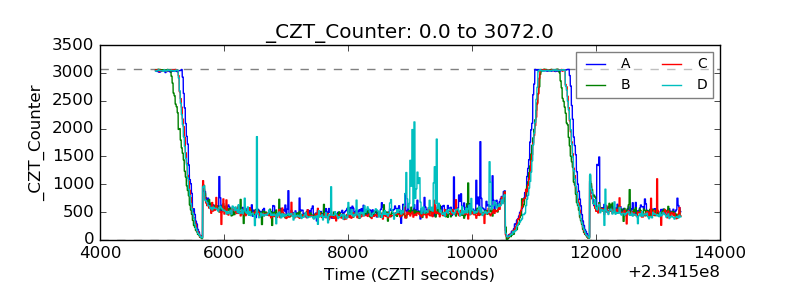 |
| +2.5 Volts monitor |  |
| +5 Volts monitor |  |
| _ROLL_ROT | 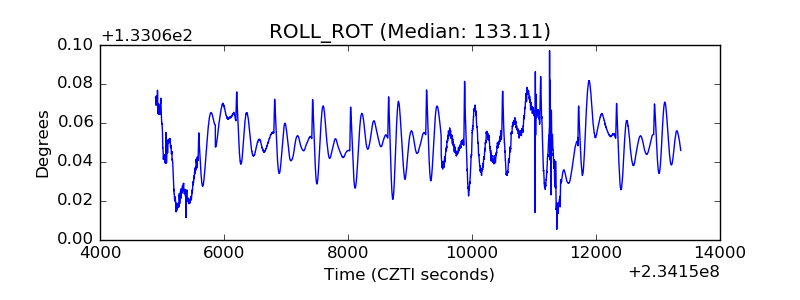 |
| _Roll_DEC | 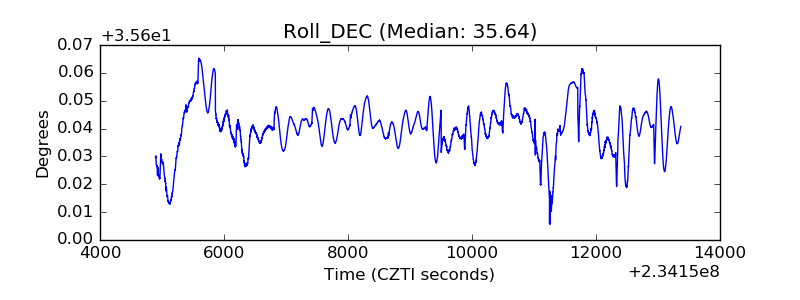 |
| _Roll_RA | 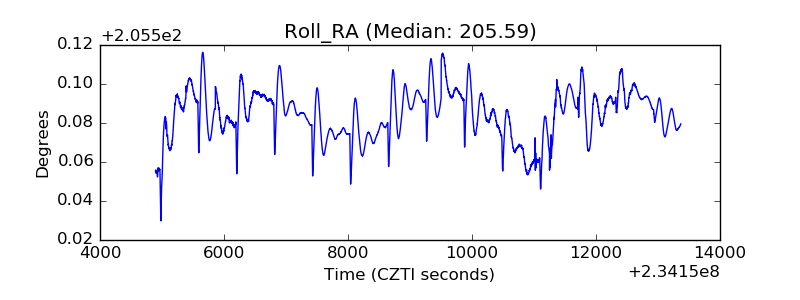 |
| Veto Counter | 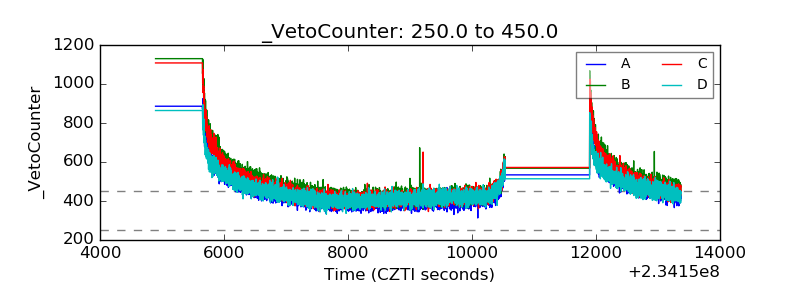 |