| Param | Original file | Final file |
|---|---|---|
| Filename | modeM0/AS1A03_120T01_9000001266_09090cztM0_level2.evt | modeM0/AS1A03_120T01_9000001266_09090cztM0_level2_quad_clean.evt |
| Size (bytes) | 469,290,240 | 65,289,600 |
| Size | 447.6 MB | 62.3 MB |
| Events in quadrant A | 3,470,570 | 389,721 |
| Events in quadrant B | 3,310,523 | 396,797 |
| Events in quadrant C | 3,082,254 | 383,258 |
| Events in quadrant D | 3,919,033 | 364,900 |
| Mode M9 | |||
|---|---|---|---|
| Quadrant | BADHDUFLAG | Total packets | Discarded packets |
| A | 0 | 20 | 0 |
| B | 0 | 20 | 0 |
| C | 0 | 20 | 0 |
| D | 0 | 21 | 0 |
| Mode M0 | |||
|---|---|---|---|
| Quadrant | BADHDUFLAG | Total packets | Discarded packets |
| A | 0 | 13958 | 3 |
| B | 0 | 13521 | 2 |
| C | 0 | 13151 | 2 |
| D | 0 | 15754 | 2 |
| Mode SS | |||
|---|---|---|---|
| Quadrant | BADHDUFLAG | Total packets | Discarded packets |
| A | 0 | 128 | 0 |
| B | 0 | 128 | 0 |
| C | 0 | 128 | 0 |
| D | 0 | 128 | 0 |
| Quadrant | Total seconds | Saturated seconds | Saturation percentage |
|---|---|---|---|
| A | 6336 | 88 | 1.388889% |
| B | 6336 | 103 | 1.625631% |
| C | 6336 | 43 | 0.678662% |
| D | 6336 | 162 | 2.556818% |
Noise dominated data is calculated using 1-second bins in cleaned event files. If a bin has >2000 counts, and if more than 50% of those come from <1% of pixels, then it is considered to be noise-dominated and hence unusable.
| Quadrant | # 1 sec bins | Bins with >0 counts | Bins with >2000 counts | High rate bins dominated by noise | Noise dominated (total time) | Noise dominated (detector-on time) | Marked lightcurve |
|---|---|---|---|---|---|---|---|
| A | 7651 | 6337 | 3 | 3 | 0.04% | 0.05% |  |
| B | 7651 | 6336 | 1 | 1 | 0.01% | 0.02% |  |
| C | 7651 | 6337 | 1 | 1 | 0.01% | 0.02% | 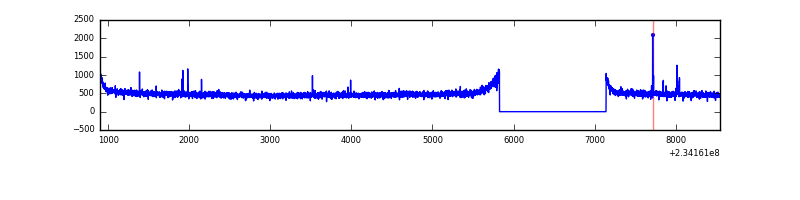 |
| D | 7651 | 6337 | 110 | 110 | 1.44% | 1.74% | 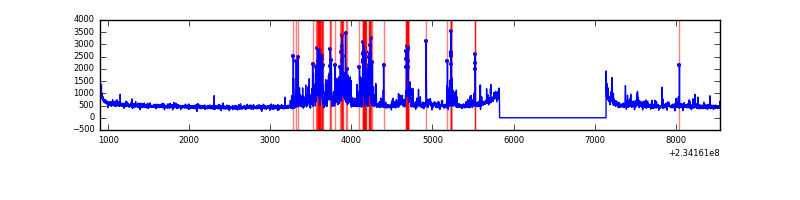 |
Top three noisy pixels from each quadrant. If the there are fewer than three noisy pixels in the level2.evt file, extra rows are filled as -1
| Pixel properties | Quadrant properties | ||||||
|---|---|---|---|---|---|---|---|
| Quadrant | DetID | PixID | Counts | Sigma | Mean | Median | Sigma |
| A | 8 | 5 | 143036 | 862.1 | 819 | 803 | 165.0 |
| A | 1 | 162 | 80934 | 485.69 | 819 | 803 | 165.0 |
| A | 15 | 174 | 23439 | 137.2 | 819 | 803 | 165.0 |
| B | 0 | 214 | 84701 | 544.49 | 821 | 804 | 154.1 |
| B | 12 | 111 | 16786 | 103.72 | 821 | 804 | 154.1 |
| B | 0 | 229 | 15075 | 92.62 | 821 | 804 | 154.1 |
| C | 14 | 234 | 18968 | 101.39 | 784 | 788 | 179.3 |
| C | 13 | 61 | 5825 | 28.09 | 784 | 788 | 179.3 |
| C | 8 | 222 | 4839 | 22.59 | 784 | 788 | 179.3 |
| D | 12 | 233 | 692749 | 3613.06 | 776 | 755 | 191.5 |
| D | 1 | 52 | 132854 | 689.72 | 776 | 755 | 191.5 |
| D | 8 | 195 | 80480 | 416.26 | 776 | 755 | 191.5 |
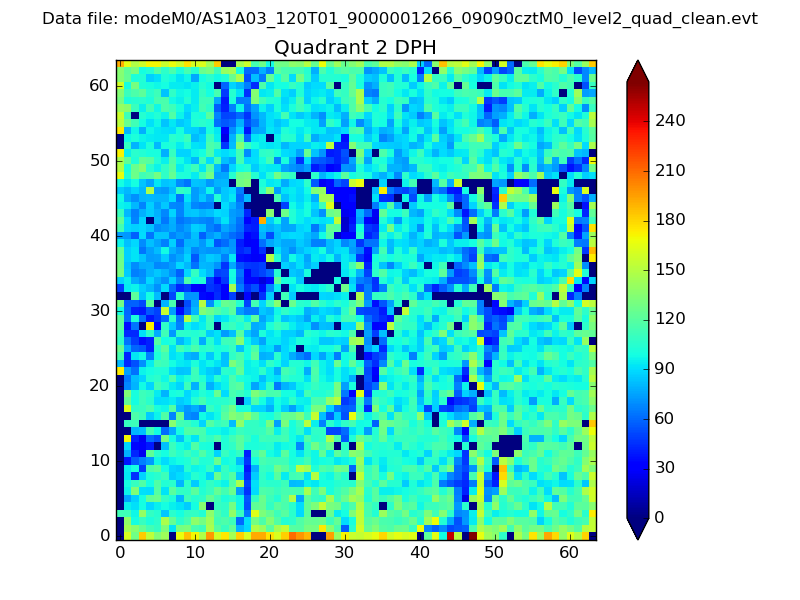
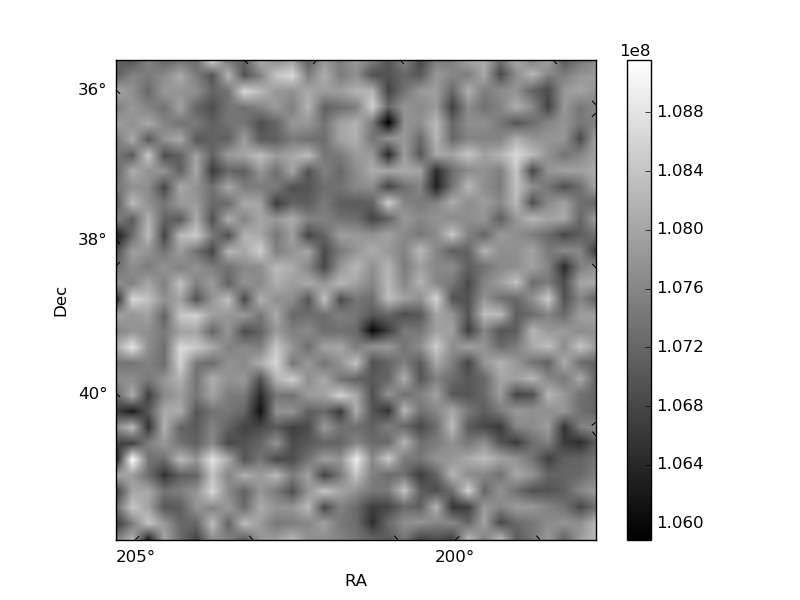
Histogram calculated using DETX and DETY for each event in the final _common_clean file
| Quadrant A | 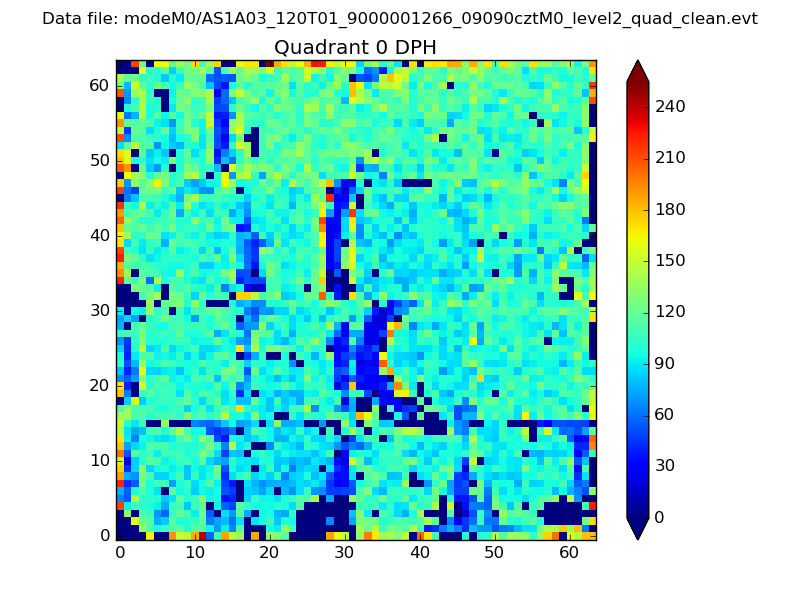 |
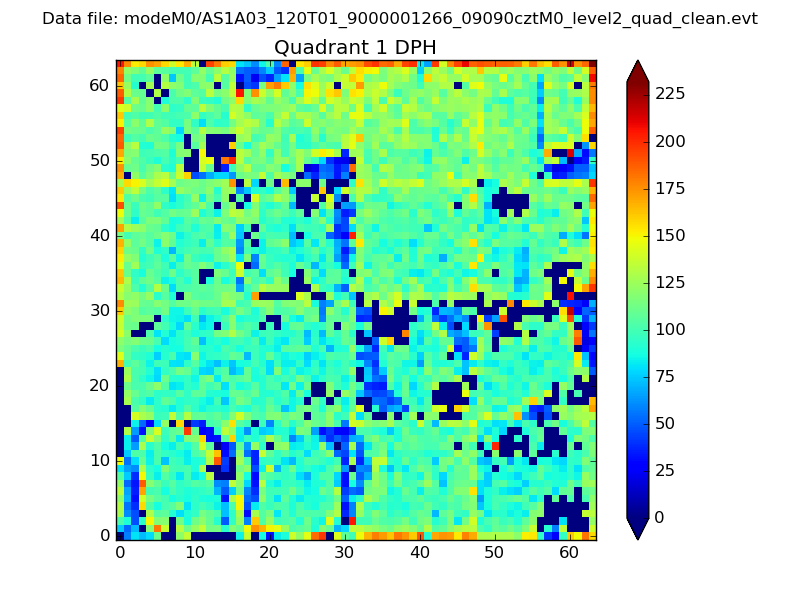 |
Quadrant B |
|---|---|---|---|
| Quadrant D | 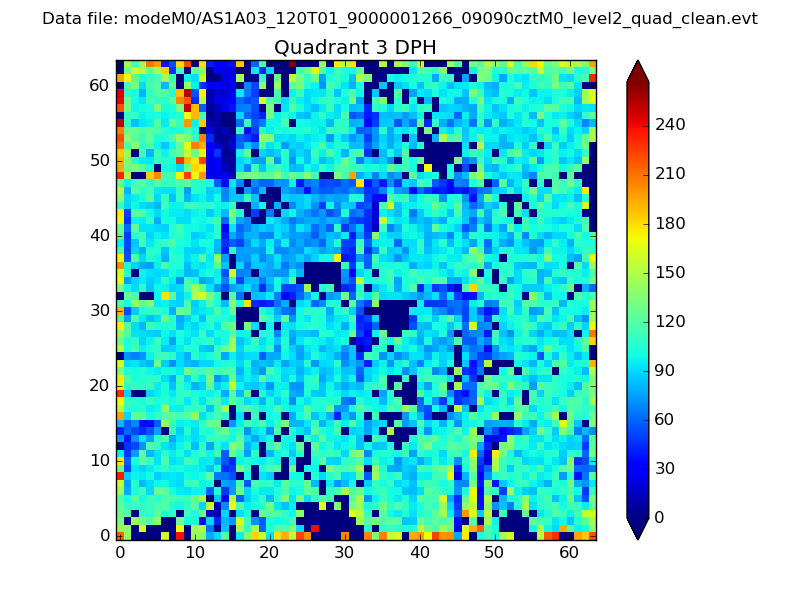 |
 |
Quadrant C |
| Plot type | Count rate plots | Images |
|---|---|---|
| Comparison with Poisson distribution Blue bars denote a histogram of data divided into 1 sec bins. Red curve is a Poisson curve with rate = median count rate of data. |
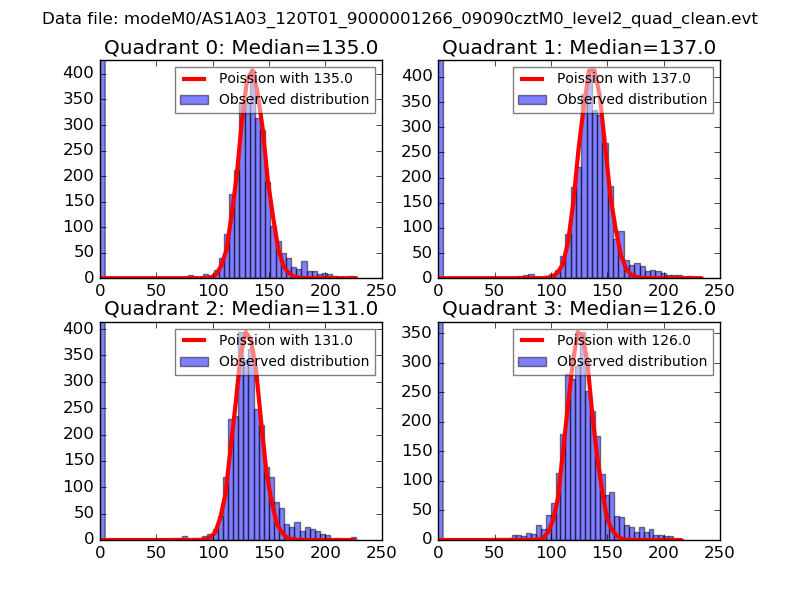 |
 |
| Quadrant-wise count rates Data is divided into 100 sec bins |
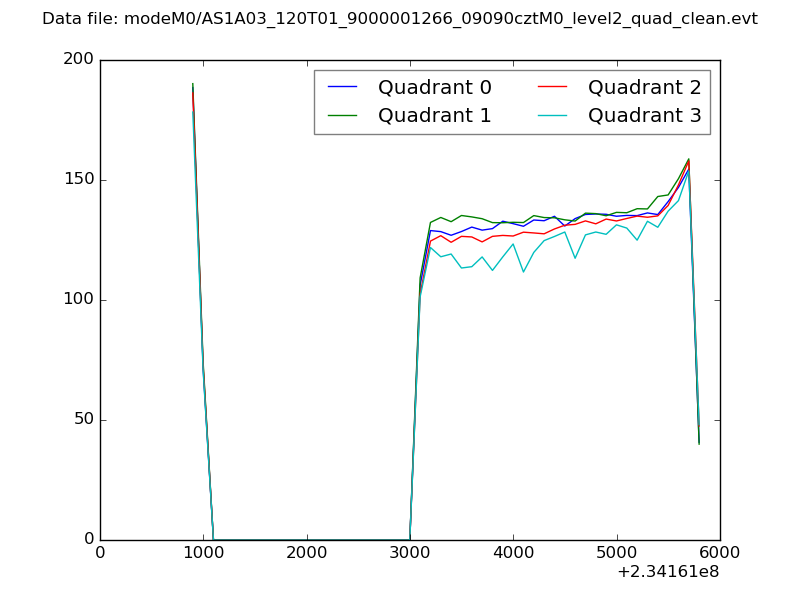 |
|
| Module-wise count rates for Quadrant A Data is divided into 100 sec bins |
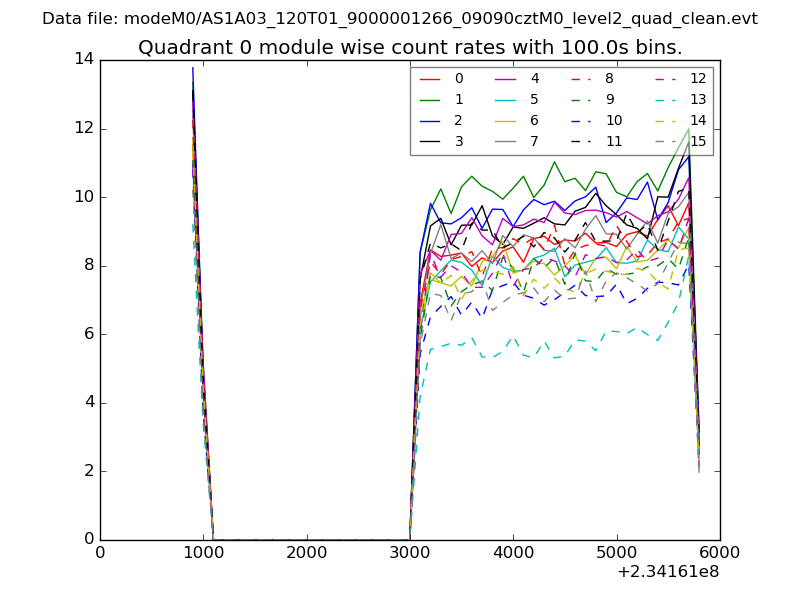 |
 |
| Module-wise count rates for Quadrant B Data is divided into 100 sec bins |
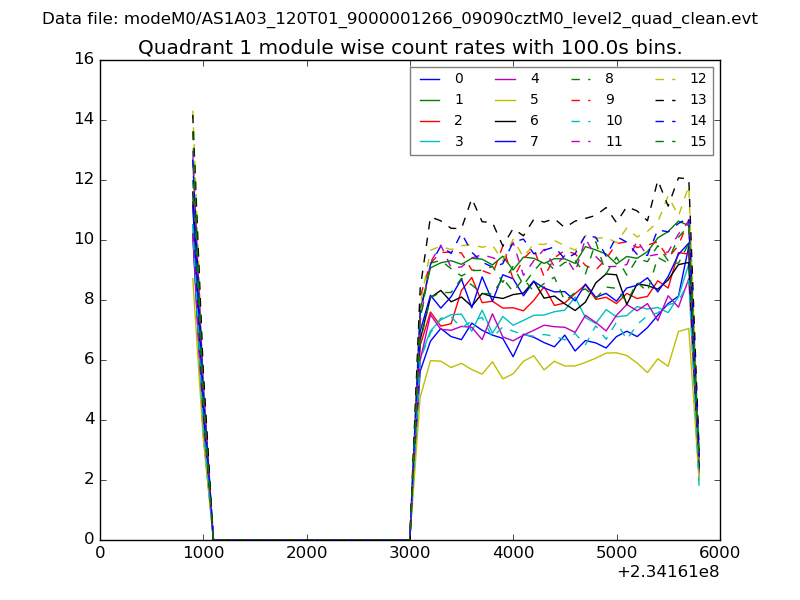 |
 |
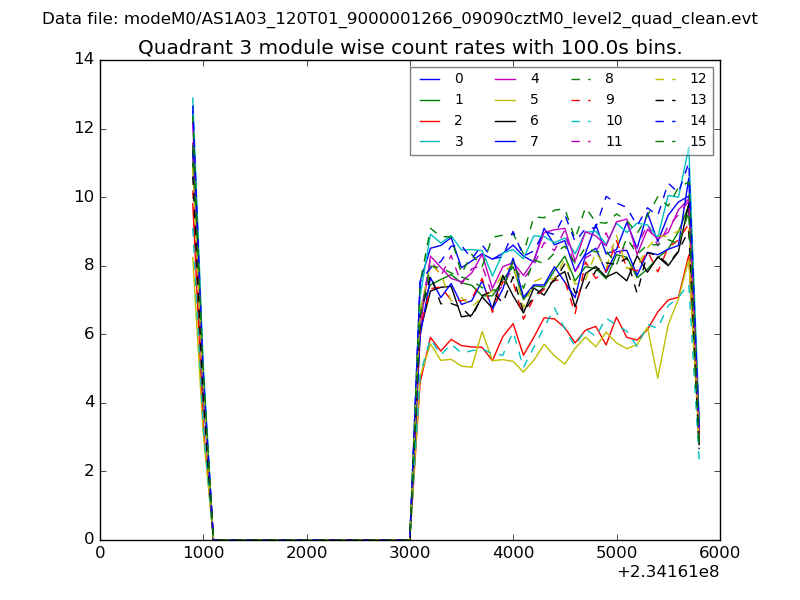
| Module-wise count rates for Quadrant C Data is divided into 100 sec bins |
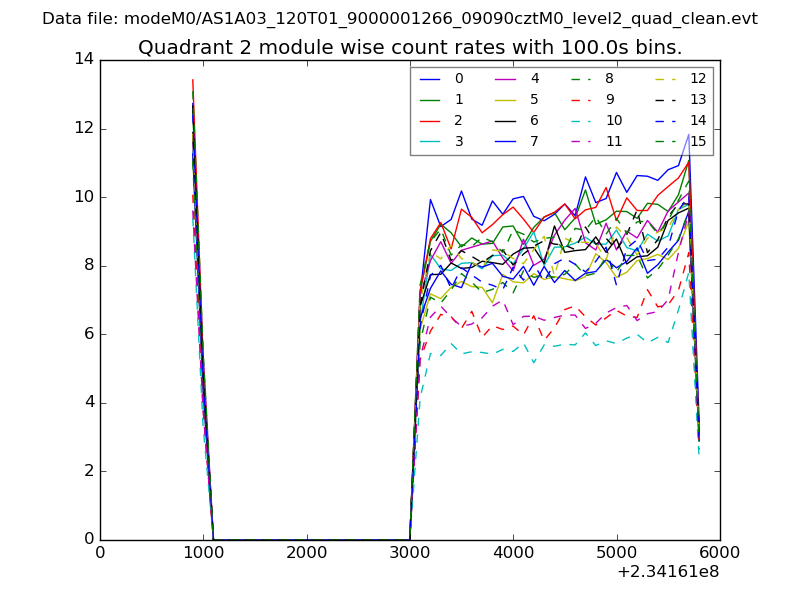 |
 |
| Module-wise count rates for Quadrant D Data is divided into 100 sec bins |
 |
 |
| Parameter | Plot |
|---|---|
| CZT HV Monitor | 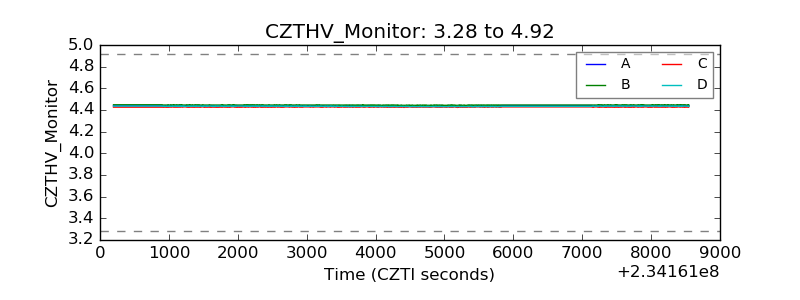 |
| D_VDD | 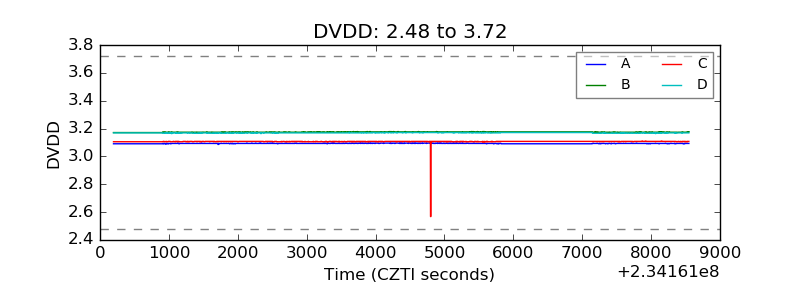 |
| Temperature 1 | 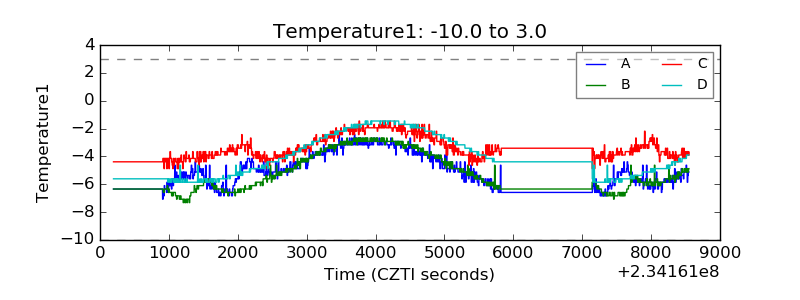 |
| Veto HV Monitor | 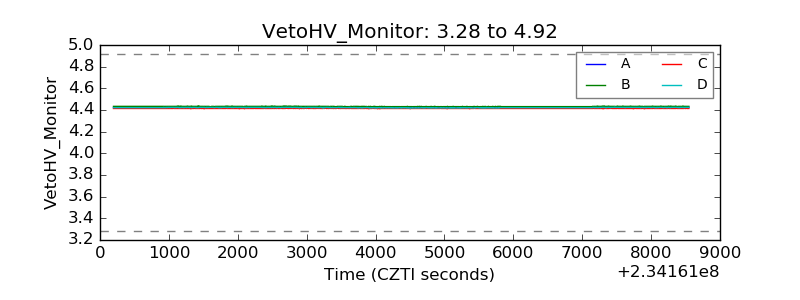 |
| Veto LLD | 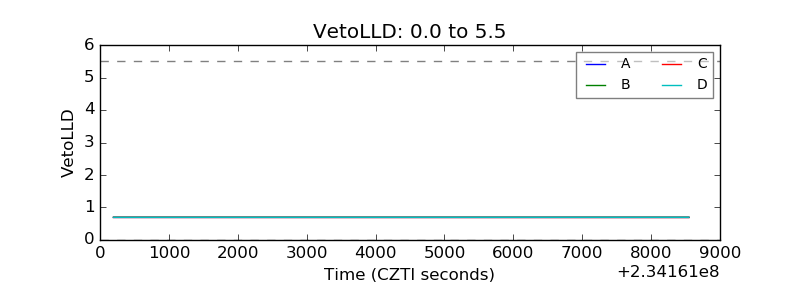 |
| Alpha Counter | 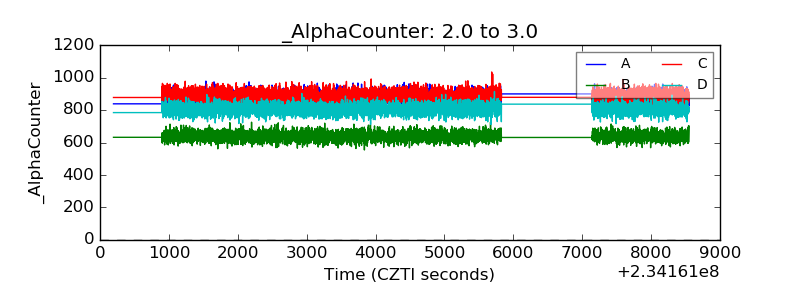 |
| _CPM_Rate | 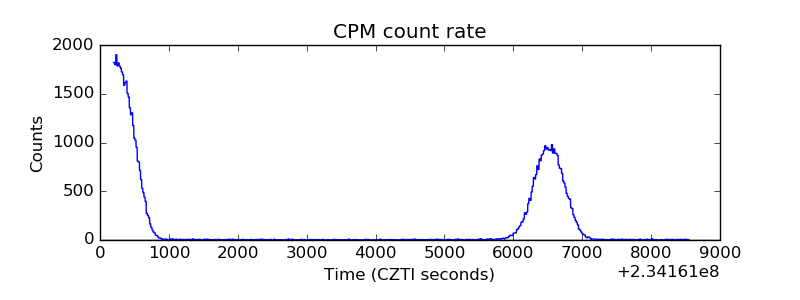 |
| CZT Counter | 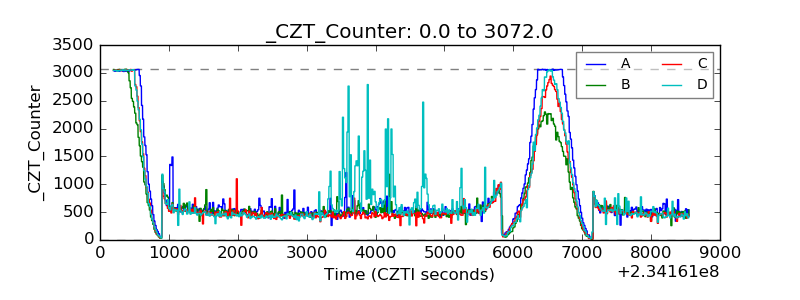 |
| +2.5 Volts monitor |  |
| +5 Volts monitor | 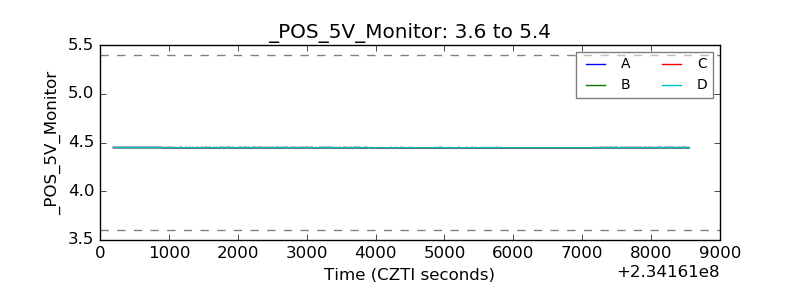 |
| _ROLL_ROT | 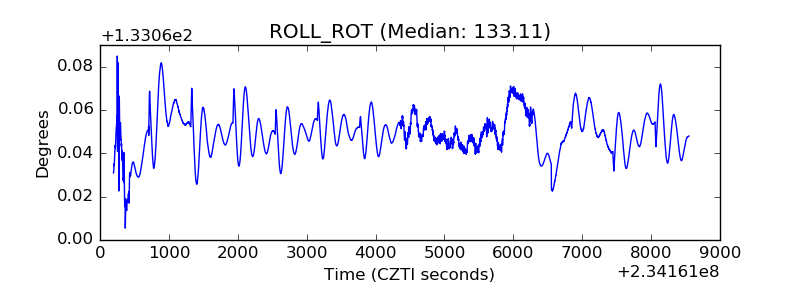 |
| _Roll_DEC | 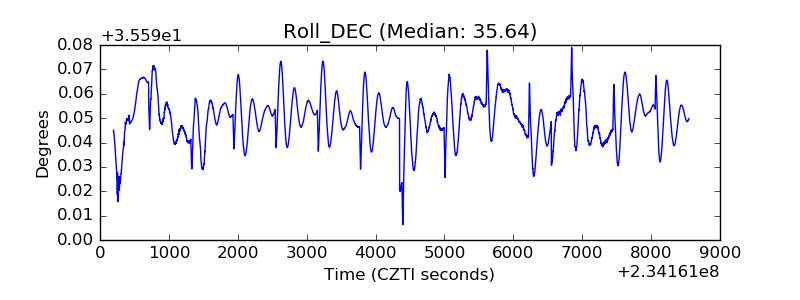 |
| _Roll_RA | 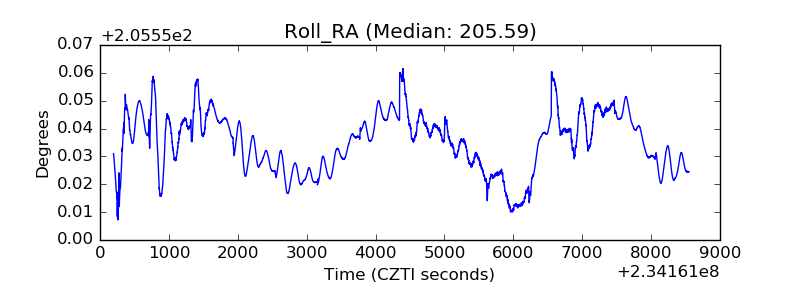 |
| Veto Counter | 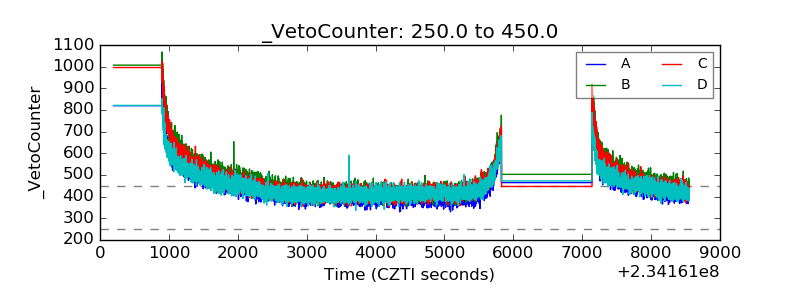 |