| Param | Original file | Final file |
|---|---|---|
| Filename | modeM0/AS1A03_120T01_9000001266_09091cztM0_level2.evt | modeM0/AS1A03_120T01_9000001266_09091cztM0_level2_quad_clean.evt |
| Size (bytes) | 490,101,120 | 70,640,640 |
| Size | 467.4 MB | 67.4 MB |
| Events in quadrant A | 3,488,269 | 430,284 |
| Events in quadrant B | 3,261,455 | 438,578 |
| Events in quadrant C | 3,111,364 | 425,397 |
| Events in quadrant D | 4,538,566 | 389,567 |
| Mode M9 | |||
|---|---|---|---|
| Quadrant | BADHDUFLAG | Total packets | Discarded packets |
| A | 0 | 16 | 0 |
| B | 0 | 16 | 0 |
| C | 0 | 16 | 0 |
| D | 0 | 17 | 0 |
| Mode M0 | |||
|---|---|---|---|
| Quadrant | BADHDUFLAG | Total packets | Discarded packets |
| A | 0 | 14136 | 13 |
| B | 0 | 13687 | 9 |
| C | 0 | 13566 | 6 |
| D | 0 | 17737 | 15 |
| Mode SS | |||
|---|---|---|---|
| Quadrant | BADHDUFLAG | Total packets | Discarded packets |
| A | 0 | 132 | 0 |
| B | 0 | 132 | 0 |
| C | 0 | 132 | 0 |
| D | 0 | 132 | 0 |
| Quadrant | Total seconds | Saturated seconds | Saturation percentage |
|---|---|---|---|
| A | 6522 | 160 | 2.453235% |
| B | 6524 | 143 | 2.191907% |
| C | 6525 | 80 | 1.226054% |
| D | 6521 | 481 | 7.376169% |
Noise dominated data is calculated using 1-second bins in cleaned event files. If a bin has >2000 counts, and if more than 50% of those come from <1% of pixels, then it is considered to be noise-dominated and hence unusable.
| Quadrant | # 1 sec bins | Bins with >0 counts | Bins with >2000 counts | High rate bins dominated by noise | Noise dominated (total time) | Noise dominated (detector-on time) | Marked lightcurve |
|---|---|---|---|---|---|---|---|
| A | 7642 | 6527 | 14 | 14 | 0.18% | 0.21% | 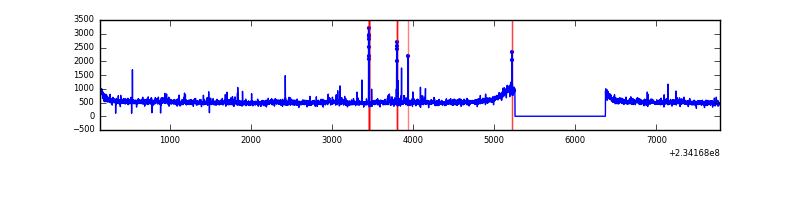 |
| B | 7642 | 6527 | 2 | 2 | 0.03% | 0.03% | 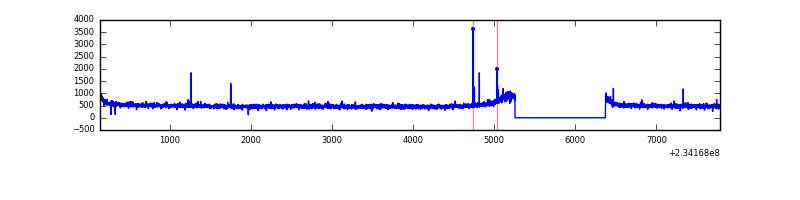 |
| C | 7642 | 6527 | 1 | 1 | 0.01% | 0.02% | 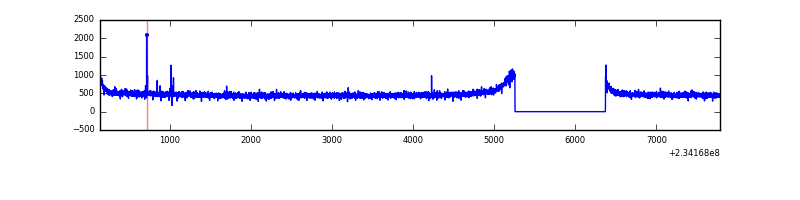 |
| D | 7642 | 6527 | 369 | 369 | 4.83% | 5.65% | 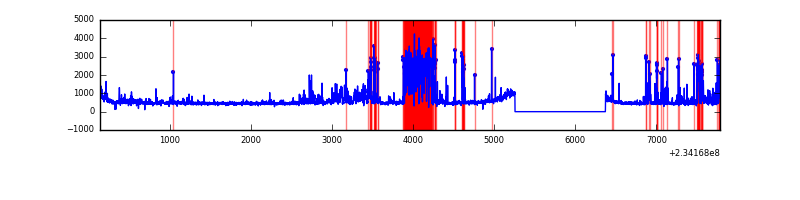 |
Top three noisy pixels from each quadrant. If the there are fewer than three noisy pixels in the level2.evt file, extra rows are filled as -1
| Pixel properties | Quadrant properties | ||||||
|---|---|---|---|---|---|---|---|
| Quadrant | DetID | PixID | Counts | Sigma | Mean | Median | Sigma |
| A | 8 | 5 | 165376 | 980.98 | 824 | 809 | 167.8 |
| A | 1 | 162 | 57873 | 340.16 | 824 | 809 | 167.8 |
| A | 5 | 16 | 50937 | 298.81 | 824 | 809 | 167.8 |
| B | 0 | 219 | 27195 | 166.86 | 828 | 807 | 158.1 |
| B | 4 | 173 | 19163 | 116.07 | 828 | 807 | 158.1 |
| B | 12 | 111 | 17325 | 104.45 | 828 | 807 | 158.1 |
| C | 14 | 234 | 12651 | 64.68 | 793 | 796 | 183.3 |
| C | 13 | 61 | 5876 | 27.72 | 793 | 796 | 183.3 |
| C | 8 | 222 | 5040 | 23.16 | 793 | 796 | 183.3 |
| D | 1 | 52 | 1009576 | 5235.32 | 771 | 749 | 192.7 |
| D | 10 | 172 | 239112 | 1236.98 | 771 | 749 | 192.7 |
| D | 2 | 14 | 111653 | 575.53 | 771 | 749 | 192.7 |
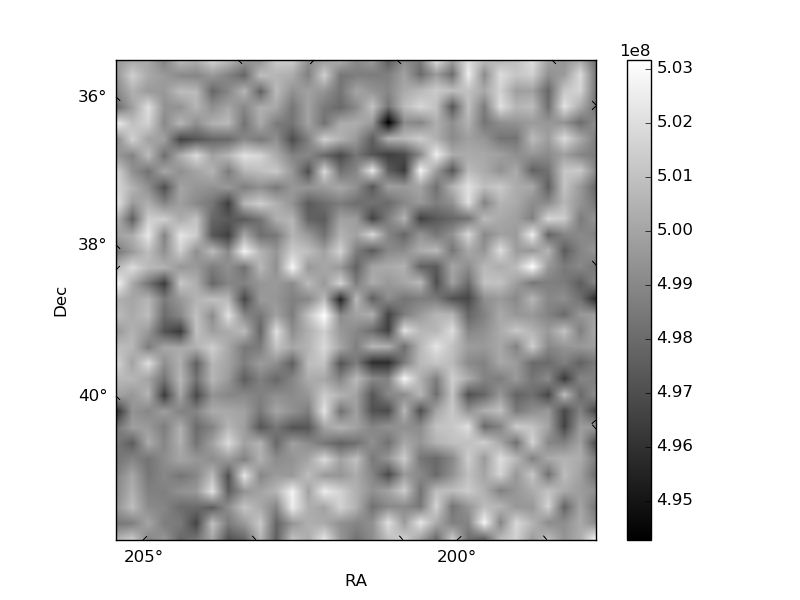
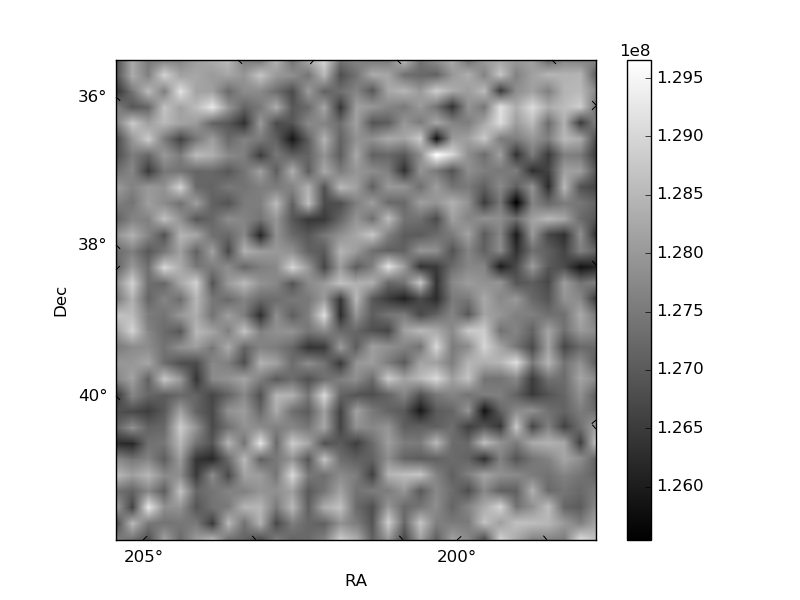
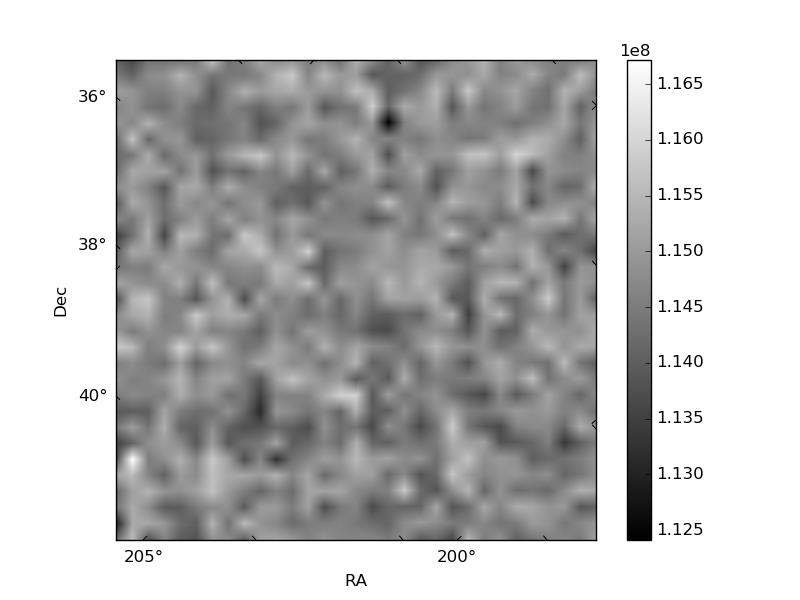
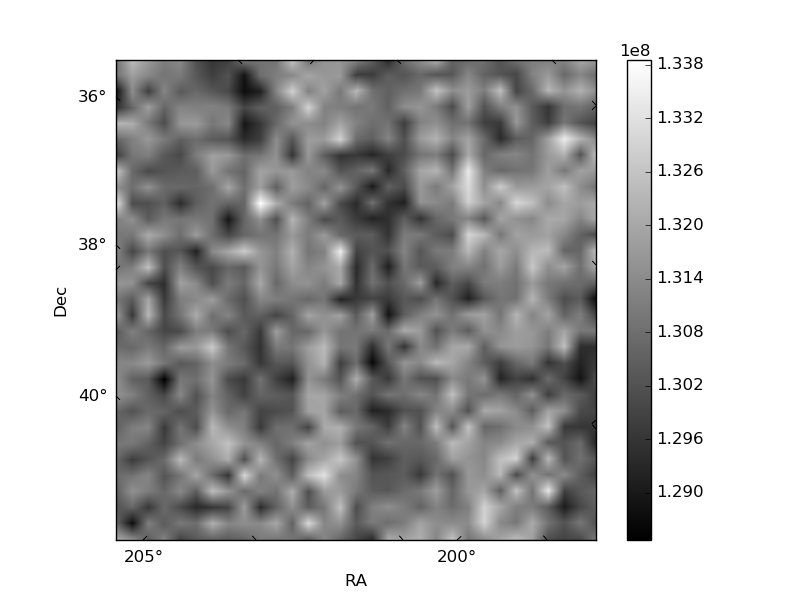
Histogram calculated using DETX and DETY for each event in the final _common_clean file
| Quadrant A | 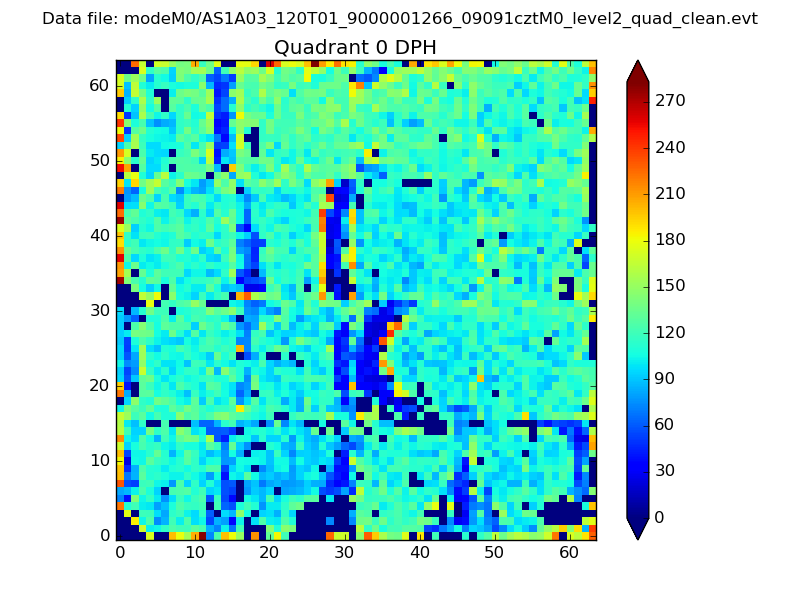 |
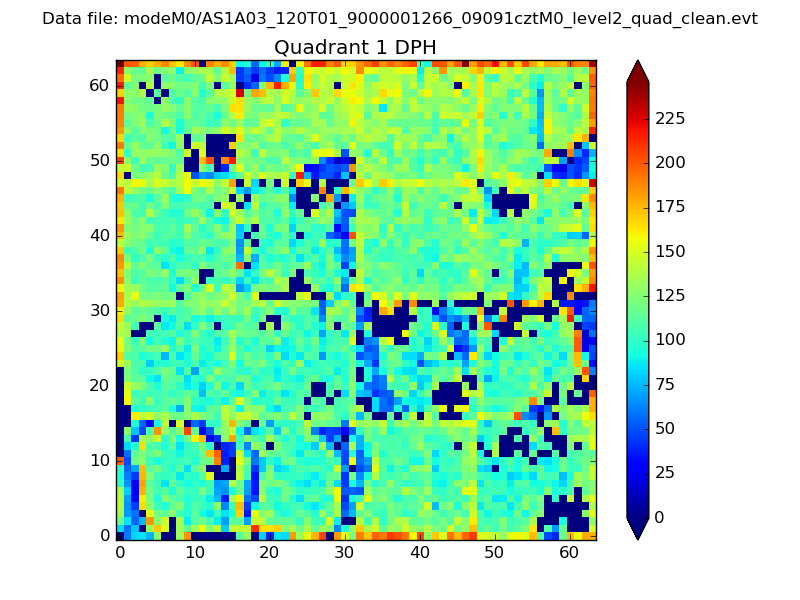 |
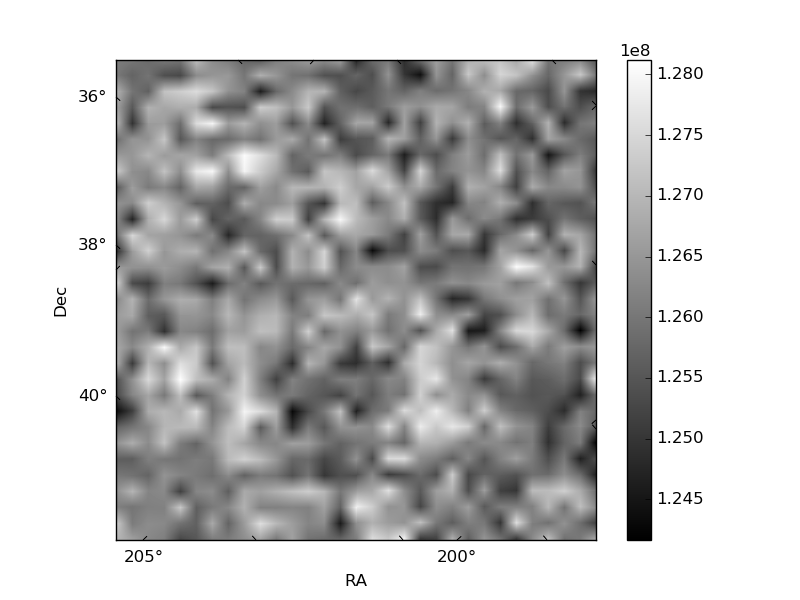
Quadrant B |
|---|---|---|---|
| Quadrant D | 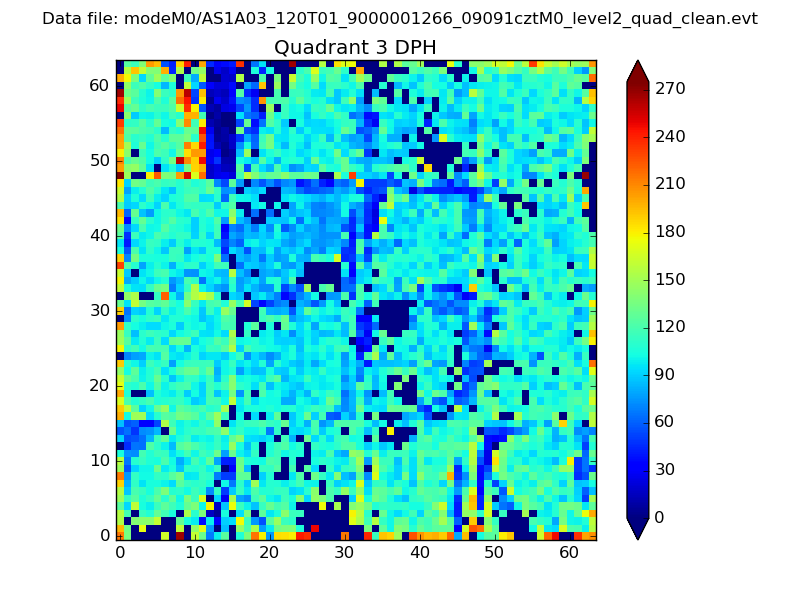 |
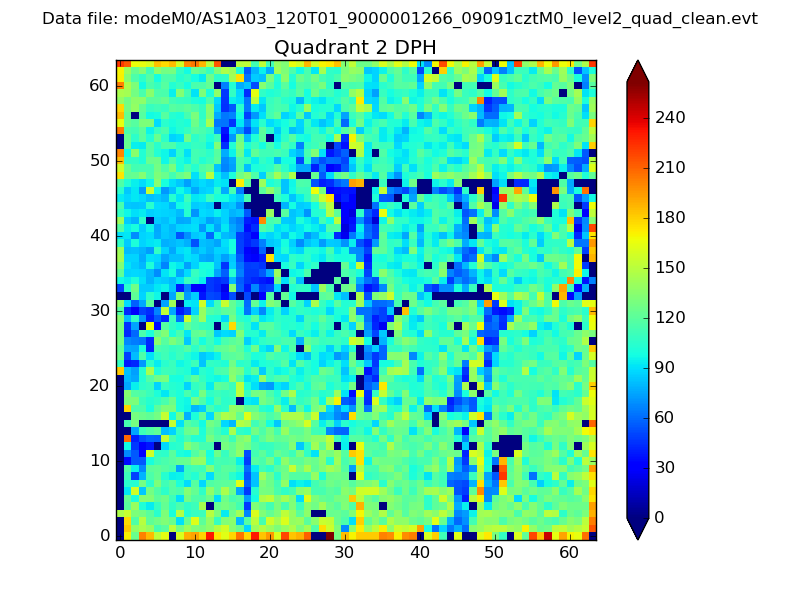 |
Quadrant C |
| Plot type | Count rate plots | Images |
|---|---|---|
| Comparison with Poisson distribution Blue bars denote a histogram of data divided into 1 sec bins. Red curve is a Poisson curve with rate = median count rate of data. |
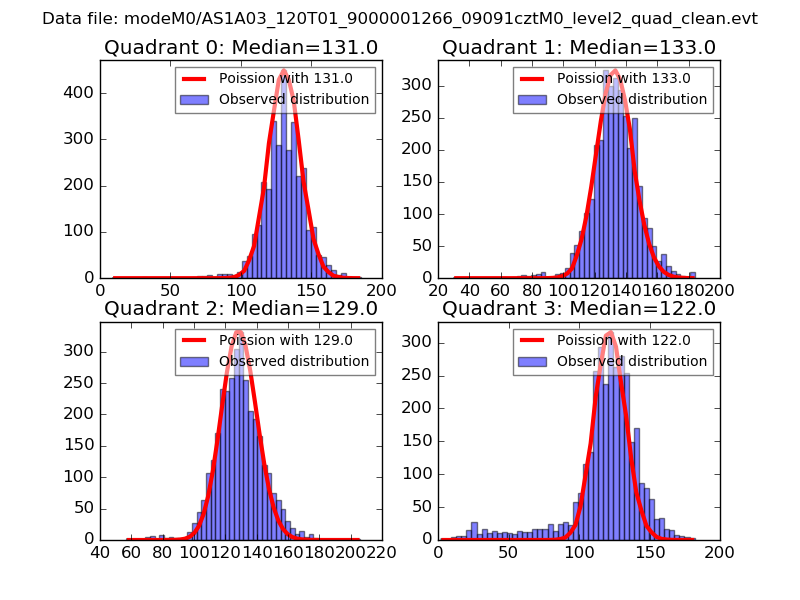 |
 |
| Quadrant-wise count rates Data is divided into 100 sec bins |
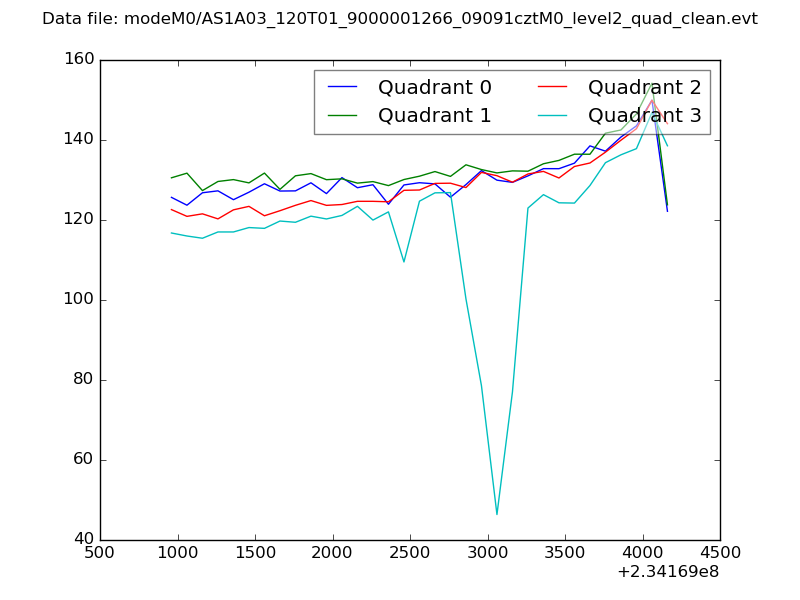 |
|
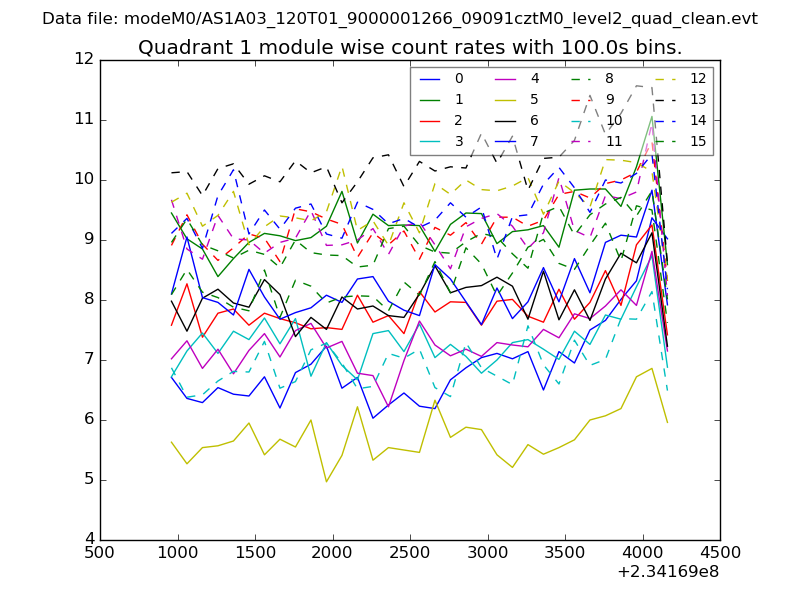
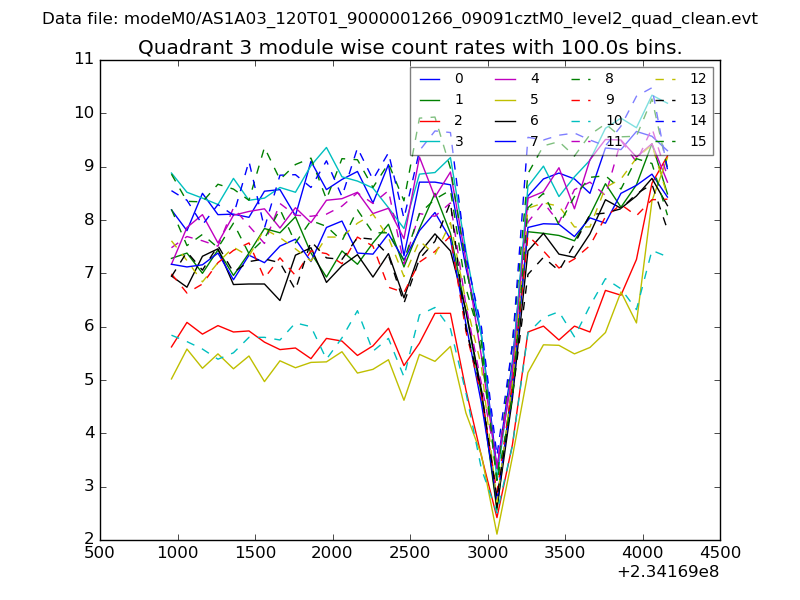
| Module-wise count rates for Quadrant A Data is divided into 100 sec bins |
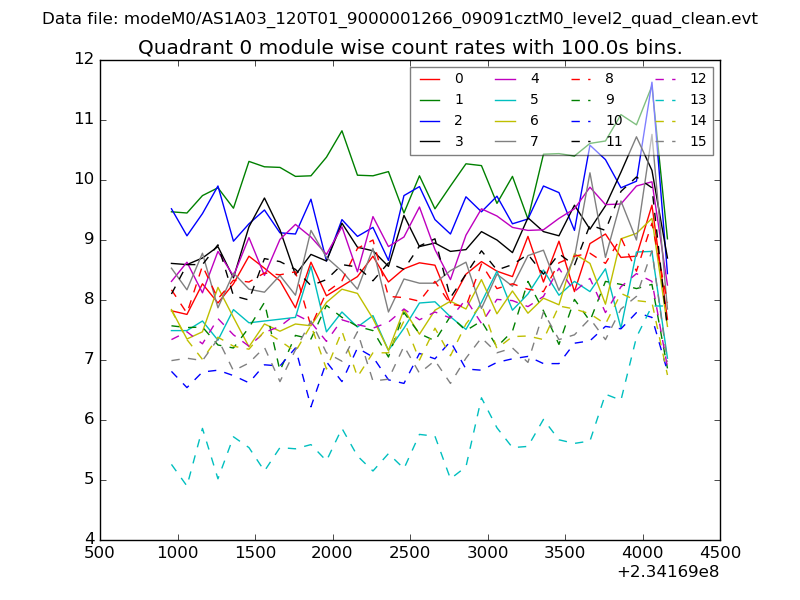 |
 |
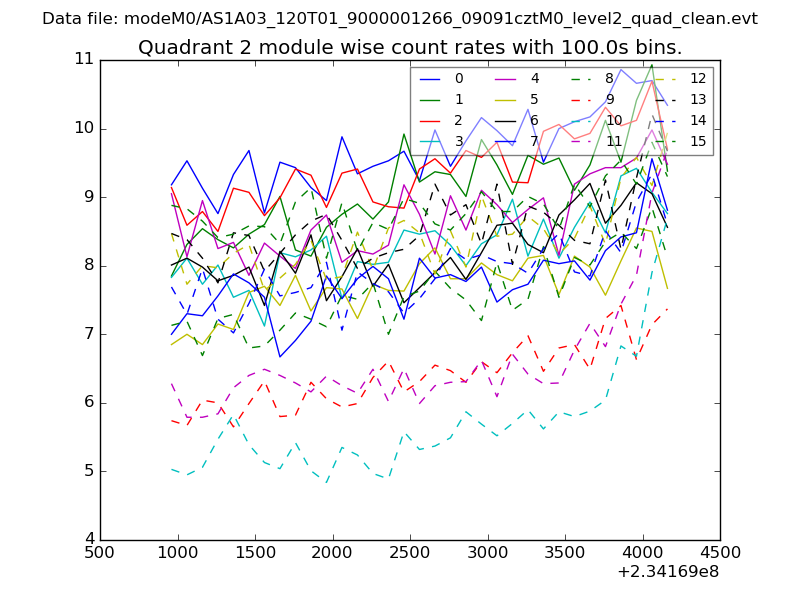
| Module-wise count rates for Quadrant B Data is divided into 100 sec bins |
 |
 |
| Module-wise count rates for Quadrant C Data is divided into 100 sec bins |
 |
 |
| Module-wise count rates for Quadrant D Data is divided into 100 sec bins |
 |
 |
| Parameter | Plot |
|---|---|
| CZT HV Monitor | 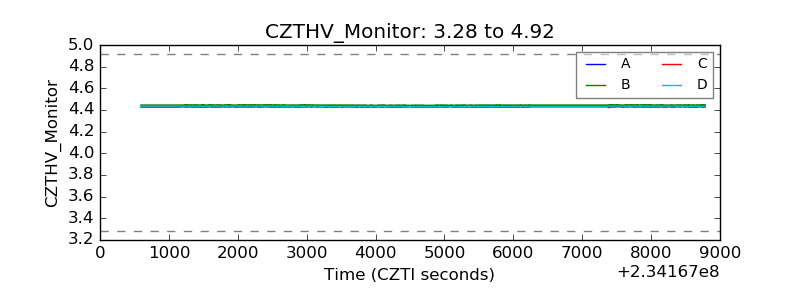 |
| D_VDD | 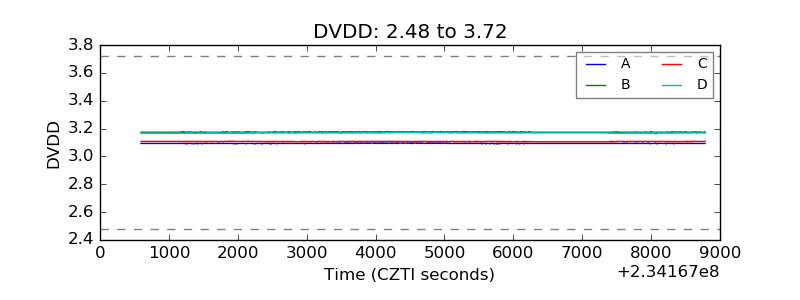 |
| Temperature 1 | 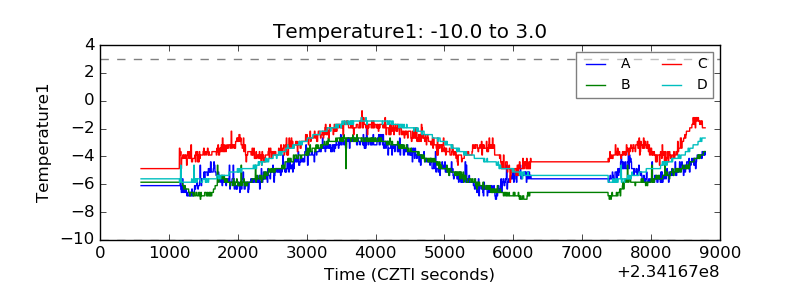 |
| Veto HV Monitor | 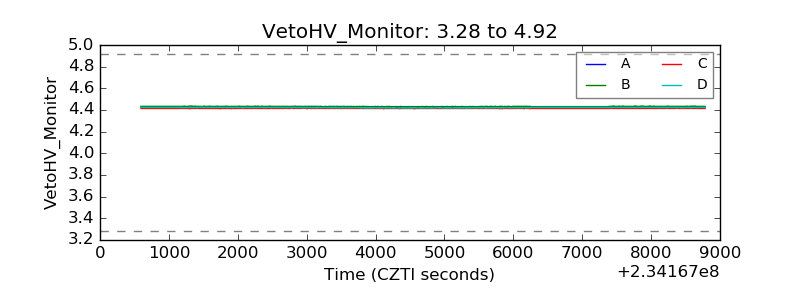 |
| Veto LLD | 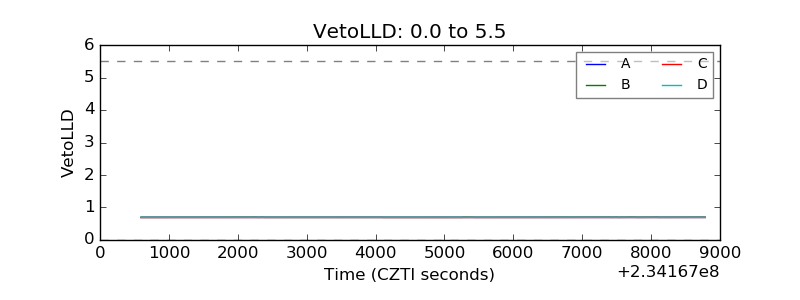 |
| Alpha Counter | 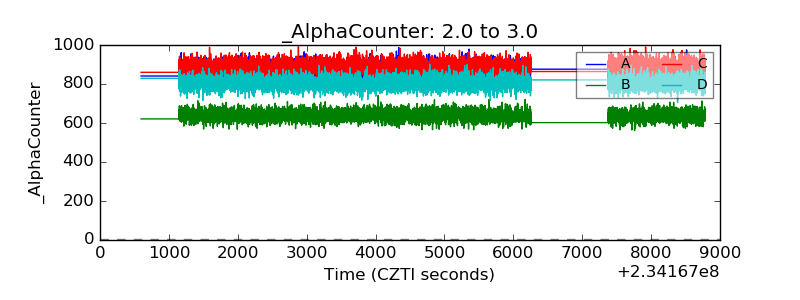 |
| _CPM_Rate | 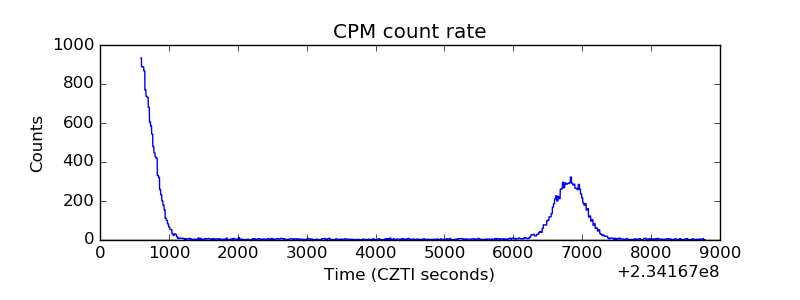 |
| CZT Counter | 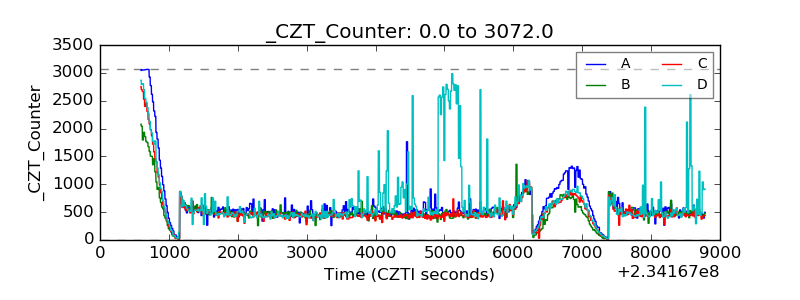 |
| +2.5 Volts monitor |  |
| +5 Volts monitor |  |
| _ROLL_ROT | 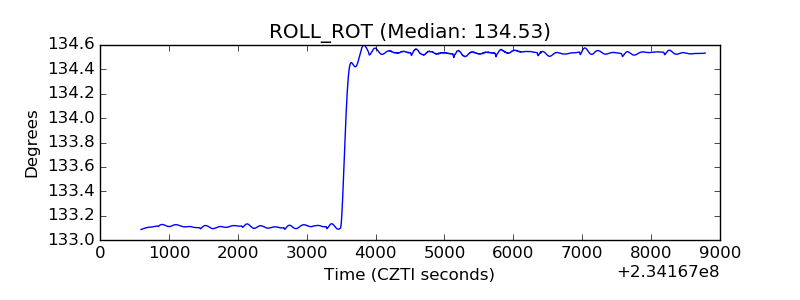 |
| _Roll_DEC | 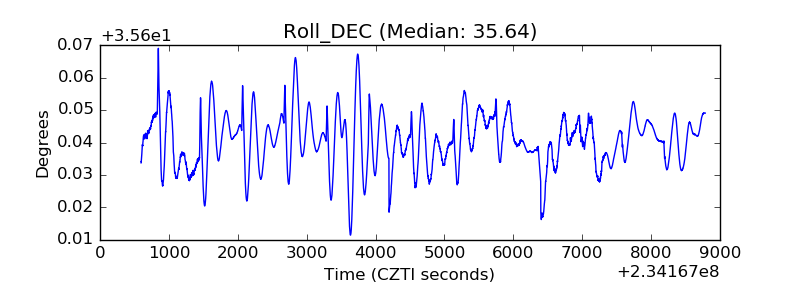 |
| _Roll_RA |  |
| Veto Counter | 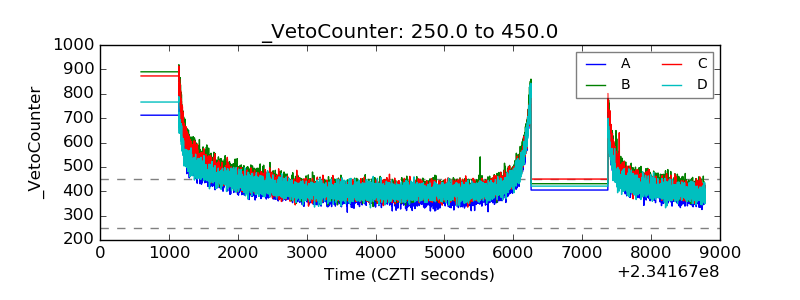 |