| Param | Original file | Final file |
|---|---|---|
| Filename | modeM0/AS1A03_120T01_9000001266_09094cztM0_level2.evt | modeM0/AS1A03_120T01_9000001266_09094cztM0_level2_quad_clean.evt |
| Size (bytes) | 478,946,880 | 93,277,440 |
| Size | 456.8 MB | 89.0 MB |
| Events in quadrant A | 3,717,496 | 589,498 |
| Events in quadrant B | 3,377,978 | 600,018 |
| Events in quadrant C | 3,234,966 | 582,905 |
| Events in quadrant D | 3,696,949 | 563,024 |
| Mode M9 | |||
|---|---|---|---|
| Quadrant | BADHDUFLAG | Total packets | Discarded packets |
| A | 0 | 1 | 0 |
| B | 0 | 1 | 0 |
| C | 0 | 1 | 0 |
| D | 0 | 1 | 0 |
| Mode M0 | |||
|---|---|---|---|
| Quadrant | BADHDUFLAG | Total packets | Discarded packets |
| A | 0 | 15534 | 64 |
| B | 0 | 14778 | 51 |
| C | 0 | 14671 | 55 |
| D | 0 | 15884 | 75 |
| Mode SS | |||
|---|---|---|---|
| Quadrant | BADHDUFLAG | Total packets | Discarded packets |
| A | 0 | 142 | 0 |
| B | 0 | 142 | 0 |
| C | 0 | 142 | 0 |
| D | 0 | 142 | 2 |
| Quadrant | Total seconds | Saturated seconds | Saturation percentage |
|---|---|---|---|
| A | 7029 | 197 | 2.802675% |
| B | 7035 | 176 | 2.501777% |
| C | 7031 | 123 | 1.749396% |
| D | 7022 | 199 | 2.833950% |
Noise dominated data is calculated using 1-second bins in cleaned event files. If a bin has >2000 counts, and if more than 50% of those come from <1% of pixels, then it is considered to be noise-dominated and hence unusable.
| Quadrant | # 1 sec bins | Bins with >0 counts | Bins with >2000 counts | High rate bins dominated by noise | Noise dominated (total time) | Noise dominated (detector-on time) | Marked lightcurve |
|---|---|---|---|---|---|---|---|
| A | 7087 | 7058 | 3 | 3 | 0.04% | 0.04% | 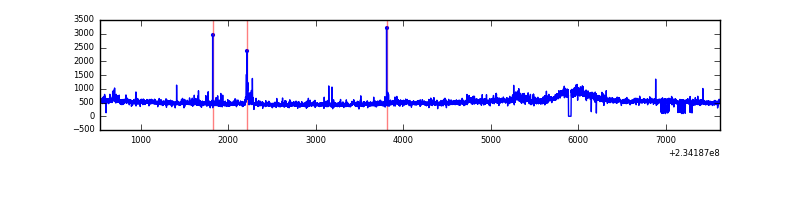 |
| B | 7087 | 7054 | 5 | 5 | 0.07% | 0.07% | 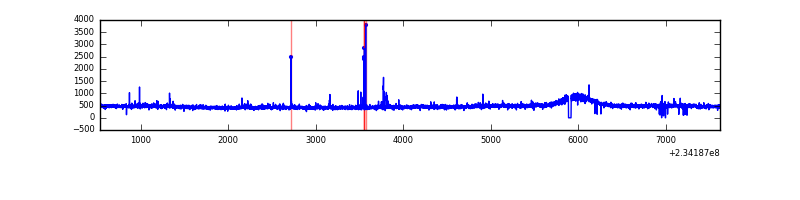 |
| C | 7087 | 7056 | 5 | 5 | 0.07% | 0.07% | 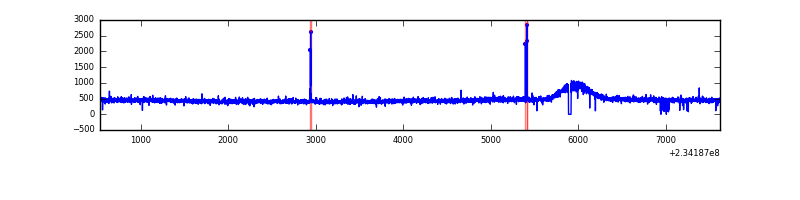 |
| D | 7087 | 7056 | 61 | 61 | 0.86% | 0.86% | 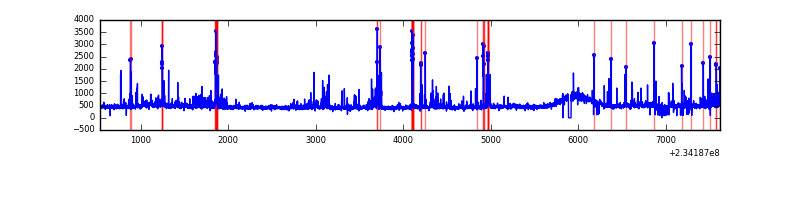 |
Top three noisy pixels from each quadrant. If the there are fewer than three noisy pixels in the level2.evt file, extra rows are filled as -1
| Pixel properties | Quadrant properties | ||||||
|---|---|---|---|---|---|---|---|
| Quadrant | DetID | PixID | Counts | Sigma | Mean | Median | Sigma |
| A | 8 | 5 | 425817 | 2451.66 | 841 | 819 | 173.4 |
| A | 1 | 162 | 18866 | 104.11 | 841 | 819 | 173.4 |
| A | 4 | 2 | 16678 | 91.48 | 841 | 819 | 173.4 |
| B | 0 | 219 | 30782 | 185.36 | 843 | 820 | 161.6 |
| B | 4 | 80 | 22534 | 134.33 | 843 | 820 | 161.6 |
| B | 12 | 111 | 17931 | 105.86 | 843 | 820 | 161.6 |
| C | 14 | 234 | 20766 | 103.58 | 821 | 823 | 192.5 |
| C | 13 | 61 | 6182 | 27.83 | 821 | 823 | 192.5 |
| C | 8 | 128 | 4832 | 20.82 | 821 | 823 | 192.5 |
| D | 10 | 172 | 172225 | 800.96 | 814 | 792 | 214.0 |
| D | 2 | 14 | 157525 | 732.28 | 814 | 792 | 214.0 |
| D | 7 | 71 | 102502 | 475.2 | 814 | 792 | 214.0 |
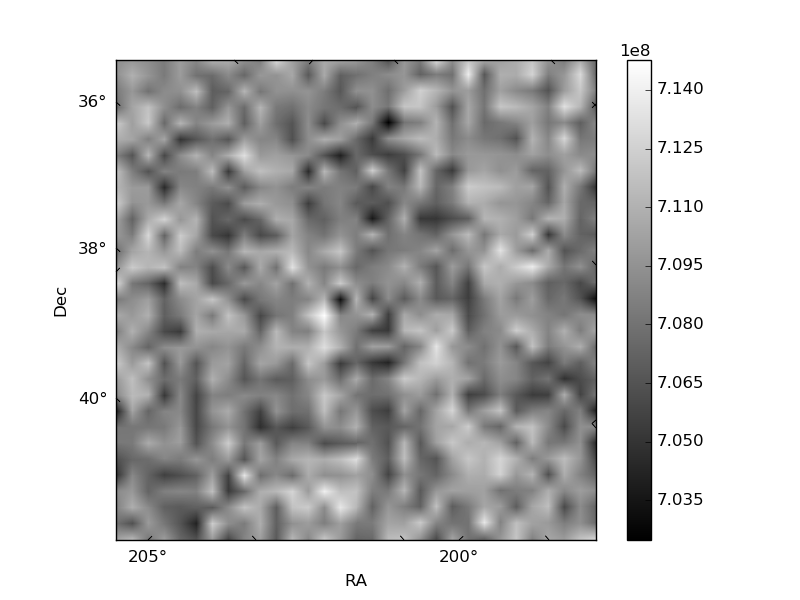
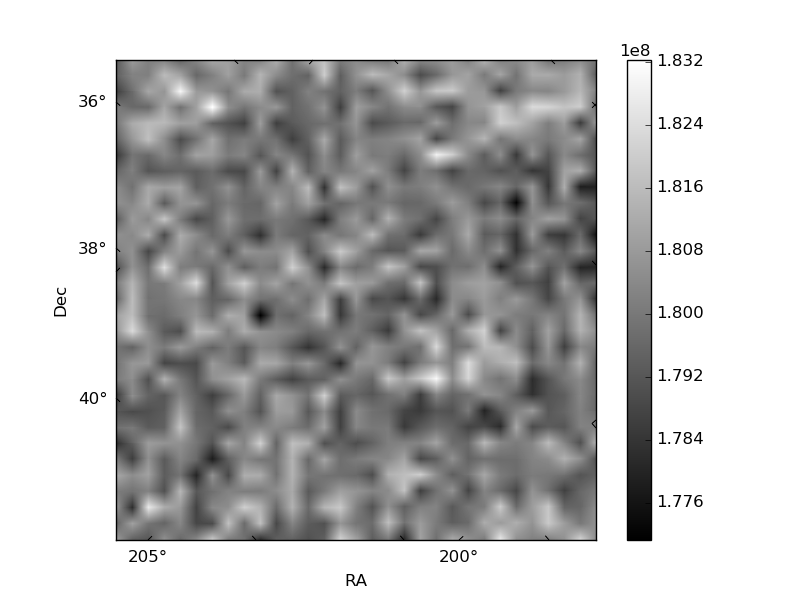
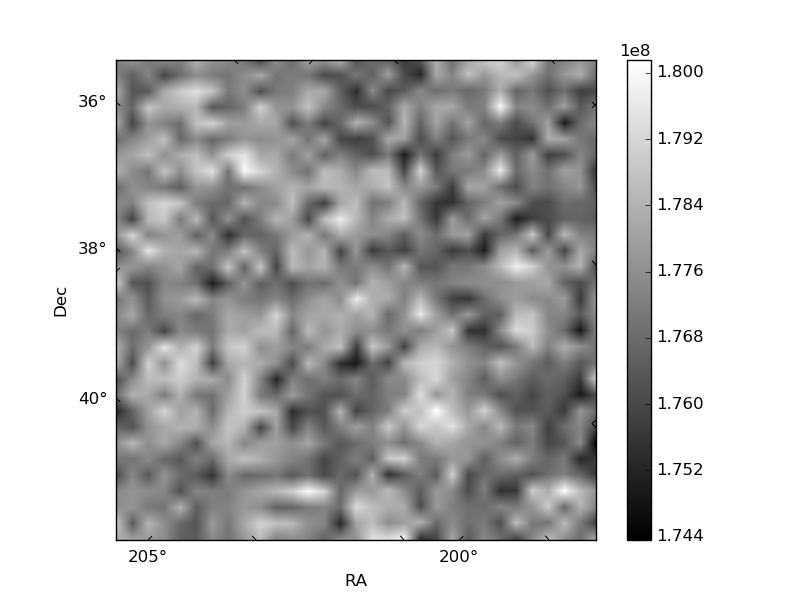
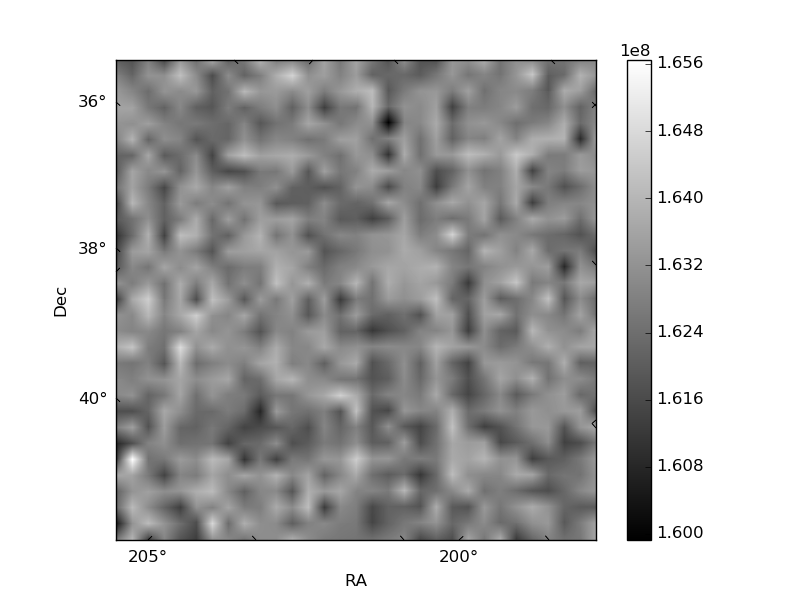
Histogram calculated using DETX and DETY for each event in the final _common_clean file
| Quadrant A | 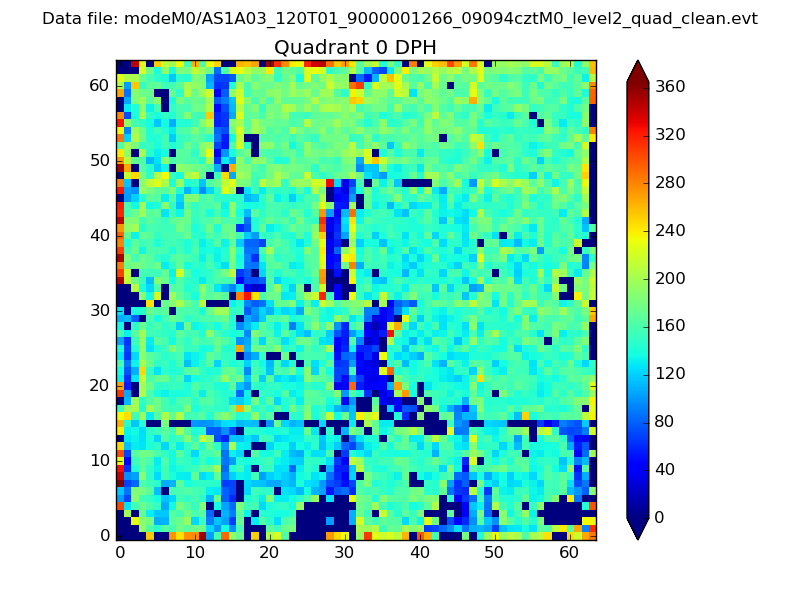 |
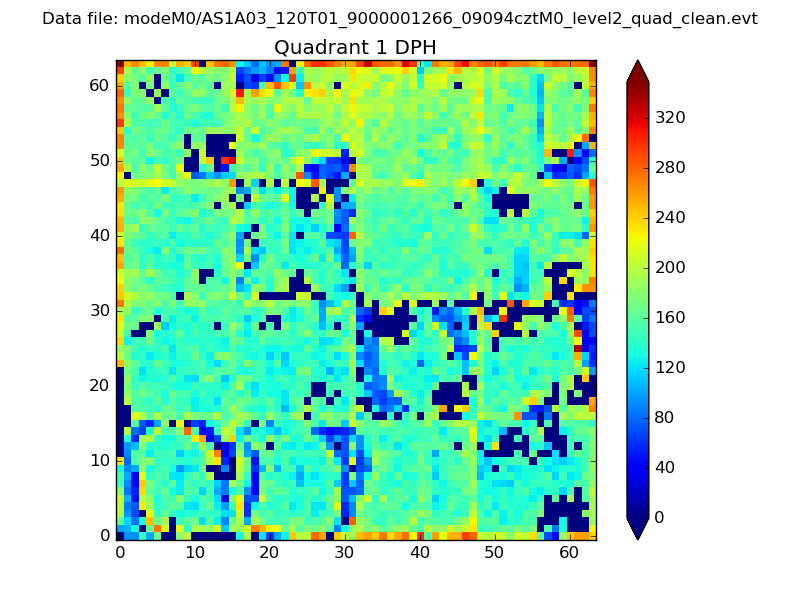 |
Quadrant B |
|---|---|---|---|
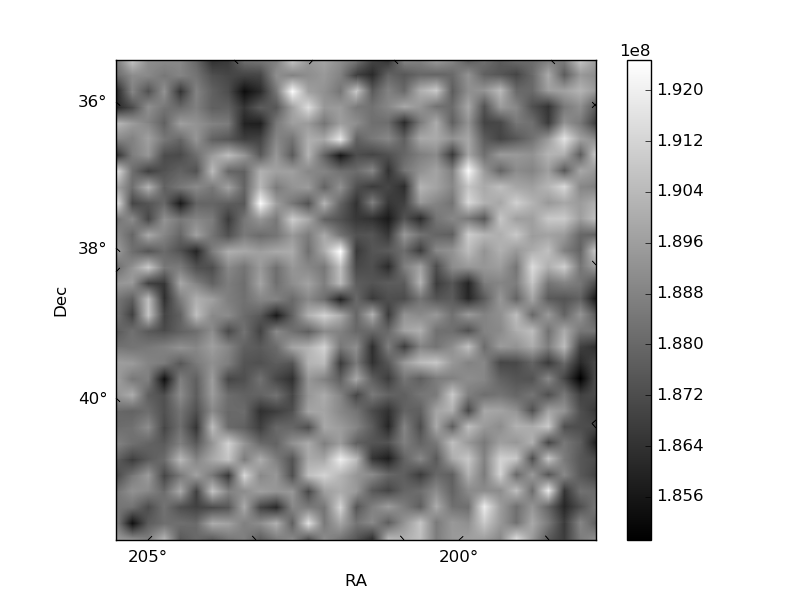
| Quadrant D | 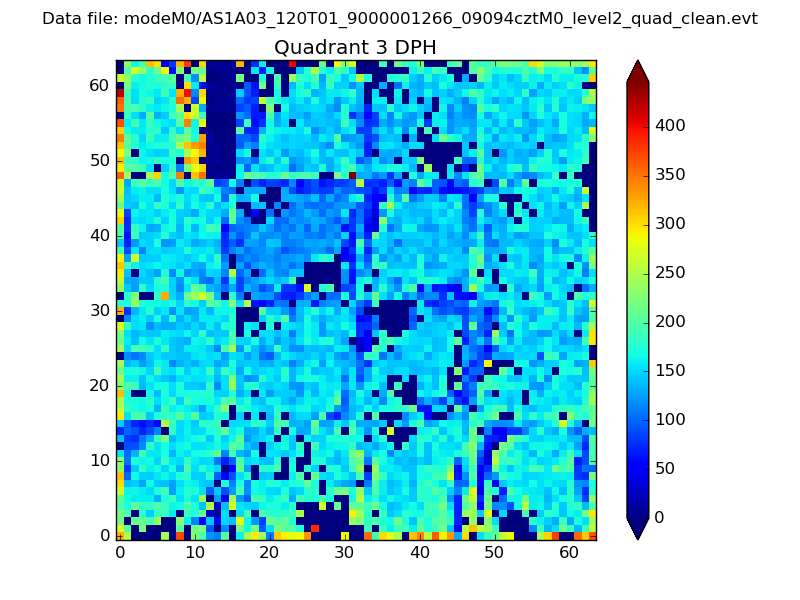 |
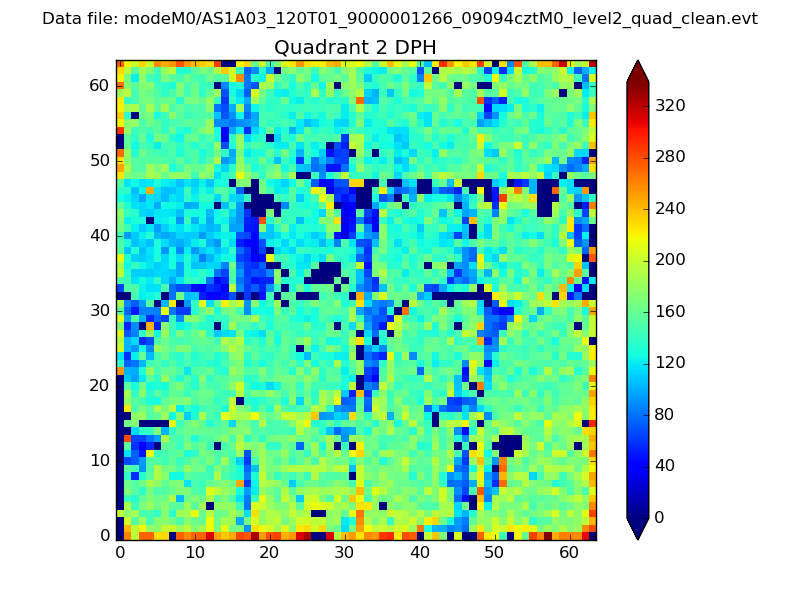 |
Quadrant C |
| Plot type | Count rate plots | Images |
|---|---|---|
| Comparison with Poisson distribution Blue bars denote a histogram of data divided into 1 sec bins. Red curve is a Poisson curve with rate = median count rate of data. |
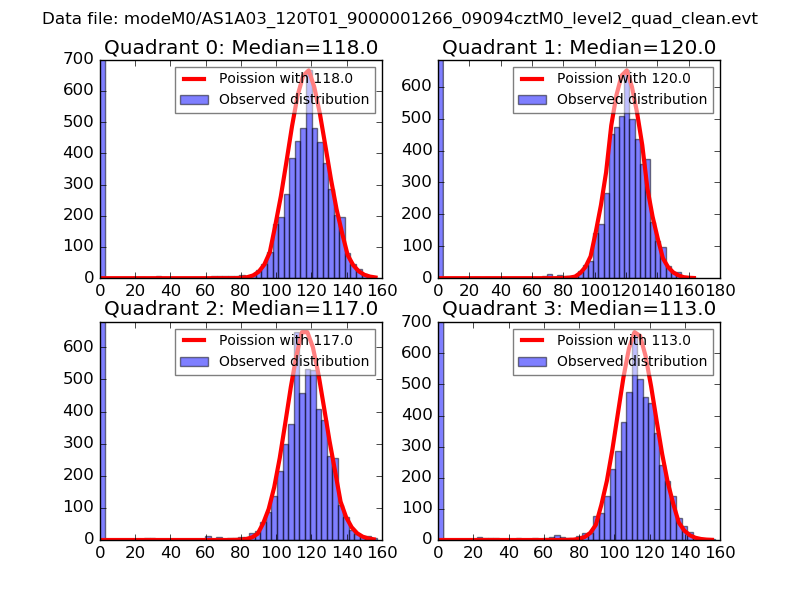 |
 |
| Quadrant-wise count rates Data is divided into 100 sec bins |
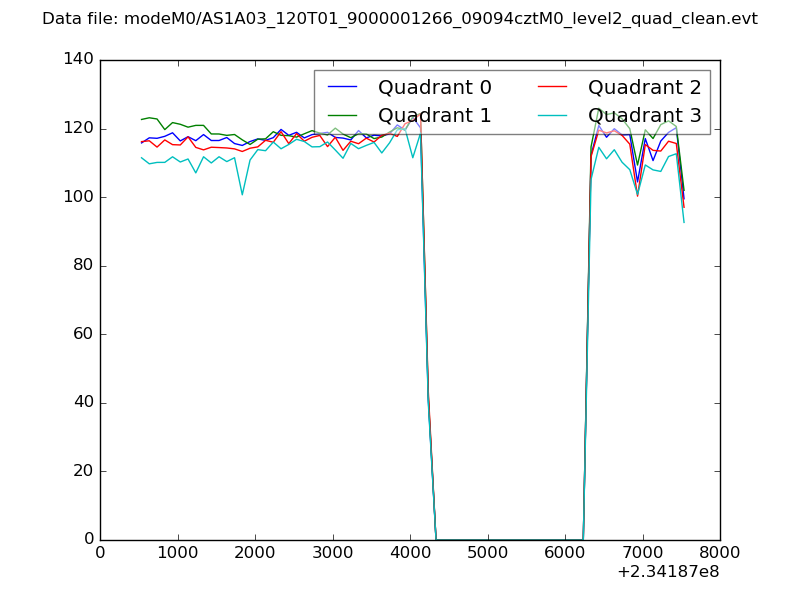 |
|
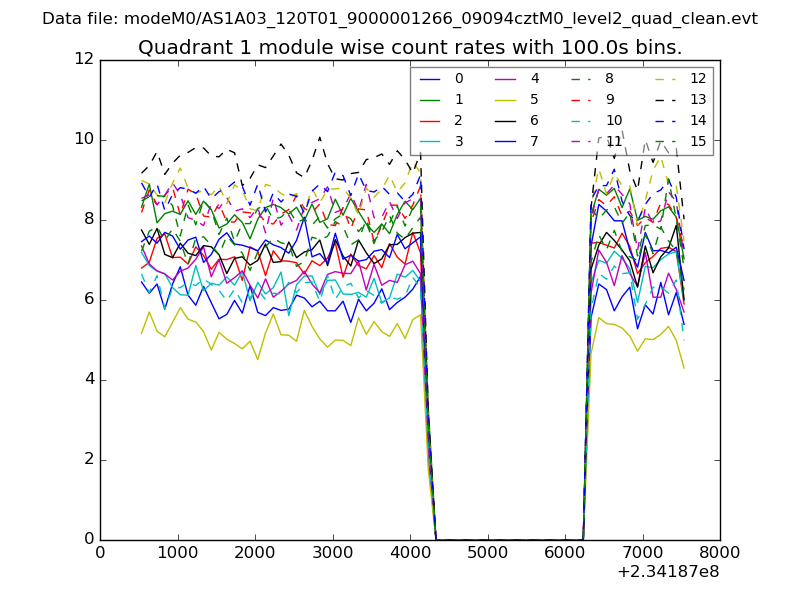
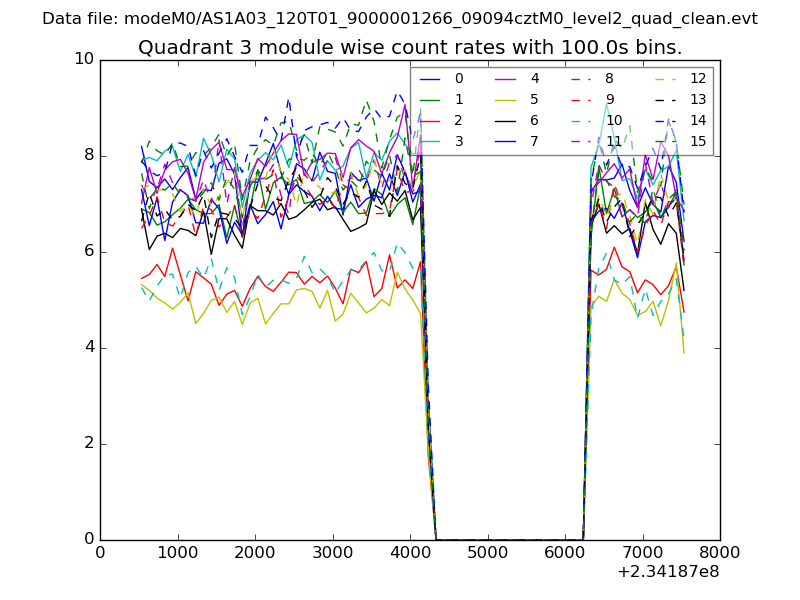
| Module-wise count rates for Quadrant A Data is divided into 100 sec bins |
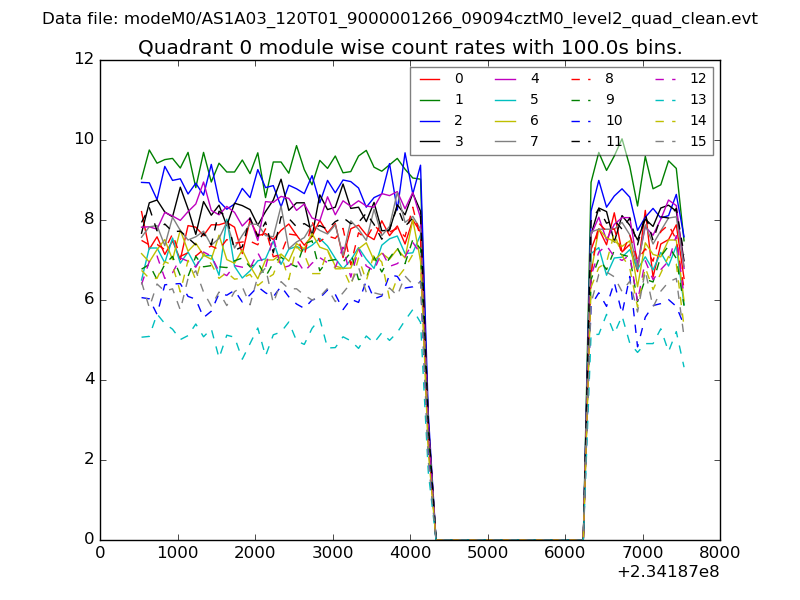 |
 |
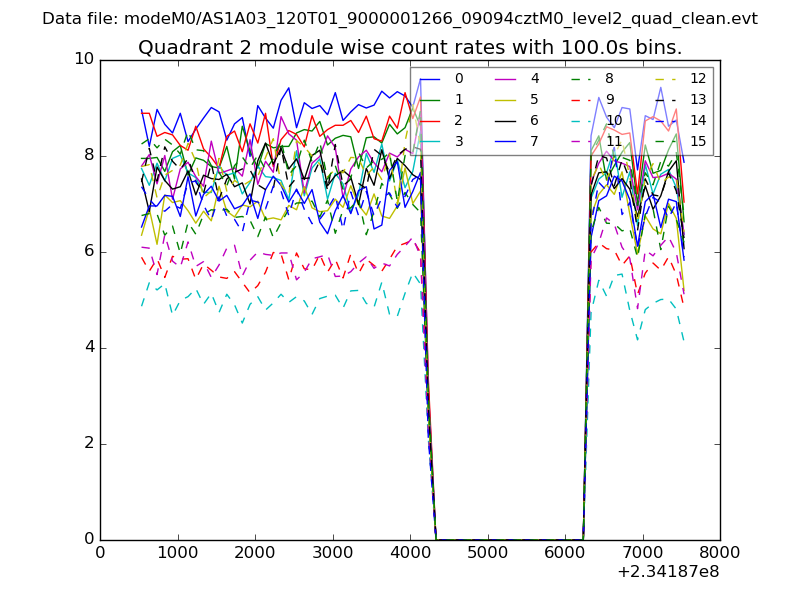
| Module-wise count rates for Quadrant B Data is divided into 100 sec bins |
 |
 |
| Module-wise count rates for Quadrant C Data is divided into 100 sec bins |
 |
 |
| Module-wise count rates for Quadrant D Data is divided into 100 sec bins |
 |
 |
| Parameter | Plot |
|---|---|
| CZT HV Monitor | 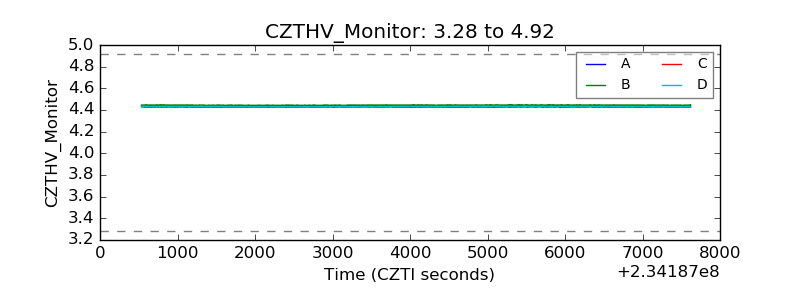 |
| D_VDD | 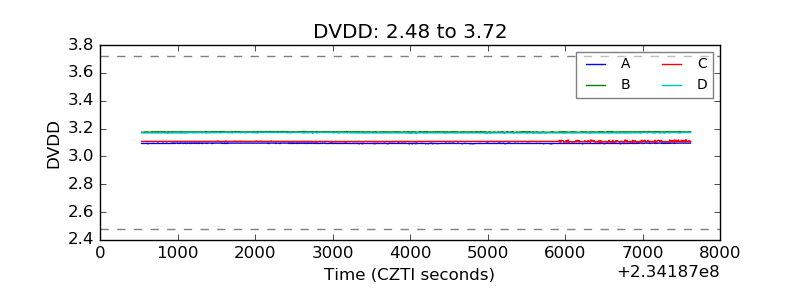 |
| Temperature 1 | 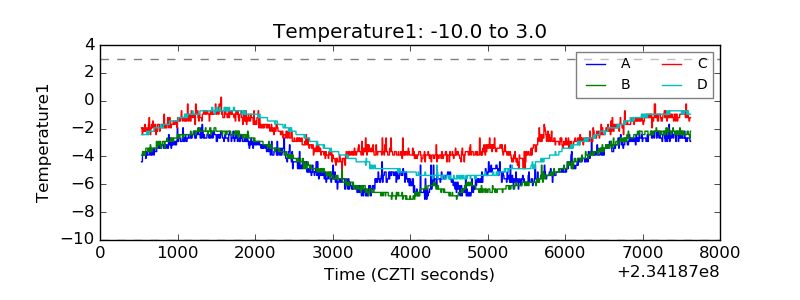 |
| Veto HV Monitor | 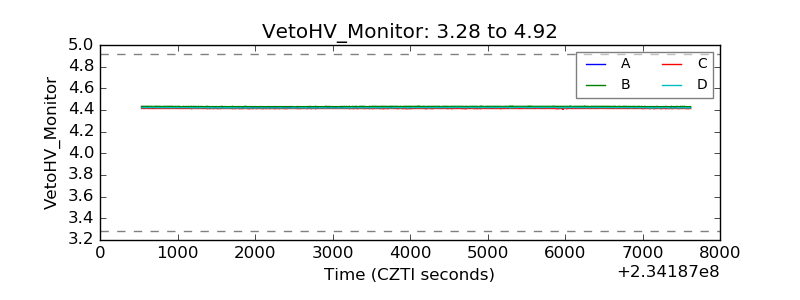 |
| Veto LLD | 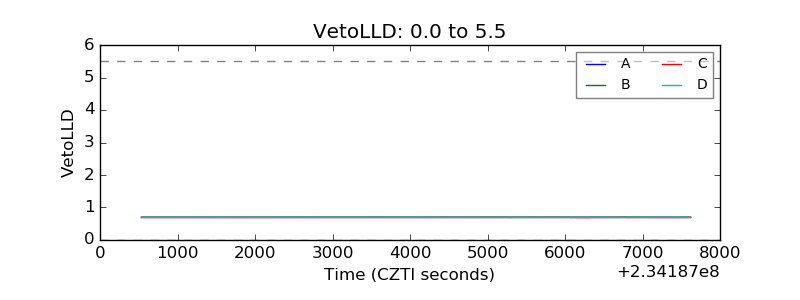 |
| Alpha Counter | 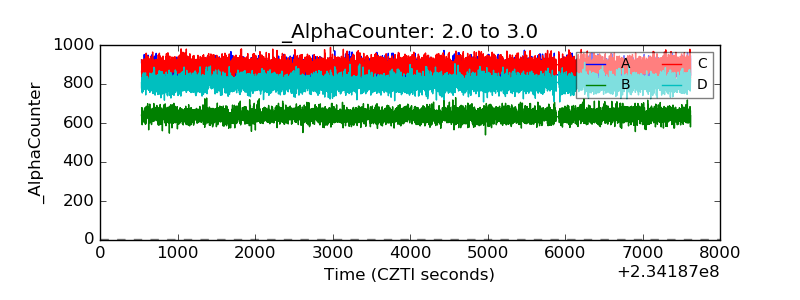 |
| _CPM_Rate | 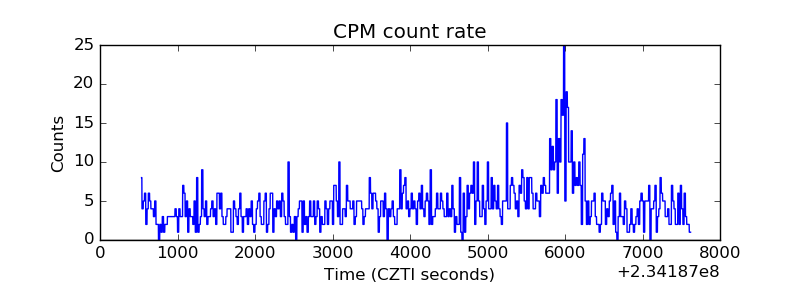 |
| CZT Counter | 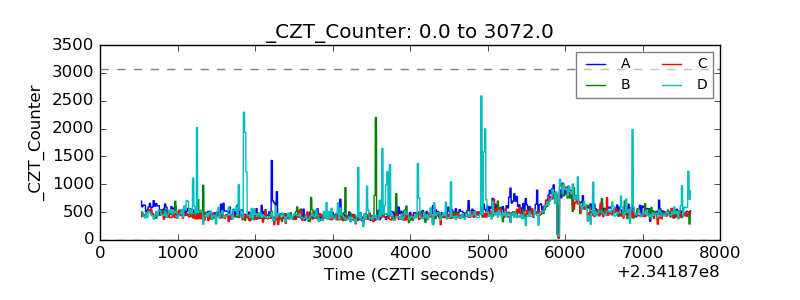 |
| +2.5 Volts monitor |  |
| +5 Volts monitor |  |
| _ROLL_ROT | 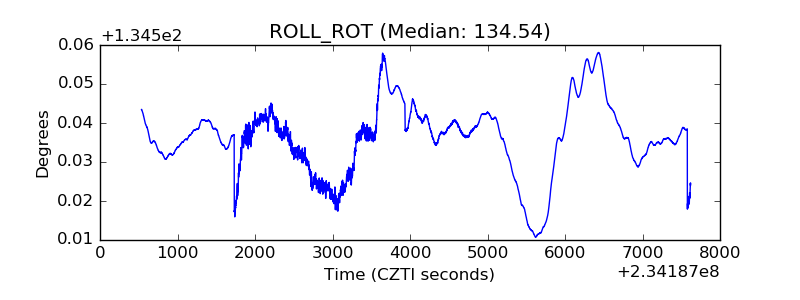 |
| _Roll_DEC | 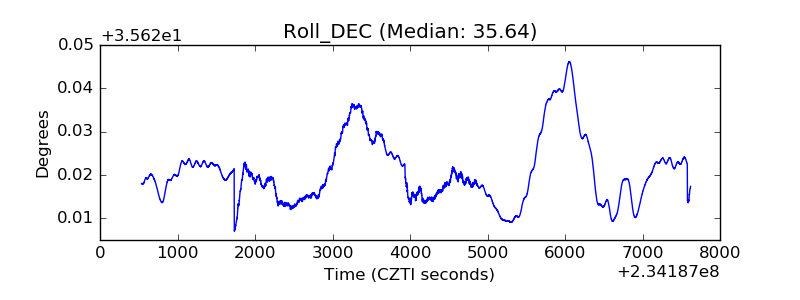 |
| _Roll_RA | 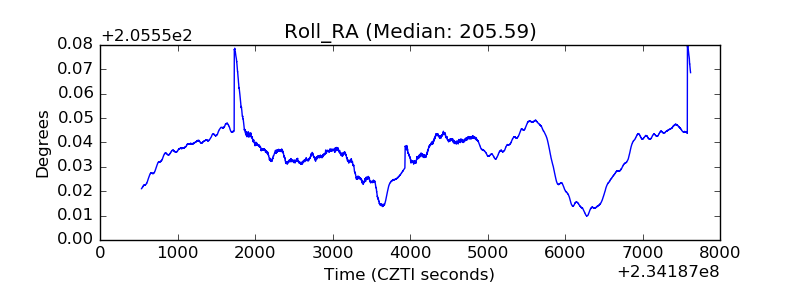 |
| Veto Counter | 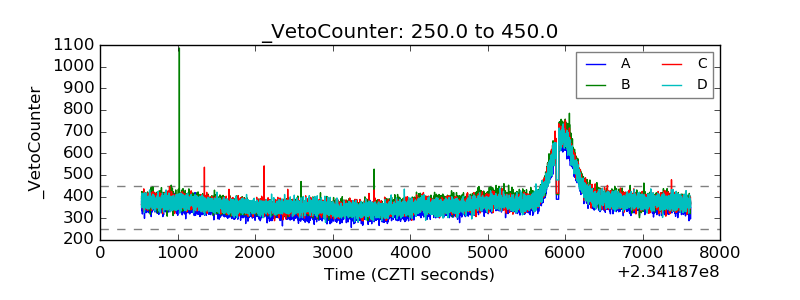 |