| Param | Original file | Final file |
|---|---|---|
| Filename | modeM0/AS1A03_120T01_9000001266_09095cztM0_level2.evt | modeM0/AS1A03_120T01_9000001266_09095cztM0_level2_quad_clean.evt |
| Size (bytes) | 534,240,000 | 92,761,920 |
| Size | 509.5 MB | 88.5 MB |
| Events in quadrant A | 3,535,036 | 593,781 |
| Events in quadrant B | 3,371,448 | 600,598 |
| Events in quadrant C | 4,939,105 | 563,178 |
| Events in quadrant D | 3,857,058 | 562,412 |
| Mode M9 | |||
|---|---|---|---|
| Quadrant | BADHDUFLAG | Total packets | Discarded packets |
| A | 0 | 2 | 0 |
| B | 0 | 2 | 0 |
| C | 0 | 2 | 0 |
| D | 0 | 2 | 0 |
| Mode M0 | |||
|---|---|---|---|
| Quadrant | BADHDUFLAG | Total packets | Discarded packets |
| A | 0 | 14749 | 8 |
| B | 0 | 14750 | 11 |
| C | 0 | 19748 | 39 |
| D | 0 | 16384 | 24 |
| Mode SS | |||
|---|---|---|---|
| Quadrant | BADHDUFLAG | Total packets | Discarded packets |
| A | 0 | 144 | 0 |
| B | 0 | 144 | 0 |
| C | 0 | 144 | 0 |
| D | 0 | 144 | 0 |
| Quadrant | Total seconds | Saturated seconds | Saturation percentage |
|---|---|---|---|
| A | 7018 | 99 | 1.410658% |
| B | 7017 | 95 | 1.353855% |
| C | 7015 | 970 | 13.827512% |
| D | 7013 | 200 | 2.851847% |
Noise dominated data is calculated using 1-second bins in cleaned event files. If a bin has >2000 counts, and if more than 50% of those come from <1% of pixels, then it is considered to be noise-dominated and hence unusable.
| Quadrant | # 1 sec bins | Bins with >0 counts | Bins with >2000 counts | High rate bins dominated by noise | Noise dominated (total time) | Noise dominated (detector-on time) | Marked lightcurve |
|---|---|---|---|---|---|---|---|
| A | 7281 | 7021 | 5 | 5 | 0.07% | 0.07% | 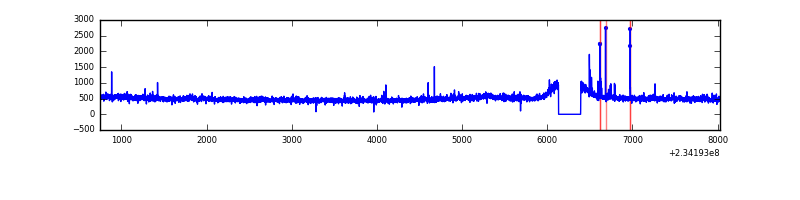 |
| B | 7281 | 7022 | 3 | 3 | 0.04% | 0.04% | 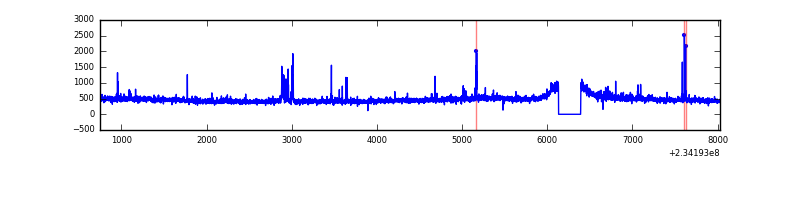 |
| C | 7281 | 7017 | 840 | 840 | 11.54% | 11.97% | 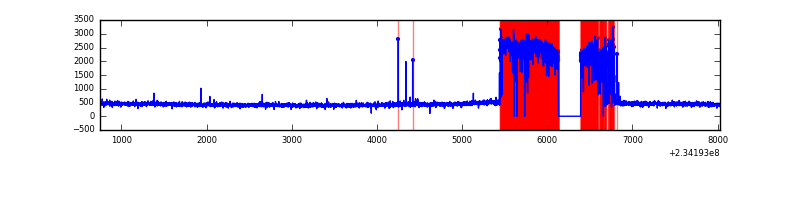 |
| D | 7281 | 7022 | 88 | 88 | 1.21% | 1.25% | 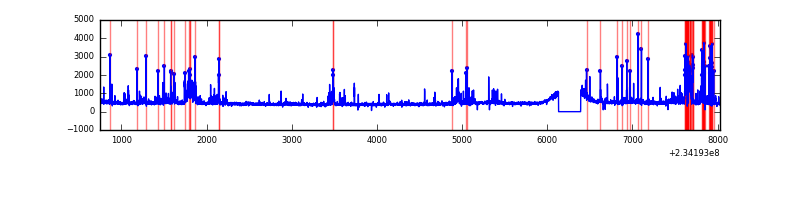 |
Top three noisy pixels from each quadrant. If the there are fewer than three noisy pixels in the level2.evt file, extra rows are filled as -1
| Pixel properties | Quadrant properties | ||||||
|---|---|---|---|---|---|---|---|
| Quadrant | DetID | PixID | Counts | Sigma | Mean | Median | Sigma |
| A | 8 | 5 | 283697 | 1654.48 | 827 | 807 | 171.0 |
| A | 5 | 16 | 34127 | 194.87 | 827 | 807 | 171.0 |
| A | 1 | 162 | 18239 | 101.95 | 827 | 807 | 171.0 |
| B | 4 | 173 | 50159 | 309.66 | 829 | 809 | 159.4 |
| B | 0 | 219 | 36270 | 222.51 | 829 | 809 | 159.4 |
| B | 4 | 48 | 28730 | 175.2 | 829 | 809 | 159.4 |
| C | 14 | 234 | 2128316 | 12725.08 | 714 | 717 | 167.2 |
| C | 8 | 128 | 10456 | 58.25 | 714 | 717 | 167.2 |
| C | 8 | 112 | 5657 | 29.55 | 714 | 717 | 167.2 |
| D | 10 | 172 | 371877 | 1713.86 | 797 | 778 | 216.5 |
| D | 7 | 71 | 116376 | 533.87 | 797 | 778 | 216.5 |
| D | 12 | 233 | 94465 | 432.68 | 797 | 778 | 216.5 |
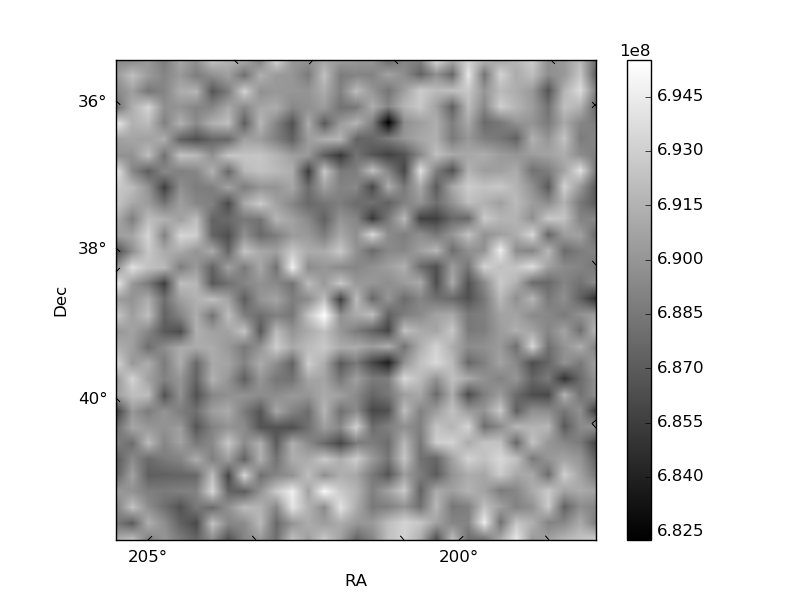
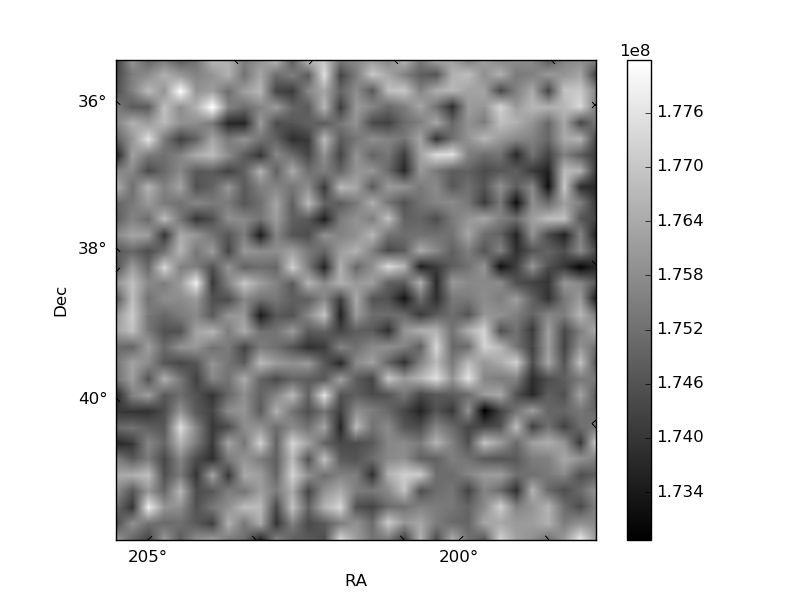
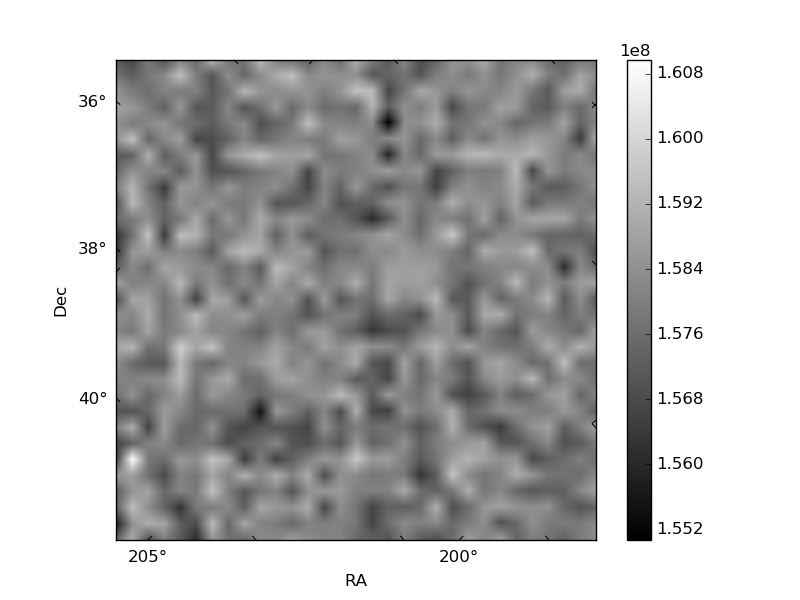
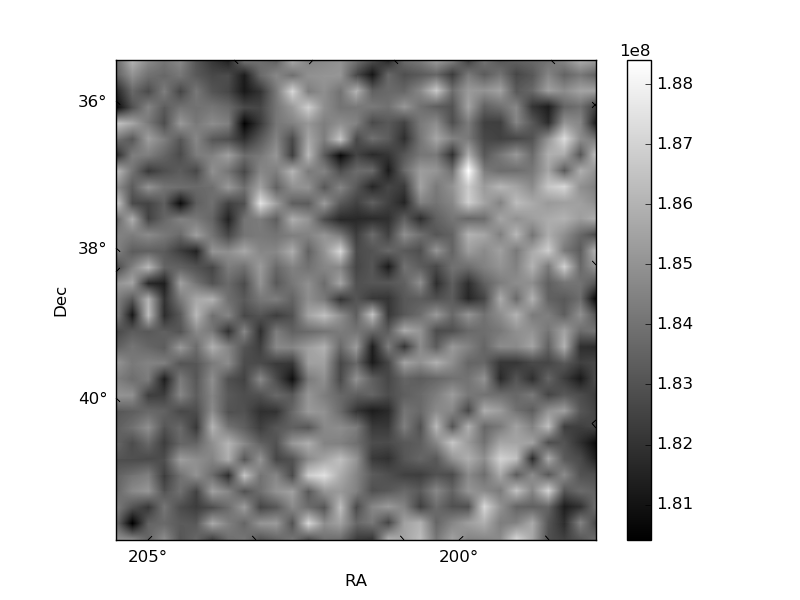
Histogram calculated using DETX and DETY for each event in the final _common_clean file
| Quadrant A | 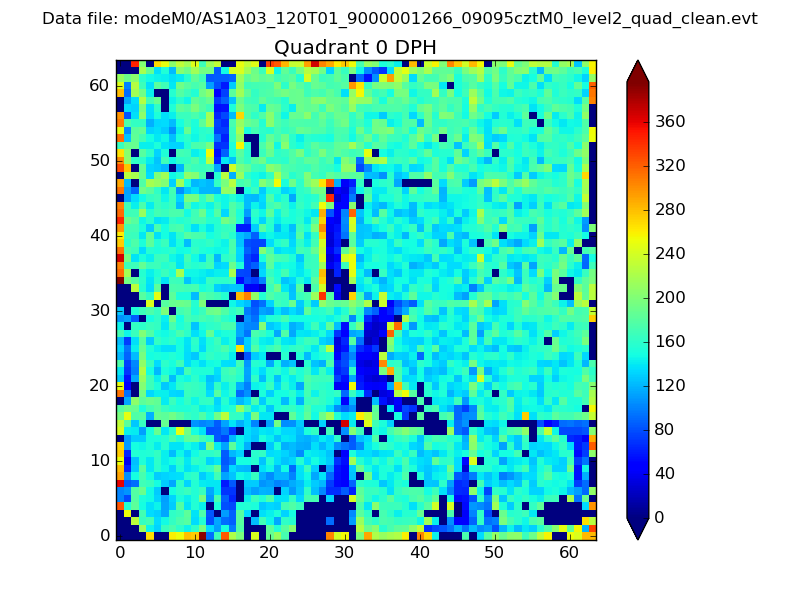 |
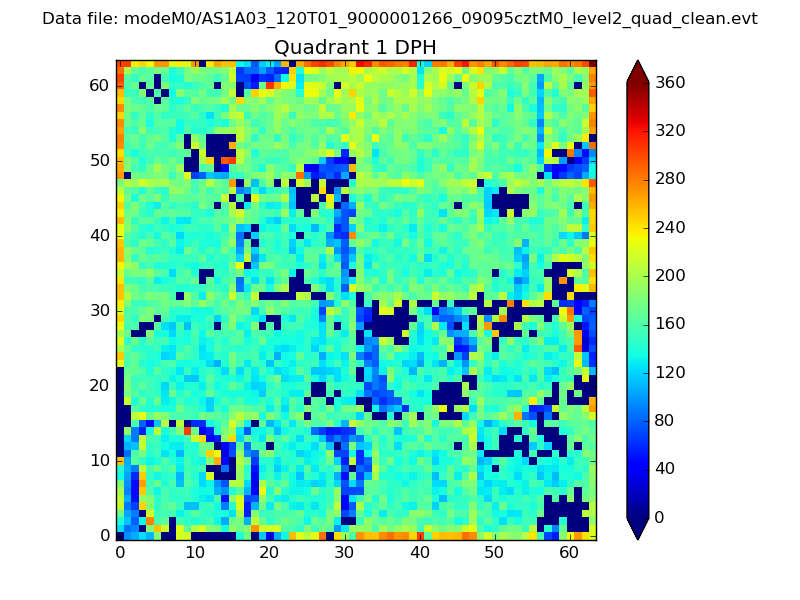 |
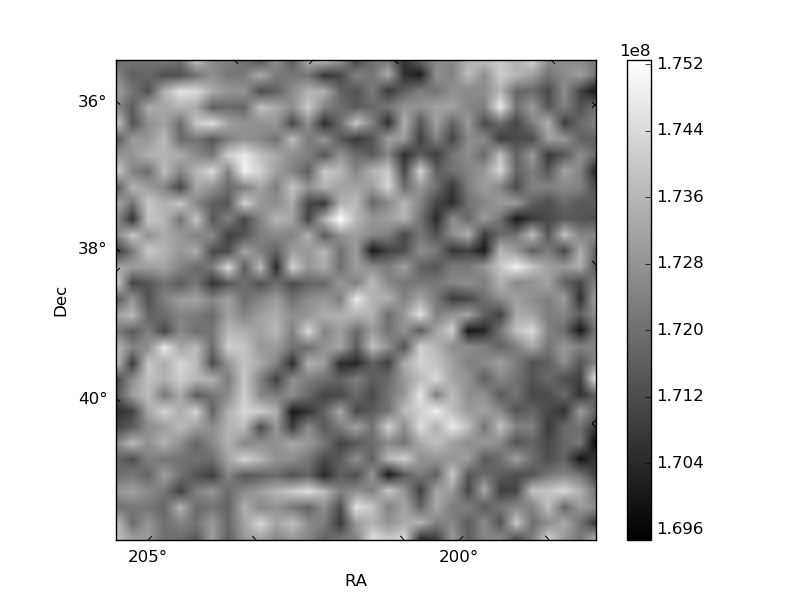
Quadrant B |
|---|---|---|---|
| Quadrant D | 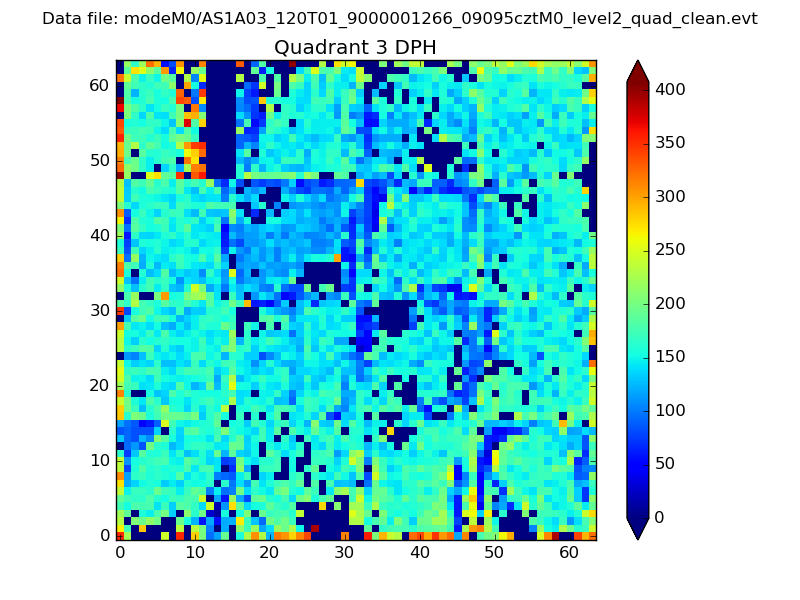 |
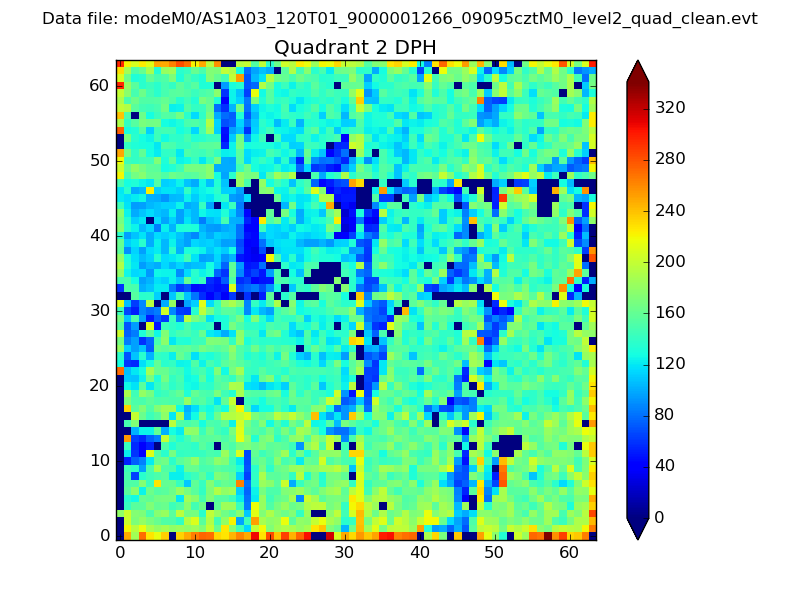 |
Quadrant C |
| Plot type | Count rate plots | Images |
|---|---|---|
| Comparison with Poisson distribution Blue bars denote a histogram of data divided into 1 sec bins. Red curve is a Poisson curve with rate = median count rate of data. |
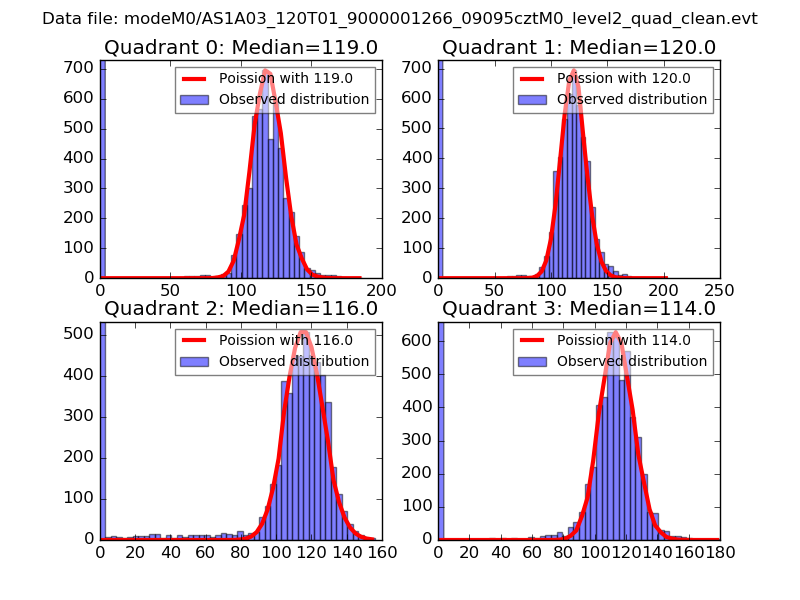 |
 |
| Quadrant-wise count rates Data is divided into 100 sec bins |
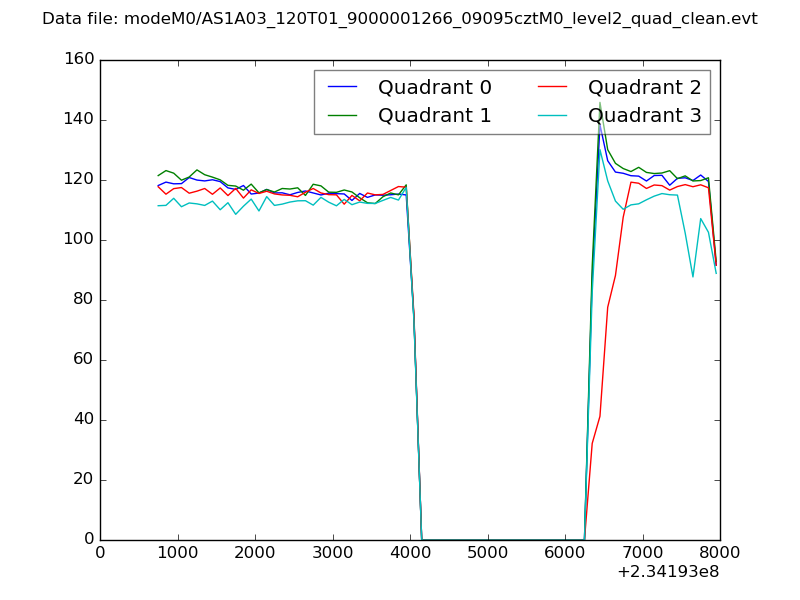 |
|
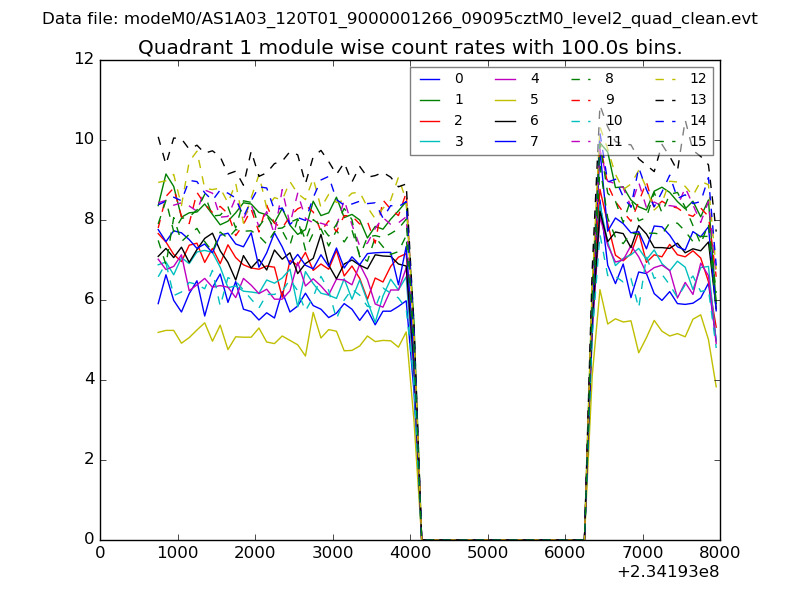
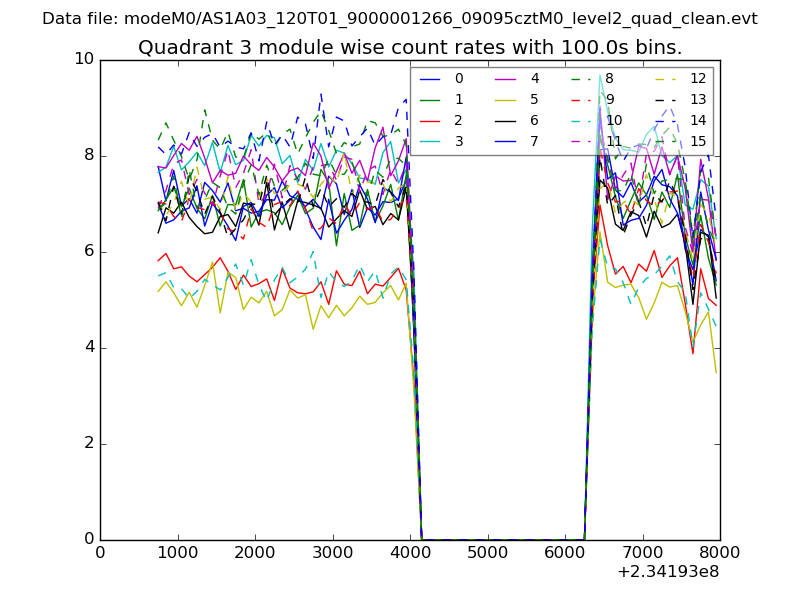
| Module-wise count rates for Quadrant A Data is divided into 100 sec bins |
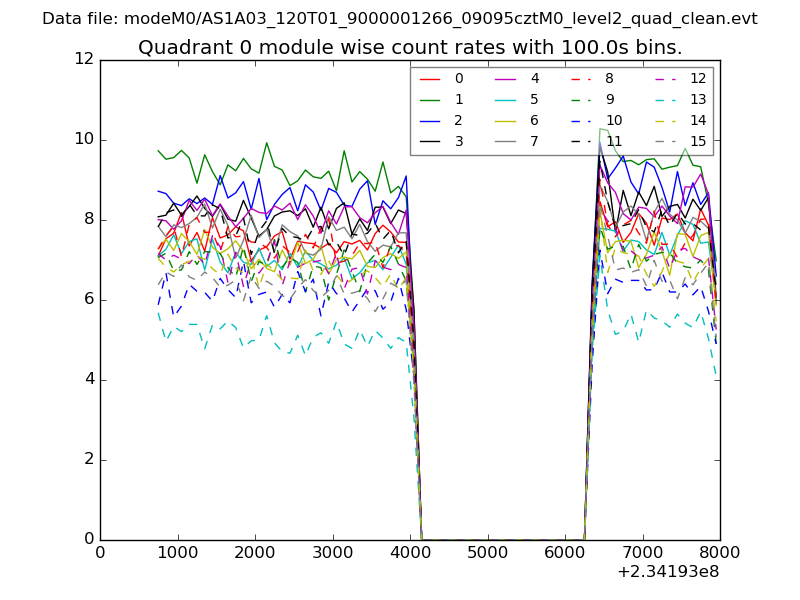 |
 |
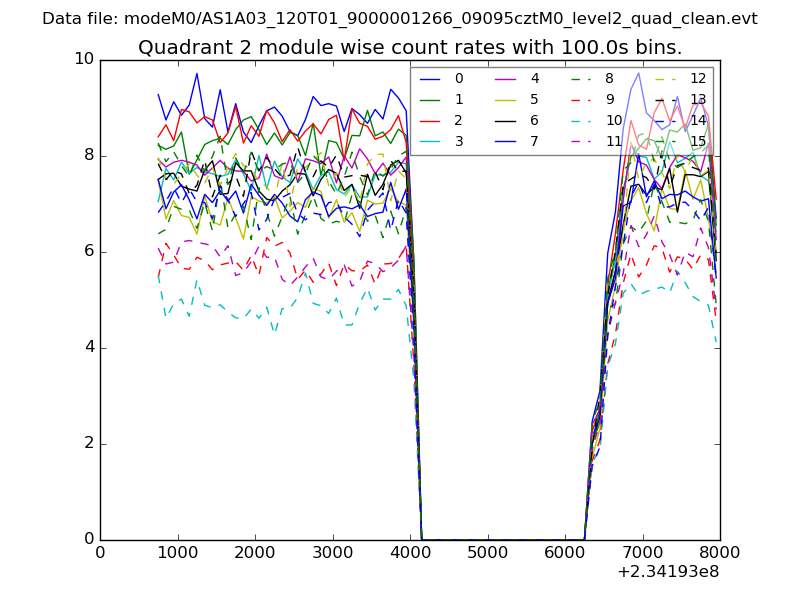
| Module-wise count rates for Quadrant B Data is divided into 100 sec bins |
 |
 |
| Module-wise count rates for Quadrant C Data is divided into 100 sec bins |
 |
 |
| Module-wise count rates for Quadrant D Data is divided into 100 sec bins |
 |
 |
| Parameter | Plot |
|---|---|
| CZT HV Monitor | 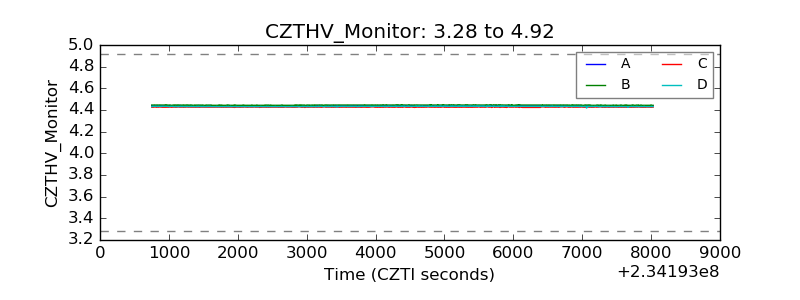 |
| D_VDD | 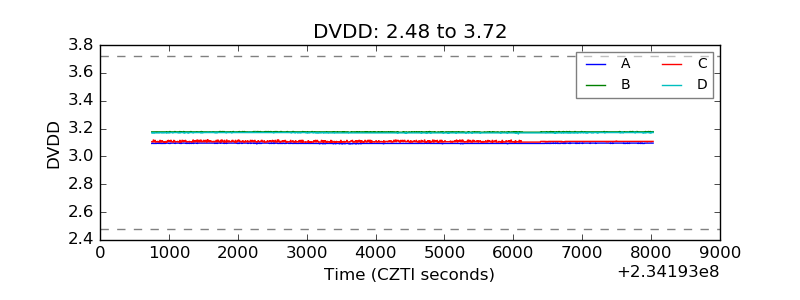 |
| Temperature 1 | 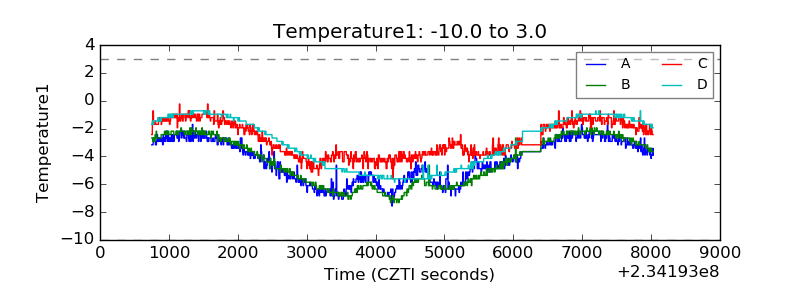 |
| Veto HV Monitor | 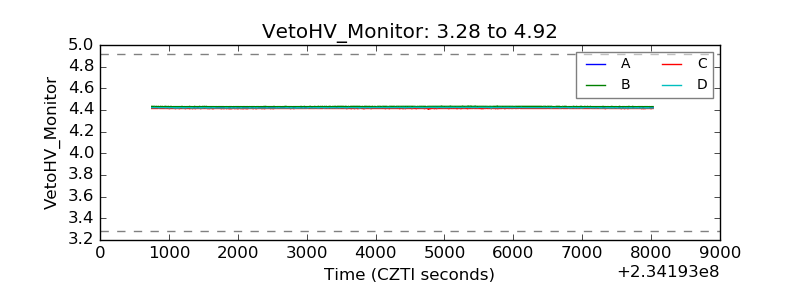 |
| Veto LLD | 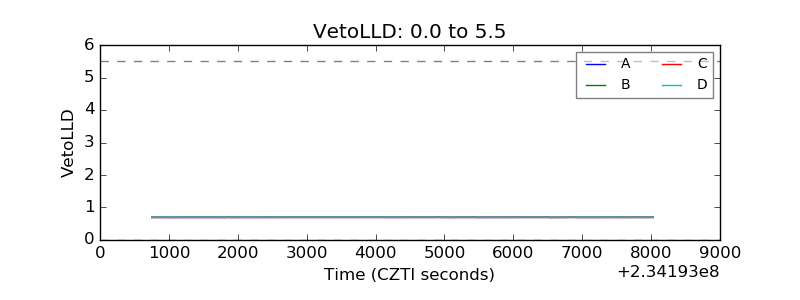 |
| Alpha Counter | 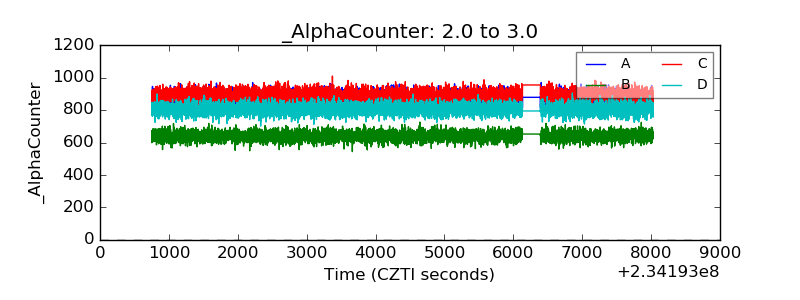 |
| _CPM_Rate | 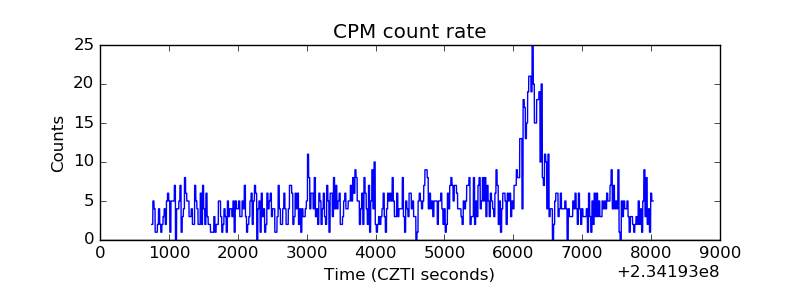 |
| CZT Counter | 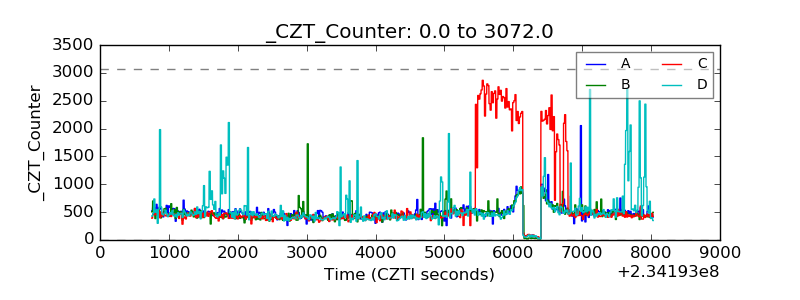 |
| +2.5 Volts monitor |  |
| +5 Volts monitor |  |
| _ROLL_ROT | 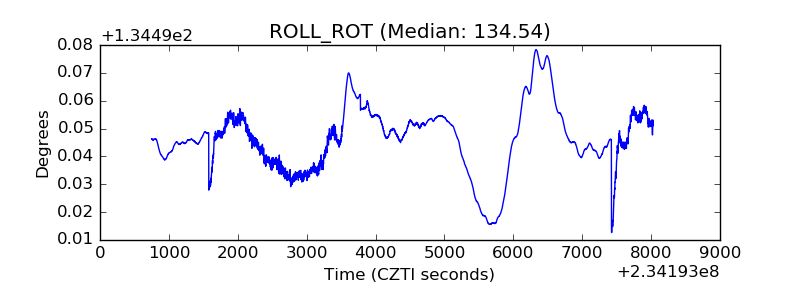 |
| _Roll_DEC | 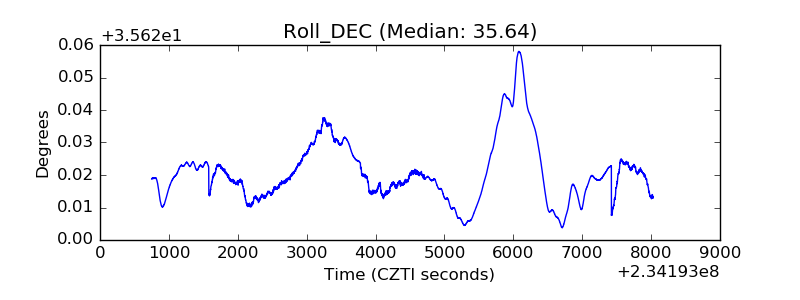 |
| _Roll_RA | 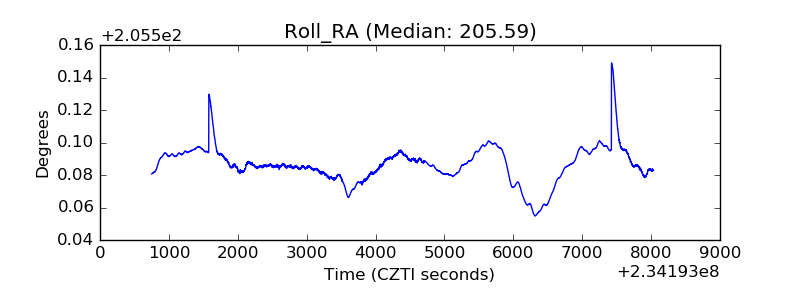 |
| Veto Counter | 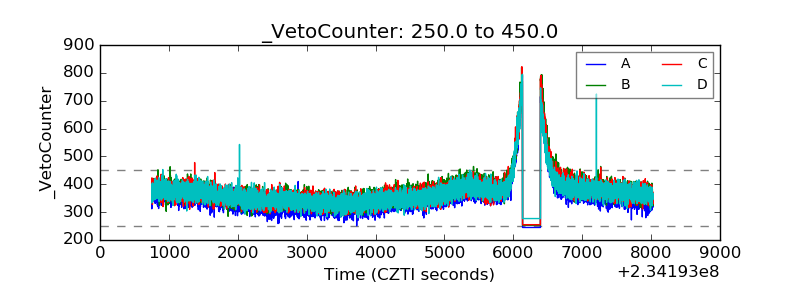 |