| Param | Original file | Final file |
|---|---|---|
| Filename | modeM0/AS1A03_120T01_9000001266_09098cztM0_level2.evt | modeM0/AS1A03_120T01_9000001266_09098cztM0_level2_quad_clean.evt |
| Size (bytes) | 1,303,738,560 | 224,648,640 |
| Size | 1.2 GB | 214.2 MB |
| Events in quadrant A | 9,186,955 | 1,410,905 |
| Events in quadrant B | 8,512,027 | 1,429,335 |
| Events in quadrant C | 8,211,222 | 1,408,718 |
| Events in quadrant D | 12,354,351 | 1,311,360 |
| Mode M9 | |||
|---|---|---|---|
| Quadrant | BADHDUFLAG | Total packets | Discarded packets |
| A | 0 | 20 | 0 |
| B | 0 | 20 | 0 |
| C | 0 | 20 | 0 |
| D | 0 | 20 | 0 |
| Mode M0 | |||
|---|---|---|---|
| Quadrant | BADHDUFLAG | Total packets | Discarded packets |
| A | 0 | 38992 | 4 |
| B | 0 | 37655 | 7 |
| C | 0 | 37427 | 7 |
| D | 0 | 49288 | 3 |
| Mode SS | |||
|---|---|---|---|
| Quadrant | BADHDUFLAG | Total packets | Discarded packets |
| A | 0 | 368 | 0 |
| B | 0 | 368 | 0 |
| C | 0 | 368 | 0 |
| D | 0 | 368 | 0 |
| Quadrant | Total seconds | Saturated seconds | Saturation percentage |
|---|---|---|---|
| A | 18035 | 179 | 0.992515% |
| B | 18033 | 171 | 0.948262% |
| C | 18033 | 163 | 0.903898% |
| D | 18035 | 1246 | 6.908788% |
Noise dominated data is calculated using 1-second bins in cleaned event files. If a bin has >2000 counts, and if more than 50% of those come from <1% of pixels, then it is considered to be noise-dominated and hence unusable.
| Quadrant | # 1 sec bins | Bins with >0 counts | Bins with >2000 counts | High rate bins dominated by noise | Noise dominated (total time) | Noise dominated (detector-on time) | Marked lightcurve |
|---|---|---|---|---|---|---|---|
| A | 20045 | 18035 | 14 | 14 | 0.07% | 0.08% | 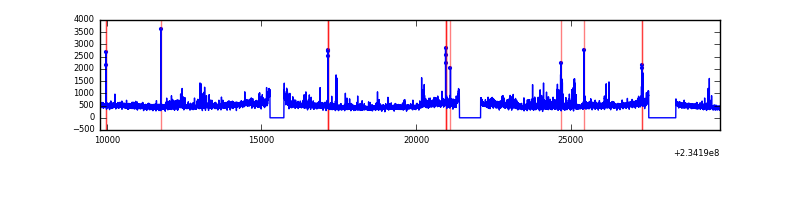 |
| B | 20045 | 18036 | 23 | 23 | 0.11% | 0.13% | 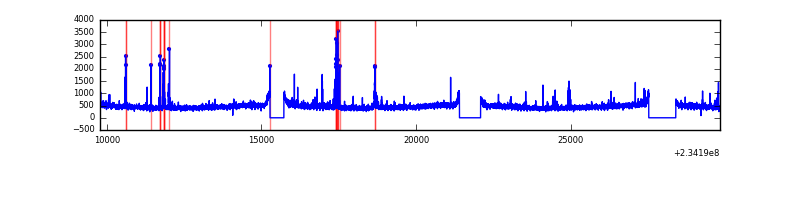 |
| C | 20045 | 18037 | 70 | 70 | 0.35% | 0.39% | 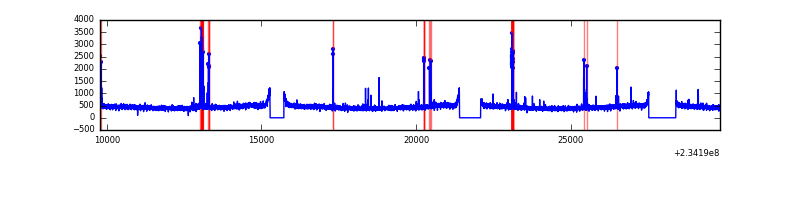 |
| D | 20045 | 18037 | 999 | 999 | 4.98% | 5.54% | 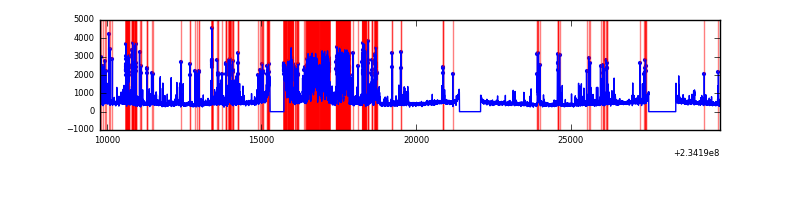 |
Top three noisy pixels from each quadrant. If the there are fewer than three noisy pixels in the level2.evt file, extra rows are filled as -1
| Pixel properties | Quadrant properties | ||||||
|---|---|---|---|---|---|---|---|
| Quadrant | DetID | PixID | Counts | Sigma | Mean | Median | Sigma |
| A | 8 | 5 | 741226 | 1737.4 | 2076 | 2030 | 425.5 |
| A | 1 | 162 | 202062 | 470.15 | 2076 | 2030 | 425.5 |
| A | 1 | 178 | 68420 | 156.04 | 2076 | 2030 | 425.5 |
| B | 4 | 48 | 206211 | 516.96 | 2082 | 2029 | 395.0 |
| B | 4 | 173 | 75110 | 185.03 | 2082 | 2029 | 395.0 |
| B | 0 | 219 | 68071 | 167.21 | 2082 | 2029 | 395.0 |
| C | 14 | 234 | 292173 | 618.39 | 2025 | 2037 | 469.2 |
| C | 12 | 4 | 16187 | 30.16 | 2025 | 2037 | 469.2 |
| C | 13 | 61 | 15231 | 28.12 | 2025 | 2037 | 469.2 |
| D | 12 | 233 | 2963291 | 5679.57 | 1965 | 1915 | 521.4 |
| D | 10 | 172 | 431143 | 823.21 | 1965 | 1915 | 521.4 |
| D | 2 | 14 | 406075 | 775.13 | 1965 | 1915 | 521.4 |
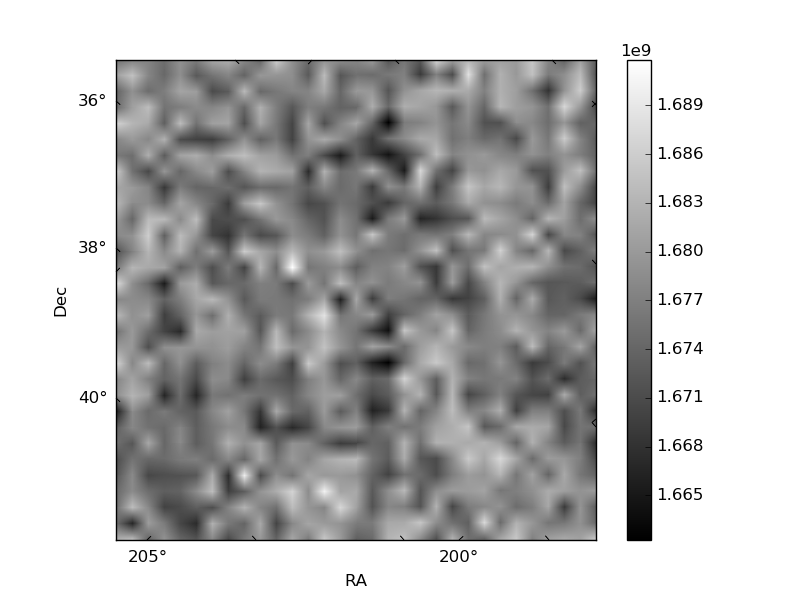
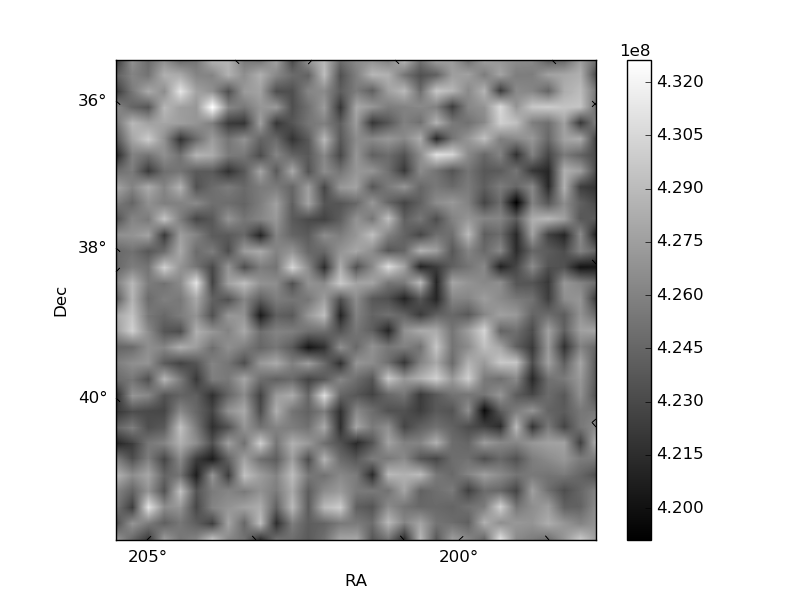
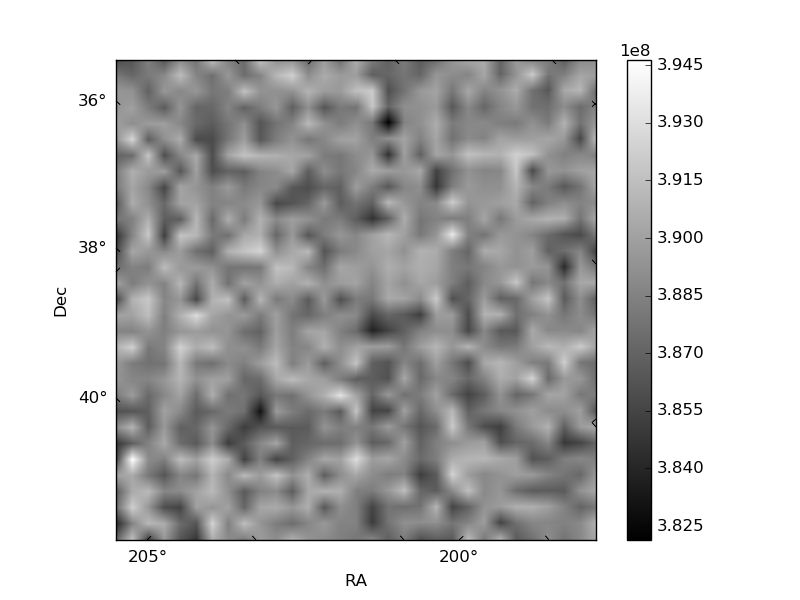
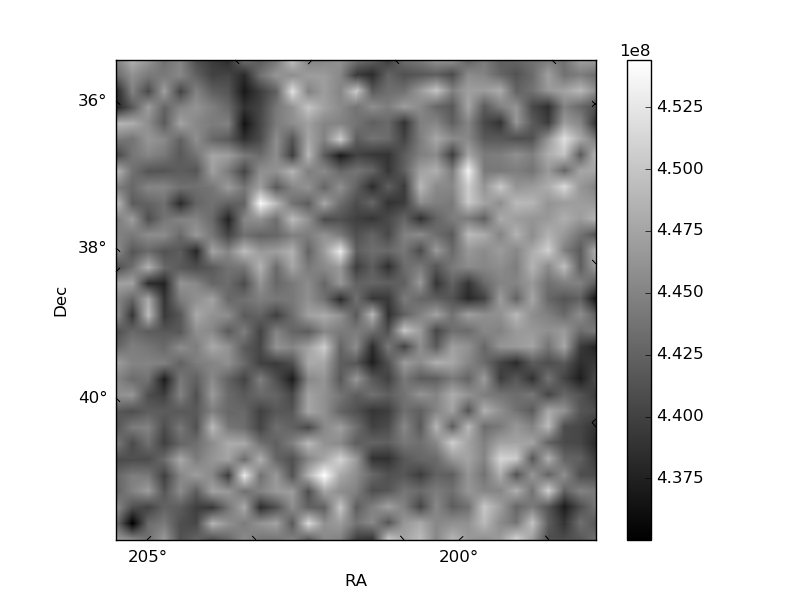
Histogram calculated using DETX and DETY for each event in the final _common_clean file
| Quadrant A | 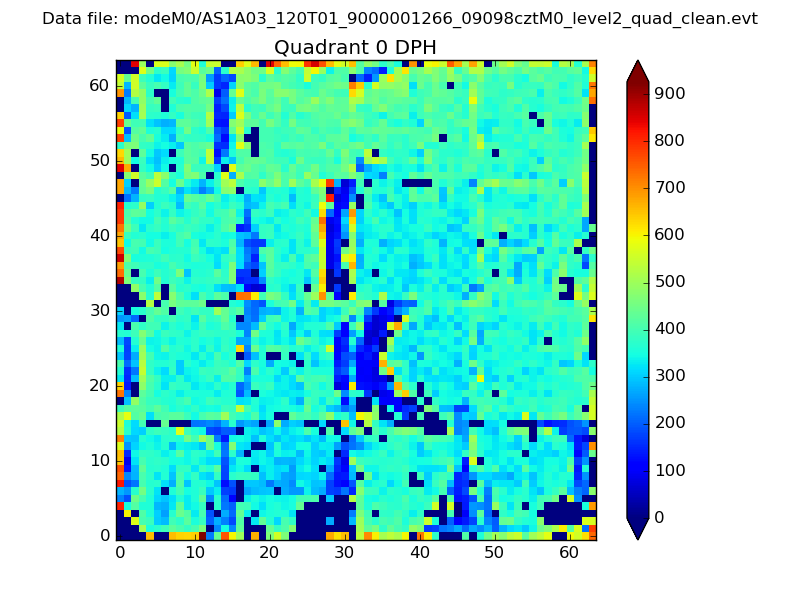 |
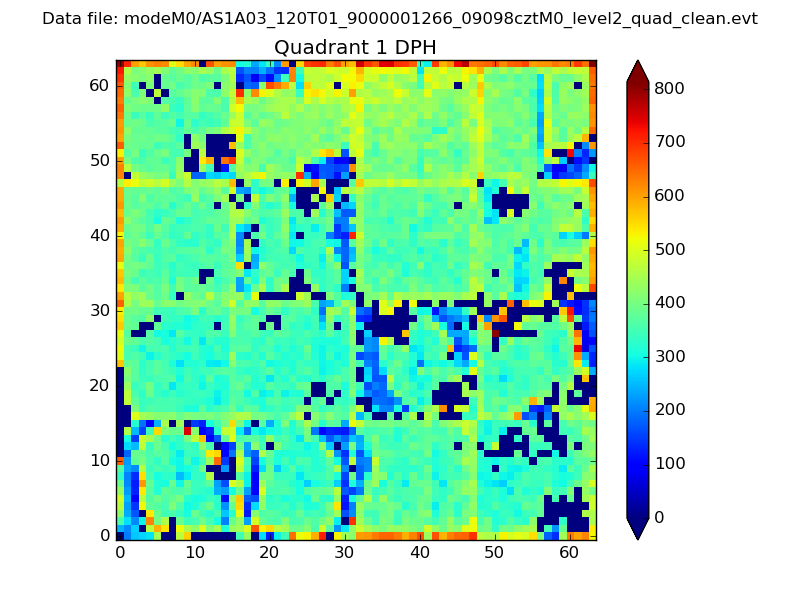 |
Quadrant B |
|---|---|---|---|
| Quadrant D | 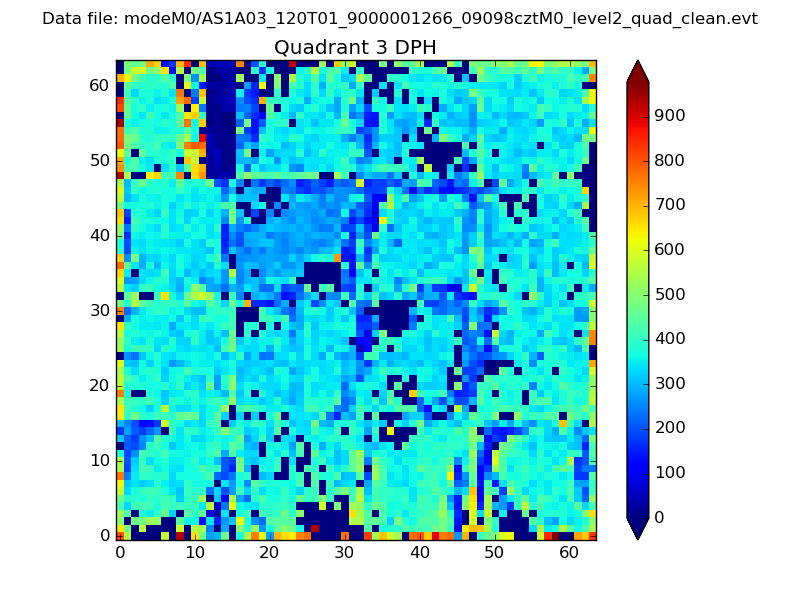 |
 |
Quadrant C |
| Plot type | Count rate plots | Images |
|---|---|---|
| Comparison with Poisson distribution Blue bars denote a histogram of data divided into 1 sec bins. Red curve is a Poisson curve with rate = median count rate of data. |
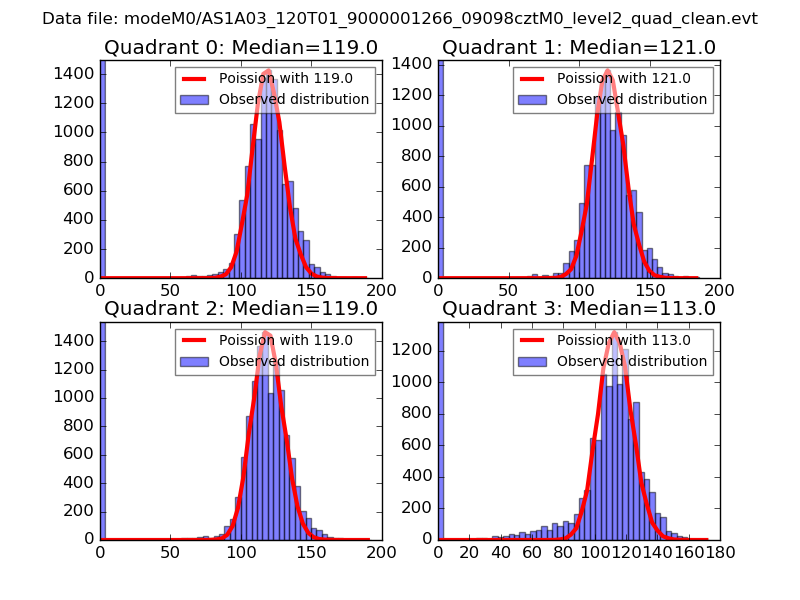 |
 |
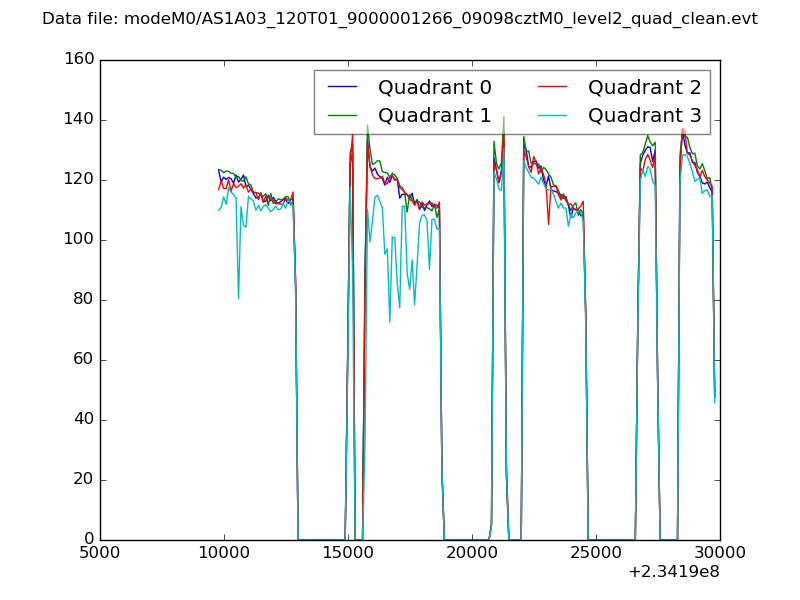
| Quadrant-wise count rates Data is divided into 100 sec bins |
 |
|
| Module-wise count rates for Quadrant A Data is divided into 100 sec bins |
 |
 |
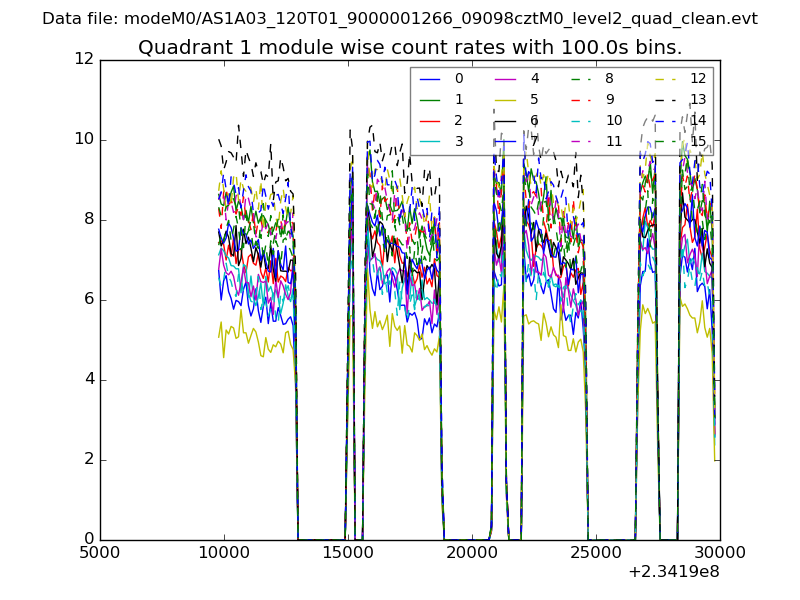
| Module-wise count rates for Quadrant B Data is divided into 100 sec bins |
 |
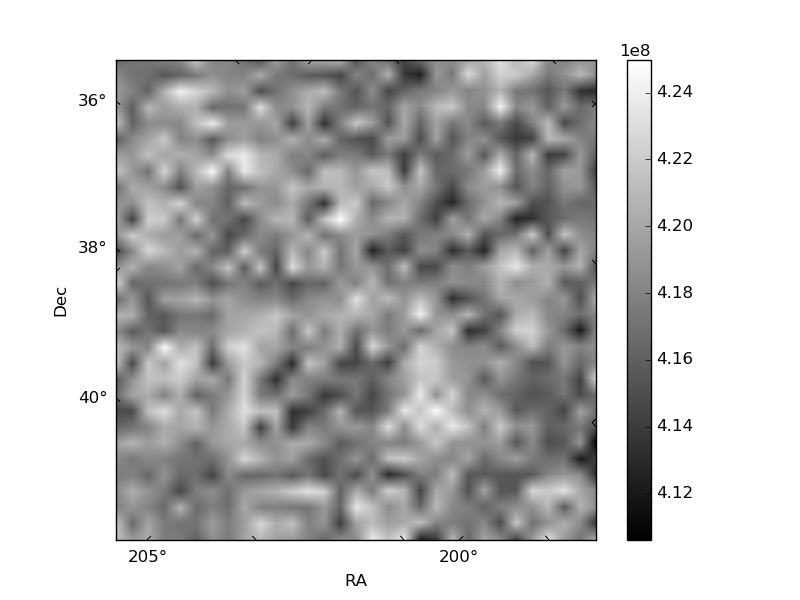 |
| Module-wise count rates for Quadrant C Data is divided into 100 sec bins |
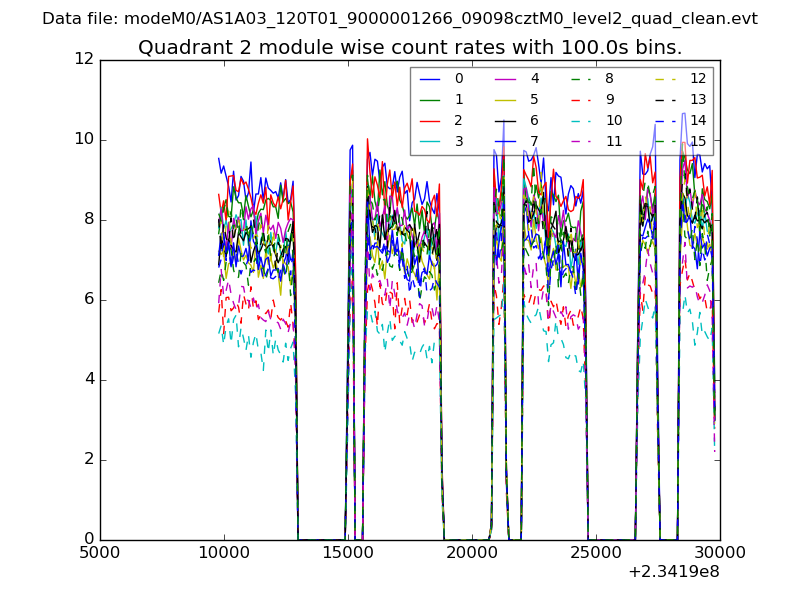 |
 |
| Module-wise count rates for Quadrant D Data is divided into 100 sec bins |
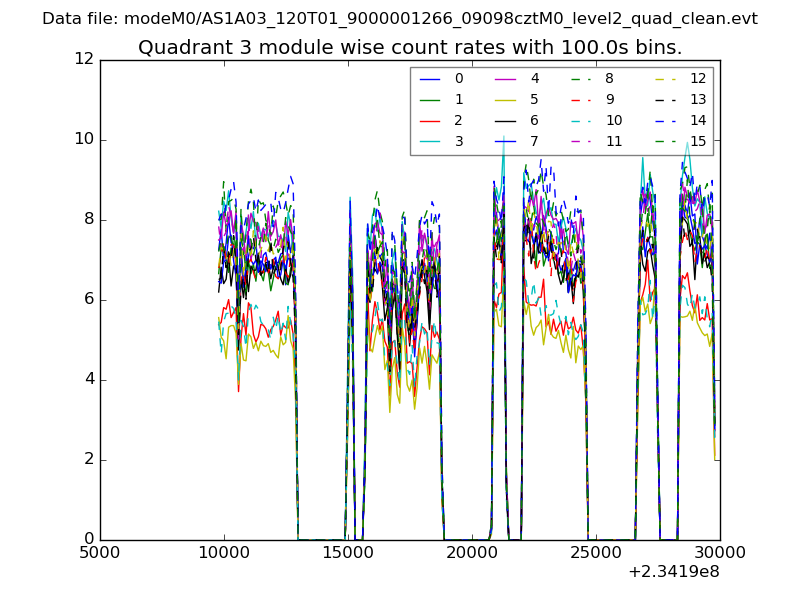 |
 |
| Parameter | Plot |
|---|---|
| CZT HV Monitor | 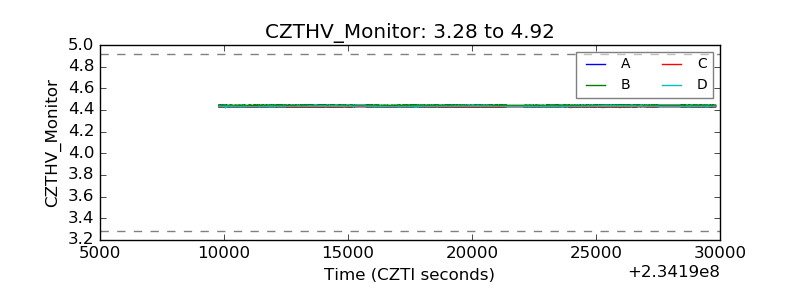 |
| D_VDD | 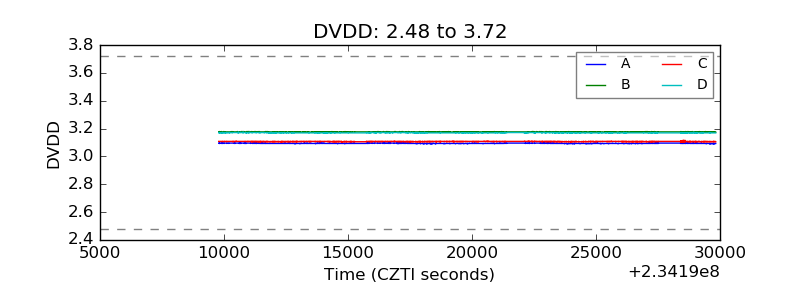 |
| Temperature 1 |  |
| Veto HV Monitor | 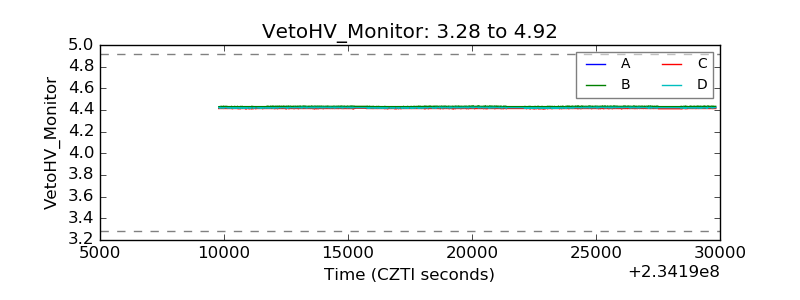 |
| Veto LLD |  |
| Alpha Counter | 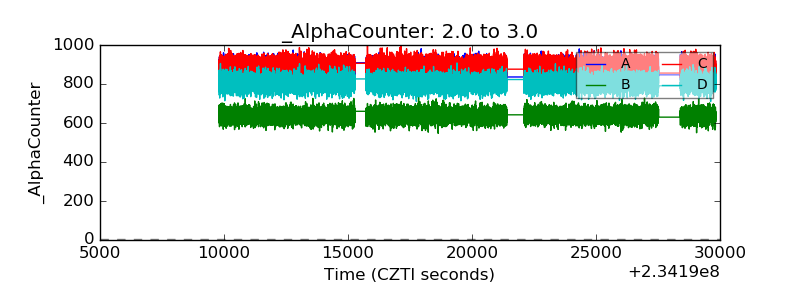 |
| _CPM_Rate | 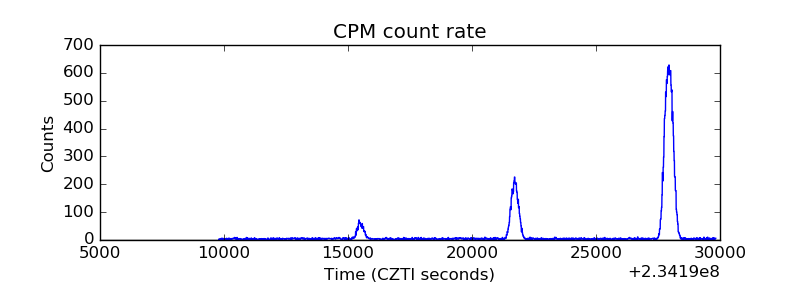 |
| CZT Counter | 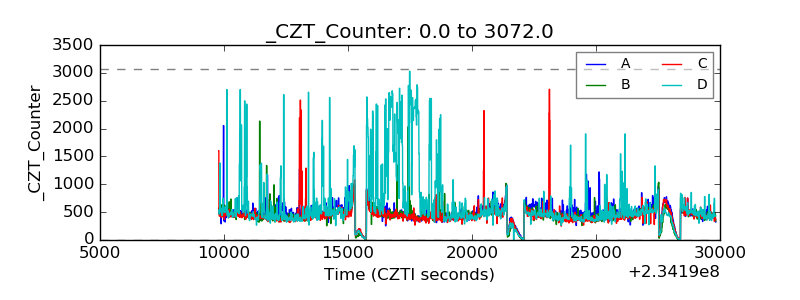 |
| +2.5 Volts monitor |  |
| +5 Volts monitor |  |
| _ROLL_ROT | 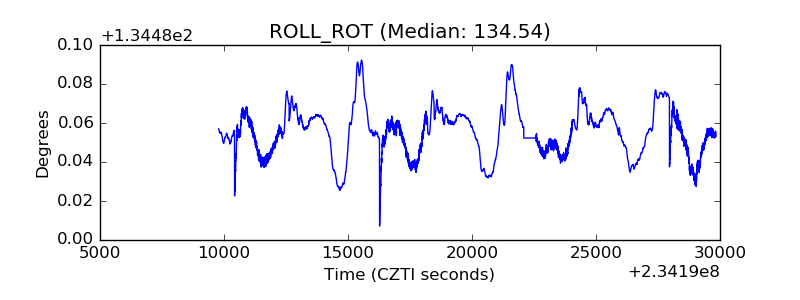 |
| _Roll_DEC | 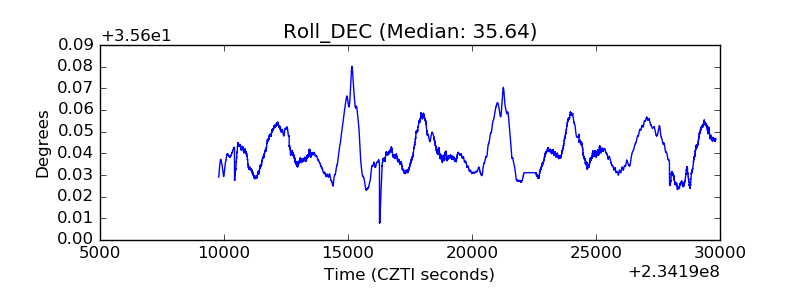 |
| _Roll_RA | 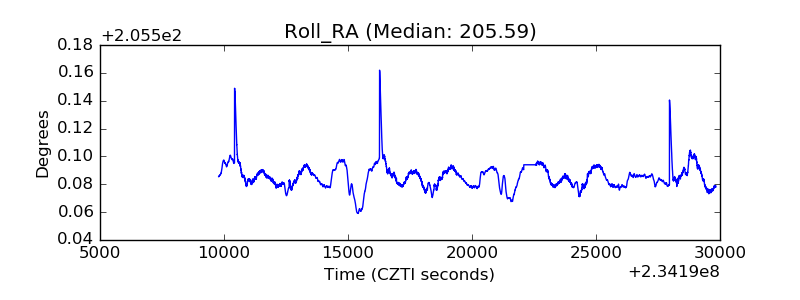 |
| Veto Counter | 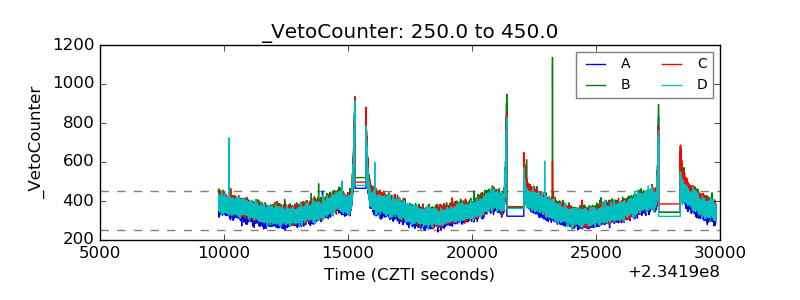 |