| Param | Original file | Final file |
|---|---|---|
| Filename | modeM0/AS1A03_120T01_9000001266_09102cztM0_level2.evt | modeM0/AS1A03_120T01_9000001266_09102cztM0_level2_quad_clean.evt |
| Size (bytes) | 422,441,280 | 79,845,120 |
| Size | 402.9 MB | 76.1 MB |
| Events in quadrant A | 3,213,738 | 503,368 |
| Events in quadrant B | 2,958,039 | 520,239 |
| Events in quadrant C | 2,840,999 | 497,567 |
| Events in quadrant D | 3,366,458 | 471,361 |
| Mode M9 | |||
|---|---|---|---|
| Quadrant | BADHDUFLAG | Total packets | Discarded packets |
| A | 0 | 16 | 0 |
| B | 0 | 16 | 0 |
| C | 0 | 16 | 0 |
| D | 0 | 17 | 0 |
| Mode M0 | |||
|---|---|---|---|
| Quadrant | BADHDUFLAG | Total packets | Discarded packets |
| A | 0 | 13752 | 529 |
| B | 0 | 13041 | 413 |
| C | 0 | 12940 | 432 |
| D | 0 | 14638 | 472 |
| Mode SS | |||
|---|---|---|---|
| Quadrant | BADHDUFLAG | Total packets | Discarded packets |
| A | 0 | 128 | 0 |
| B | 0 | 128 | 6 |
| C | 0 | 128 | 8 |
| D | 0 | 128 | 4 |
| Quadrant | Total seconds | Saturated seconds | Saturation percentage |
|---|---|---|---|
| A | 6076 | 25 | 0.411455% |
| B | 6098 | 32 | 0.524762% |
| C | 6096 | 18 | 0.295276% |
| D | 6083 | 117 | 1.923393% |
Noise dominated data is calculated using 1-second bins in cleaned event files. If a bin has >2000 counts, and if more than 50% of those come from <1% of pixels, then it is considered to be noise-dominated and hence unusable.
| Quadrant | # 1 sec bins | Bins with >0 counts | Bins with >2000 counts | High rate bins dominated by noise | Noise dominated (total time) | Noise dominated (detector-on time) | Marked lightcurve |
|---|---|---|---|---|---|---|---|
| A | 7554 | 6238 | 3 | 3 | 0.04% | 0.05% | 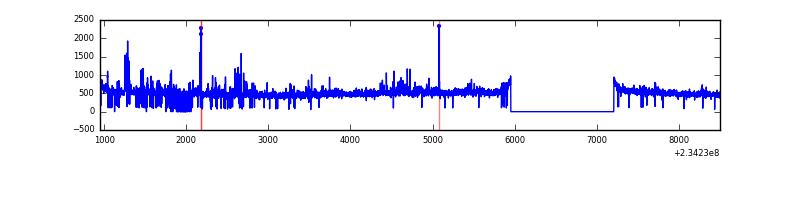 |
| B | 7554 | 6258 | 1 | 1 | 0.01% | 0.02% | 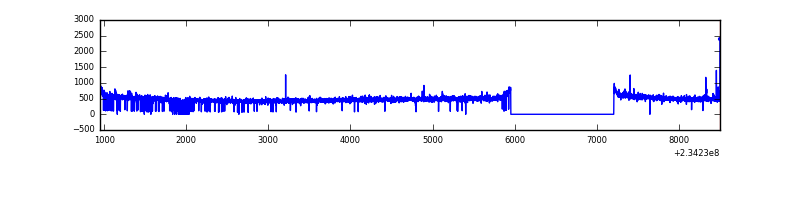 |
| C | 7554 | 6241 | 3 | 3 | 0.04% | 0.05% | 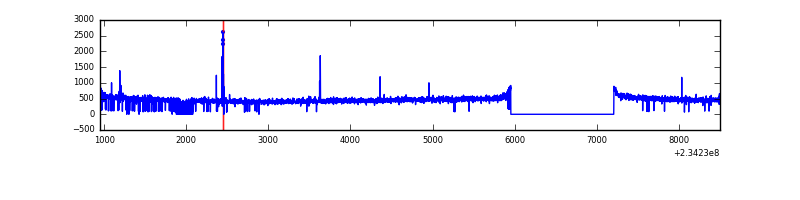 |
| D | 7553 | 6241 | 90 | 90 | 1.19% | 1.44% | 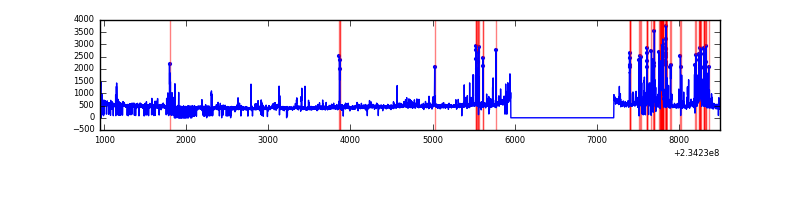 |
Top three noisy pixels from each quadrant. If the there are fewer than three noisy pixels in the level2.evt file, extra rows are filled as -1
| Pixel properties | Quadrant properties | ||||||
|---|---|---|---|---|---|---|---|
| Quadrant | DetID | PixID | Counts | Sigma | Mean | Median | Sigma |
| A | 8 | 5 | 328209 | 2178.52 | 740 | 725 | 150.3 |
| A | 15 | 174 | 16748 | 106.59 | 740 | 725 | 150.3 |
| A | 1 | 162 | 12523 | 78.48 | 740 | 725 | 150.3 |
| B | 12 | 111 | 15309 | 102.44 | 752 | 734 | 142.3 |
| B | 11 | 111 | 12753 | 84.47 | 752 | 734 | 142.3 |
| B | 0 | 198 | 11313 | 74.35 | 752 | 734 | 142.3 |
| C | 14 | 234 | 24577 | 143.61 | 720 | 725 | 166.1 |
| C | 13 | 61 | 5223 | 27.08 | 720 | 725 | 166.1 |
| C | 14 | 67 | 4699 | 23.93 | 720 | 725 | 166.1 |
| D | 2 | 14 | 264463 | 1457.55 | 703 | 684 | 181.0 |
| D | 1 | 52 | 148979 | 819.43 | 703 | 684 | 181.0 |
| D | 13 | 104 | 106696 | 585.79 | 703 | 684 | 181.0 |
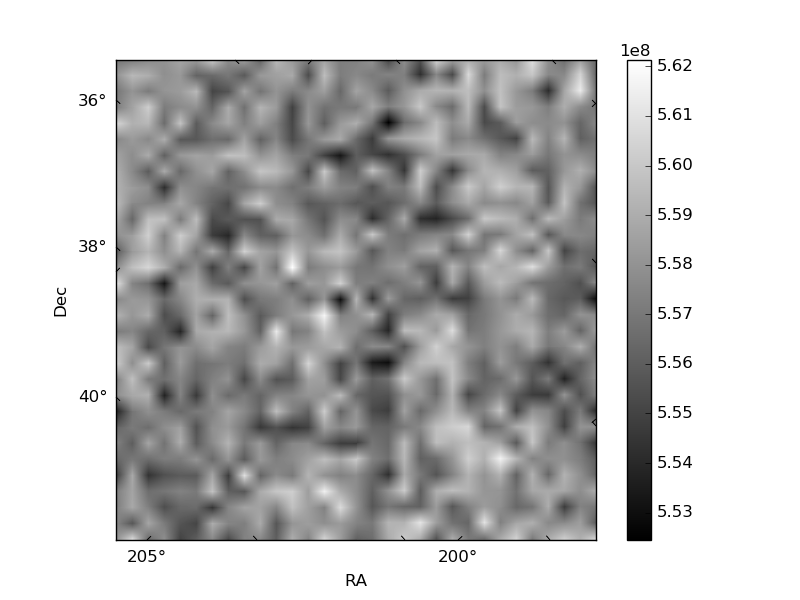
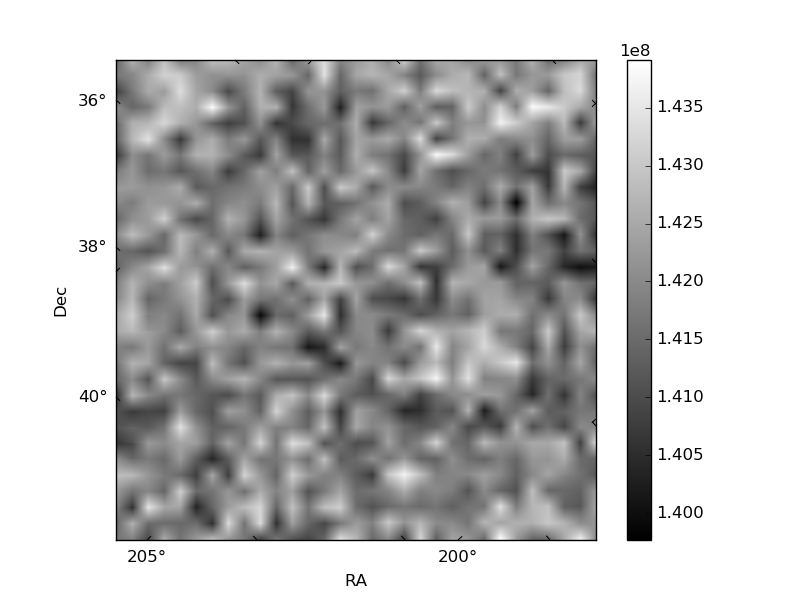
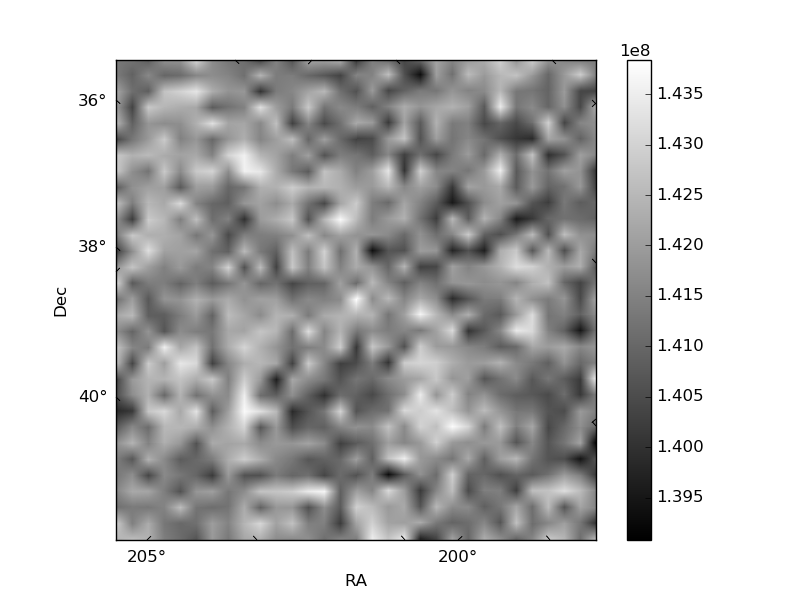
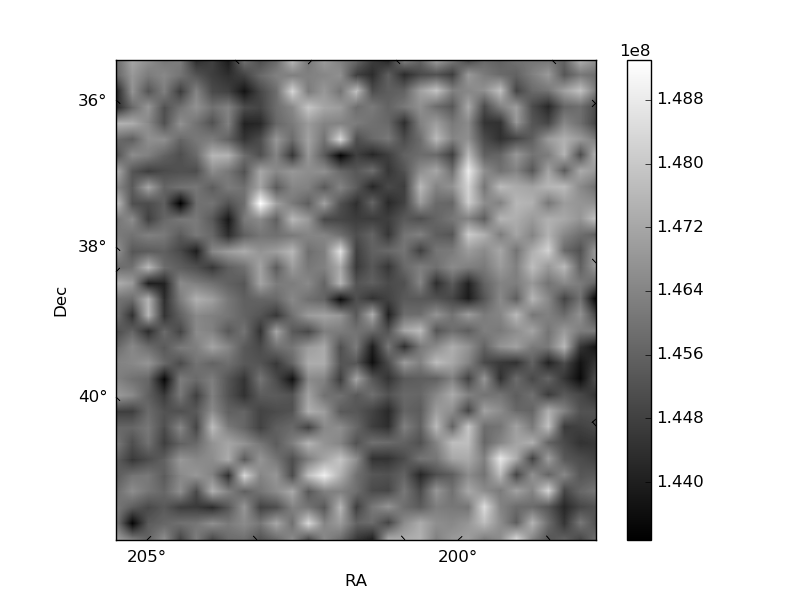
Histogram calculated using DETX and DETY for each event in the final _common_clean file
| Quadrant A | 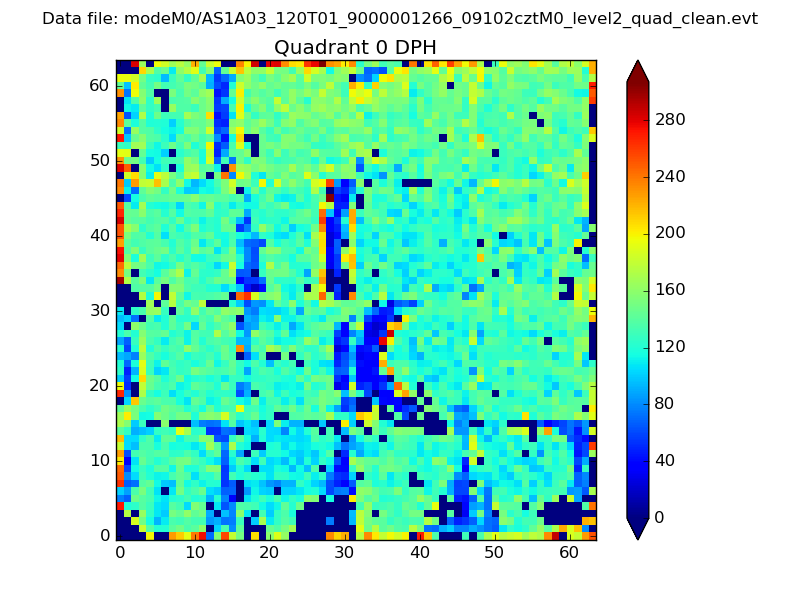 |
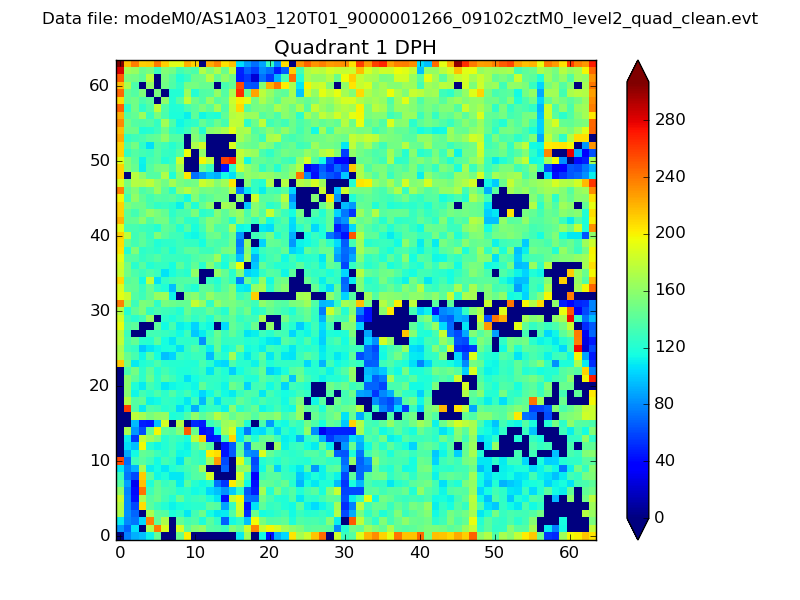 |
Quadrant B |
|---|---|---|---|
| Quadrant D | 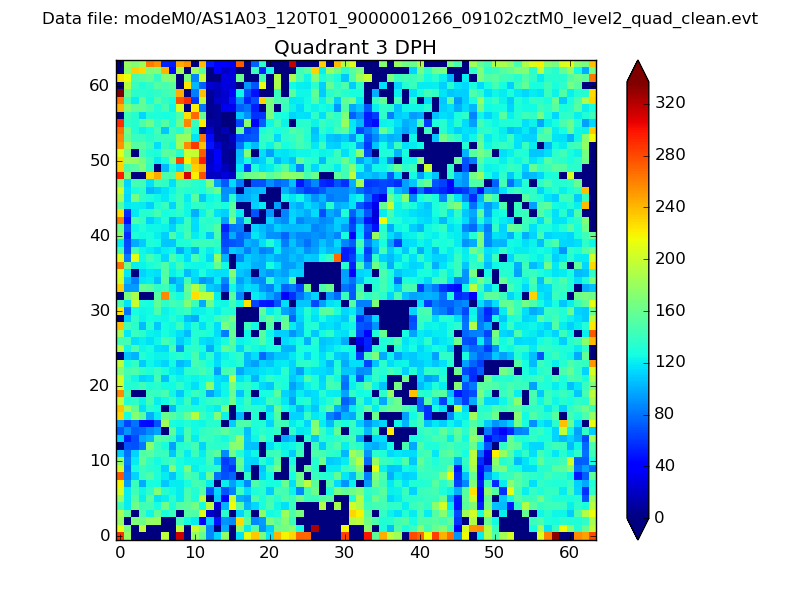 |
 |
Quadrant C |
| Plot type | Count rate plots | Images |
|---|---|---|
| Comparison with Poisson distribution Blue bars denote a histogram of data divided into 1 sec bins. Red curve is a Poisson curve with rate = median count rate of data. |
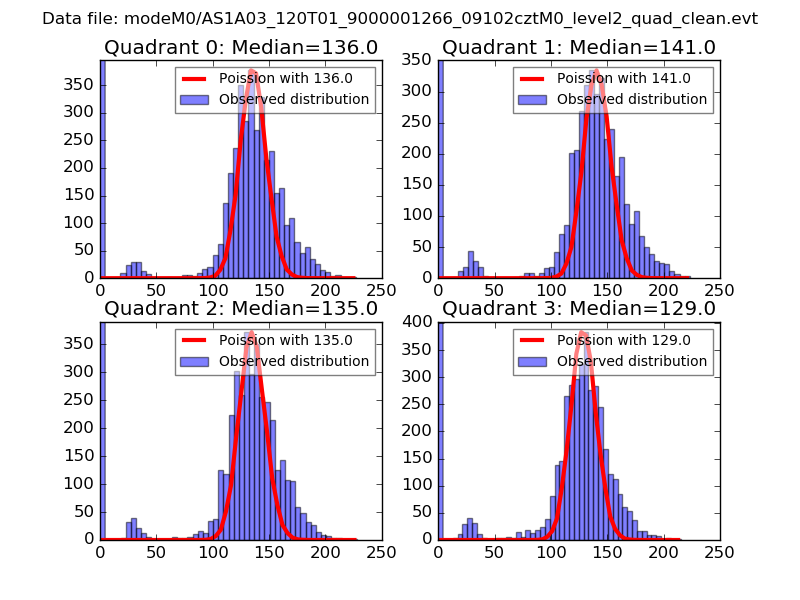 |
 |
| Quadrant-wise count rates Data is divided into 100 sec bins |
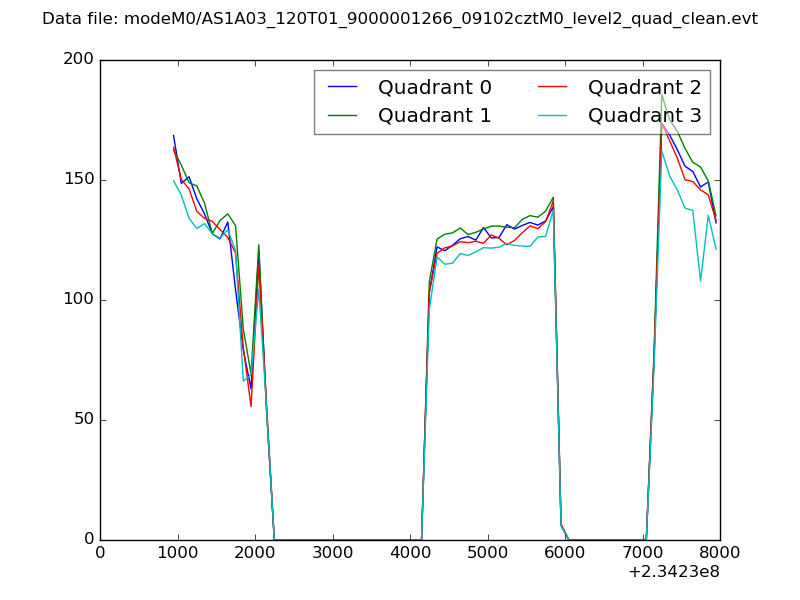 |
|
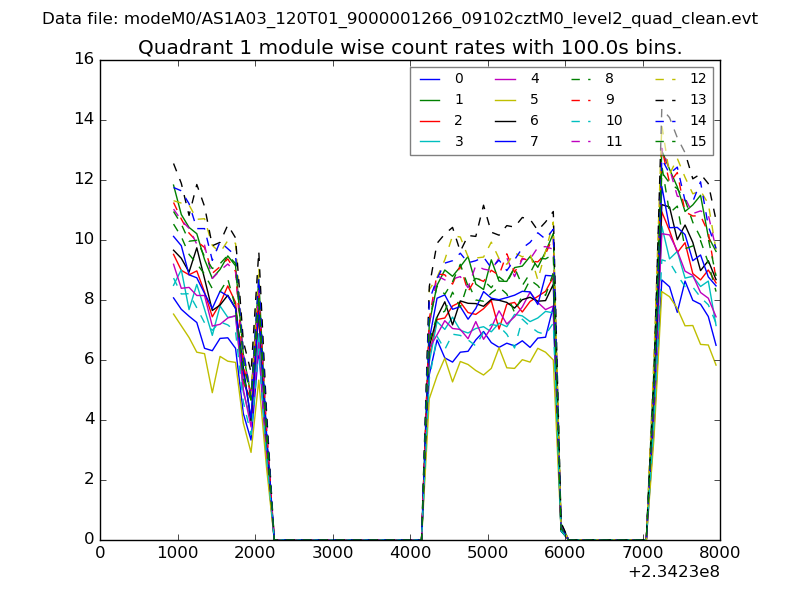
| Module-wise count rates for Quadrant A Data is divided into 100 sec bins |
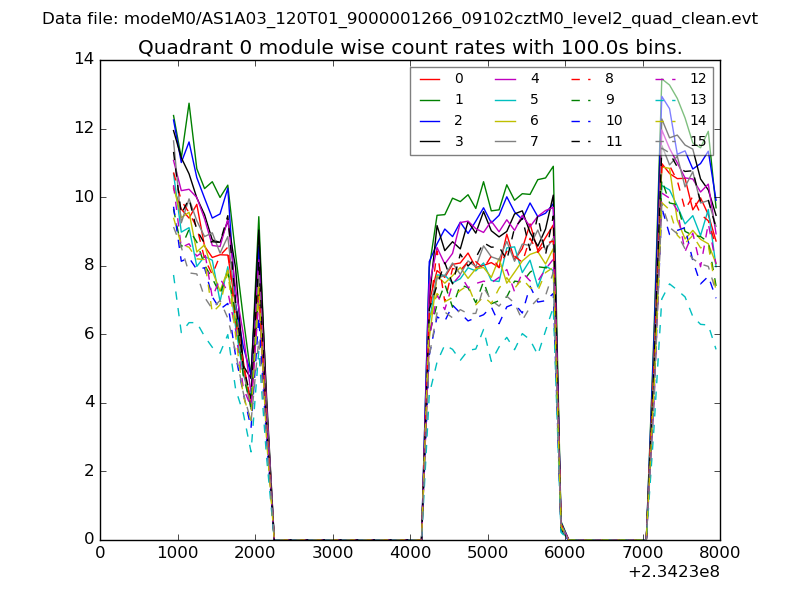 |
 |
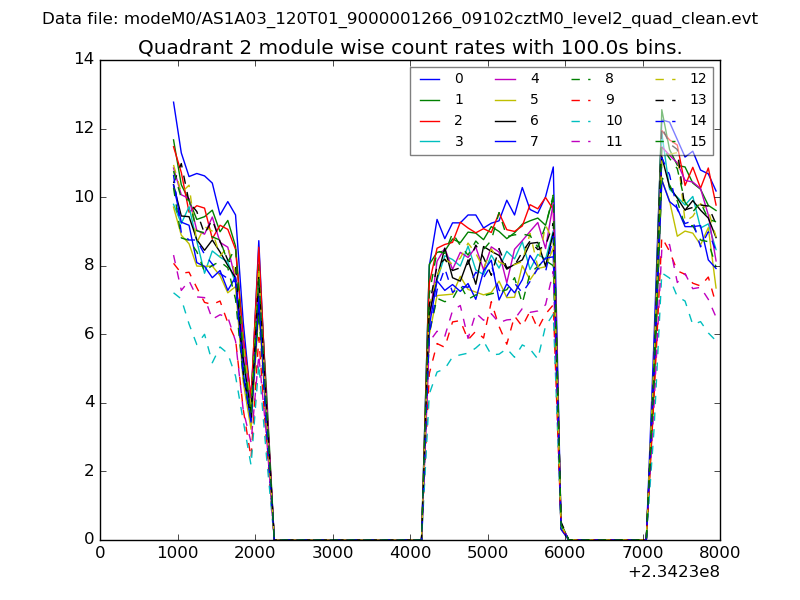
| Module-wise count rates for Quadrant B Data is divided into 100 sec bins |
 |
 |
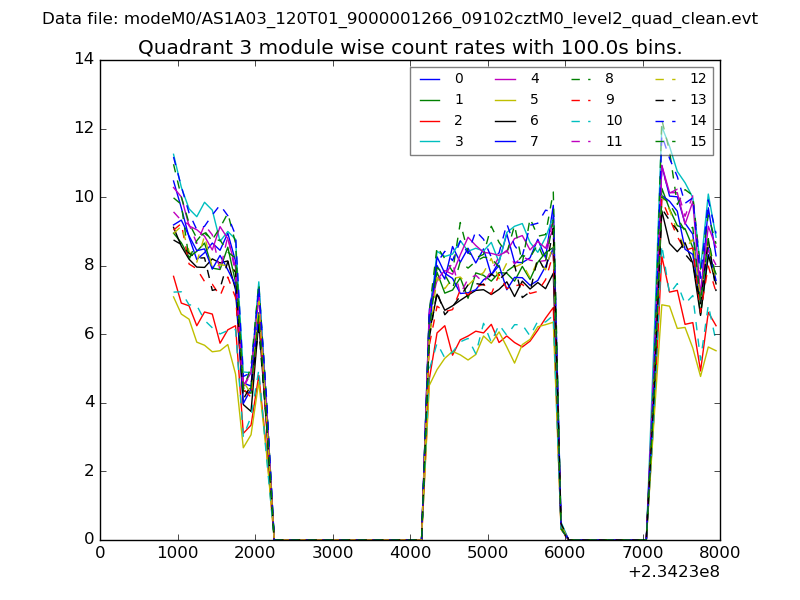
| Module-wise count rates for Quadrant C Data is divided into 100 sec bins |
 |
 |
| Module-wise count rates for Quadrant D Data is divided into 100 sec bins |
 |
 |
| Parameter | Plot |
|---|---|
| CZT HV Monitor | 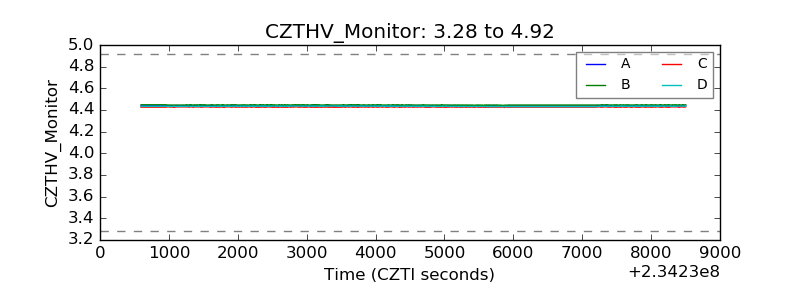 |
| D_VDD |  |
| Temperature 1 | 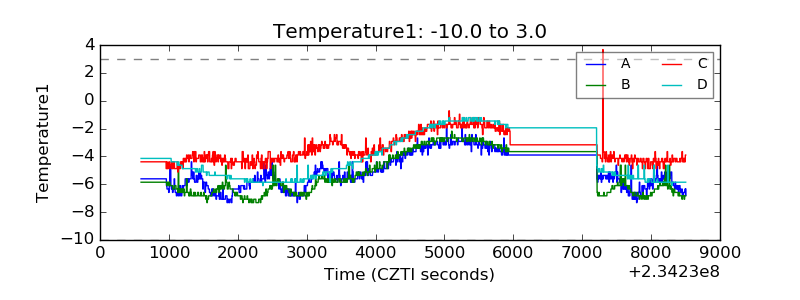 |
| Veto HV Monitor | 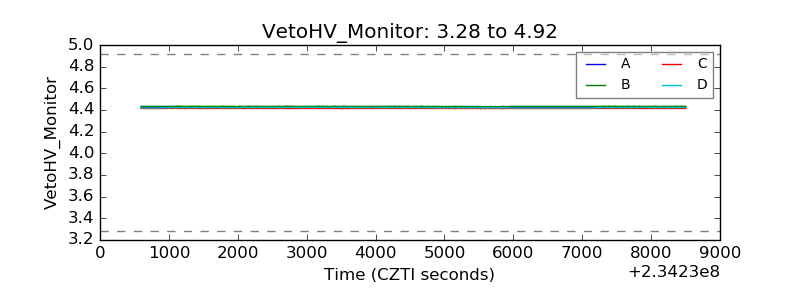 |
| Veto LLD | 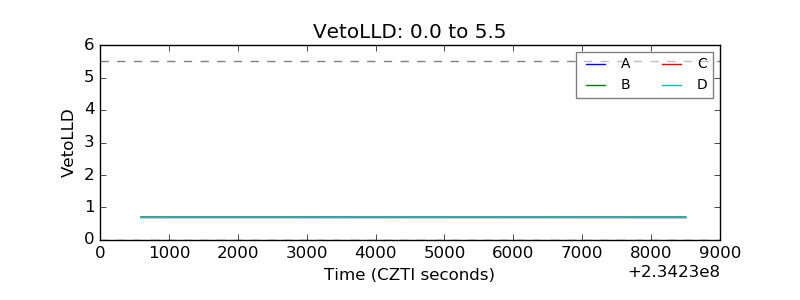 |
| Alpha Counter | 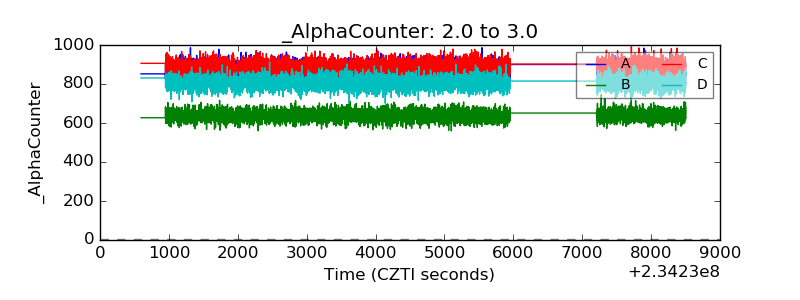 |
| _CPM_Rate | 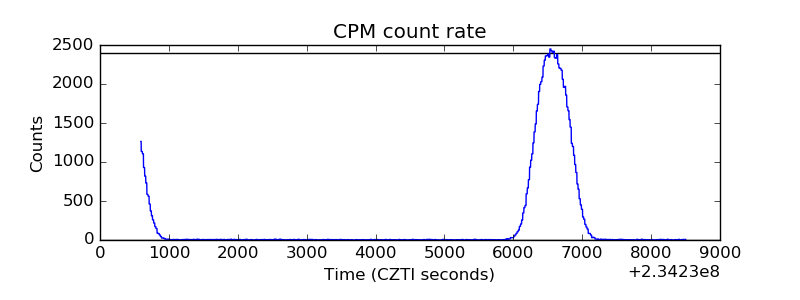 |
| CZT Counter | 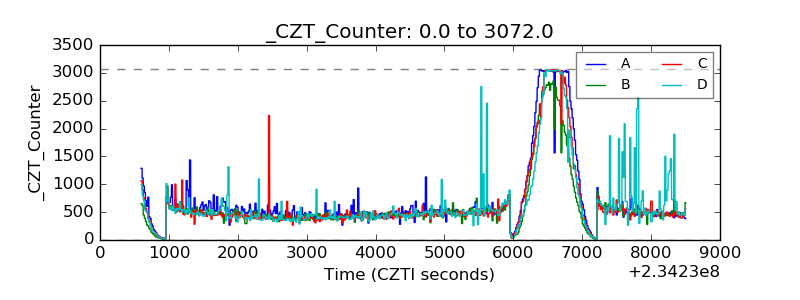 |
| +2.5 Volts monitor |  |
| +5 Volts monitor |  |
| _ROLL_ROT | 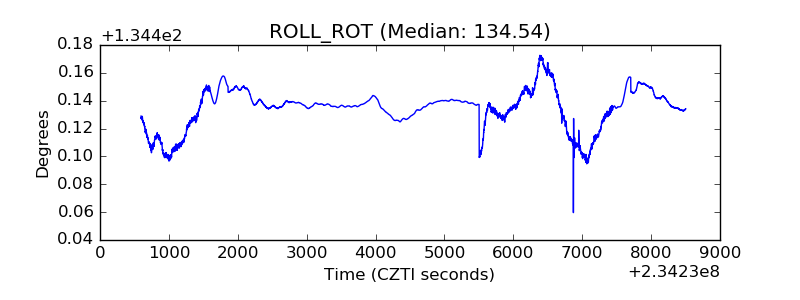 |
| _Roll_DEC | 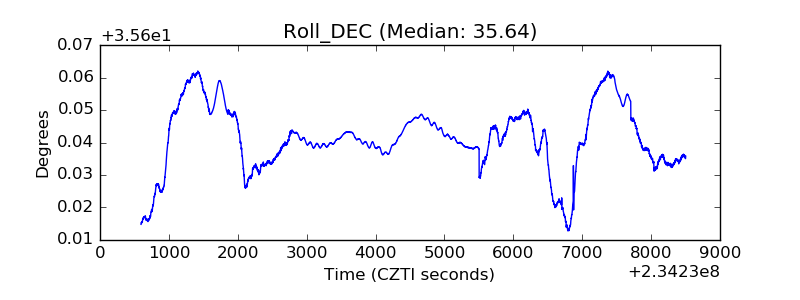 |
| _Roll_RA | 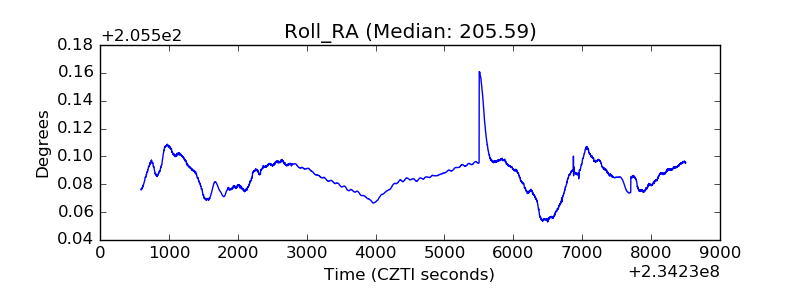 |
| Veto Counter | 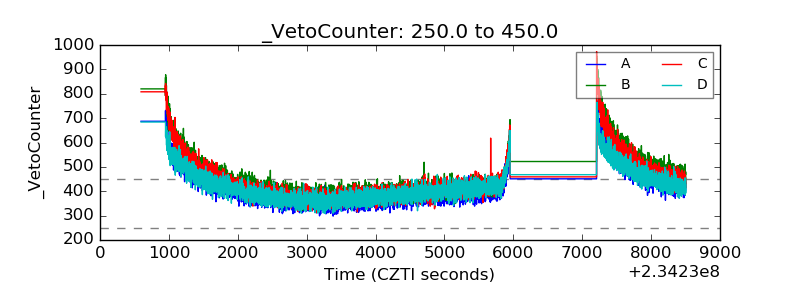 |